| Param | Original file | Final file |
|---|---|---|
| Filename | modeM0/AS1A09_085T02_9000003716_25477cztM0_level2.evt | modeM0/AS1A09_085T02_9000003716_25477cztM0_level2_quad_clean.evt |
| Size (bytes) | 250,623,360 | 71,432,640 |
| Size | 239.0 MB | 68.1 MB |
| Events in quadrant A | 1,633,593 | 498,628 |
| Events in quadrant B | 1,630,730 | 497,771 |
| Events in quadrant C | 2,408,870 | 459,327 |
| Events in quadrant D | 1,693,598 | 475,650 |
| Mode M0 | |||
|---|---|---|---|
| Quadrant | BADHDUFLAG | Total packets | Discarded packets |
| A | 0 | 6787 | 0 |
| B | 0 | 6772 | 0 |
| C | 0 | 9242 | 0 |
| D | 0 | 7053 | 0 |
| Quadrant | Total seconds | Saturated seconds | Saturation percentage |
|---|---|---|---|
| A | 3260 | 1 | 0.030675% |
| B | 3261 | 1 | 0.030665% |
| C | 3261 | 252 | 7.727691% |
| D | 3261 | 0 | 0.000000% |
Noise dominated data is calculated using 1-second bins in cleaned event files. If a bin has >2000 counts, and if more than 50% of those come from <1% of pixels, then it is considered to be noise-dominated and hence unusable.
| Quadrant | # 1 sec bins | Bins with >0 counts | Bins with >2000 counts | High rate bins dominated by noise | Noise dominated (total time) | Noise dominated (detector-on time) | Marked lightcurve |
|---|---|---|---|---|---|---|---|
| A | 3260 | 3260 | 0 | 0 | 0.00% | 0.00% | 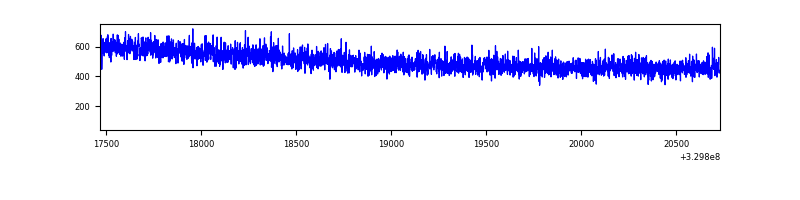 |
| B | 3261 | 3261 | 1 | 1 | 0.03% | 0.03% | 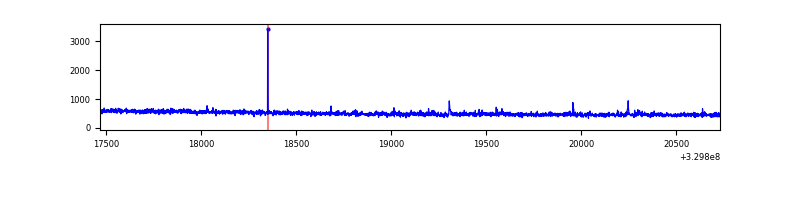 |
| C | 3261 | 3261 | 181 | 181 | 5.55% | 5.55% | 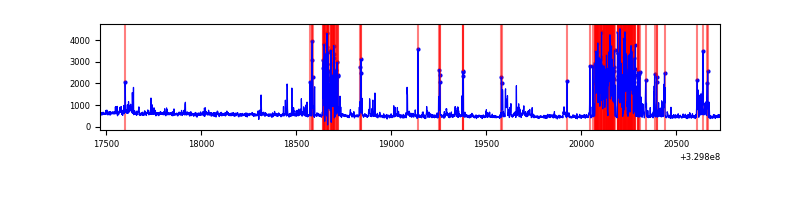 |
| D | 3261 | 3261 | 1 | 1 | 0.03% | 0.03% | 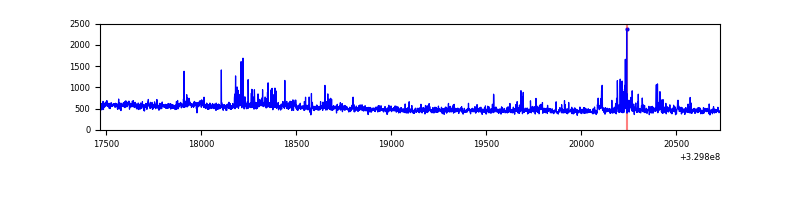 |
Top three noisy pixels from each quadrant. If the there are fewer than three noisy pixels in the level2.evt file, extra rows are filled as -1
| Pixel properties | Quadrant properties | ||||||
|---|---|---|---|---|---|---|---|
| Quadrant | DetID | PixID | Counts | Sigma | Mean | Median | Sigma |
| A | 13 | 254 | 4339 | 46.46 | 423 | 416 | 84.4 |
| A | 0 | 226 | 3670 | 38.54 | 423 | 416 | 84.4 |
| A | 3 | 137 | 3445 | 35.87 | 423 | 416 | 84.4 |
| B | 0 | 190 | 15651 | 194.26 | 410 | 403 | 78.5 |
| B | 12 | 111 | 8801 | 106.99 | 410 | 403 | 78.5 |
| B | 11 | 111 | 7977 | 96.49 | 410 | 403 | 78.5 |
| C | 2 | 16 | 826066 | 9226.6 | 387 | 391 | 89.5 |
| C | 14 | 238 | 63390 | 703.99 | 387 | 391 | 89.5 |
| C | 7 | 87 | 5941 | 62.02 | 387 | 391 | 89.5 |
| D | 1 | 52 | 43313 | 427.09 | 414 | 403 | 100.5 |
| D | 2 | 244 | 38497 | 379.16 | 414 | 403 | 100.5 |
| D | 8 | 195 | 33230 | 326.74 | 414 | 403 | 100.5 |
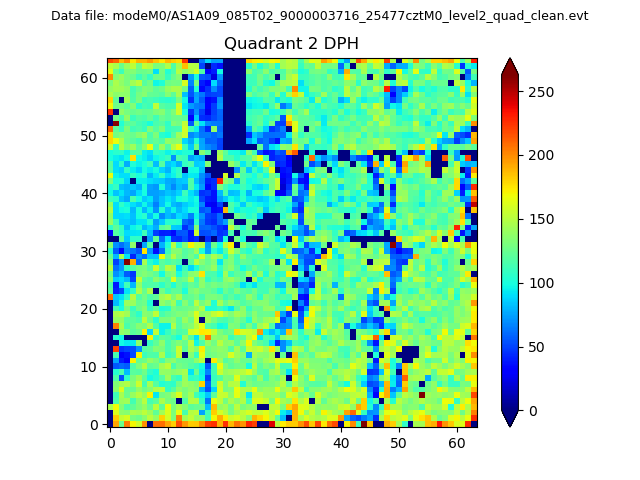
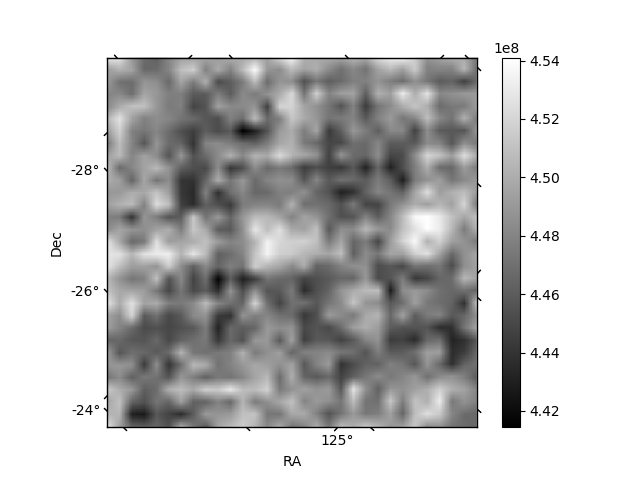
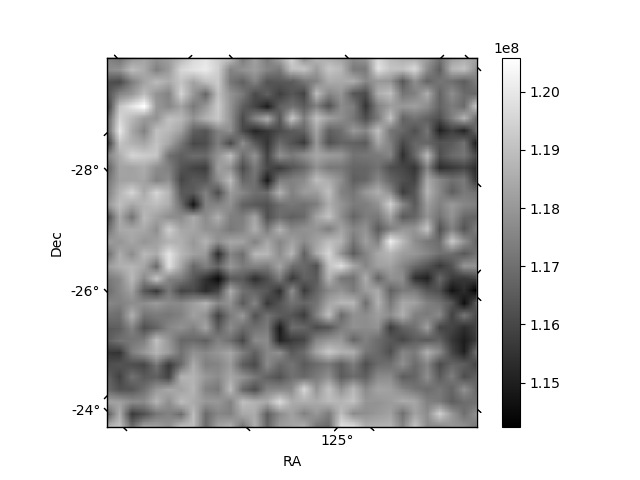
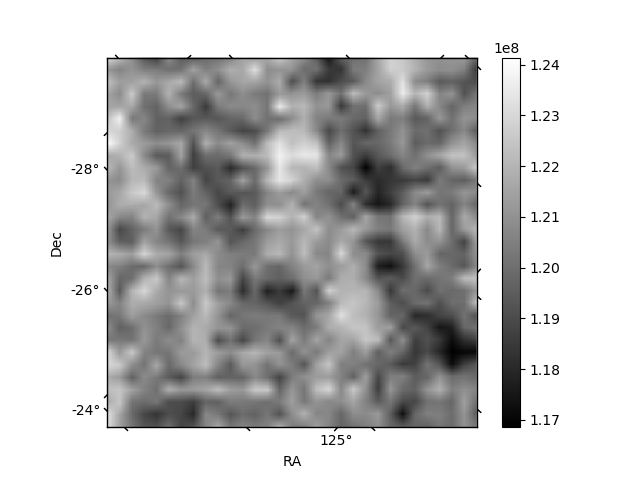
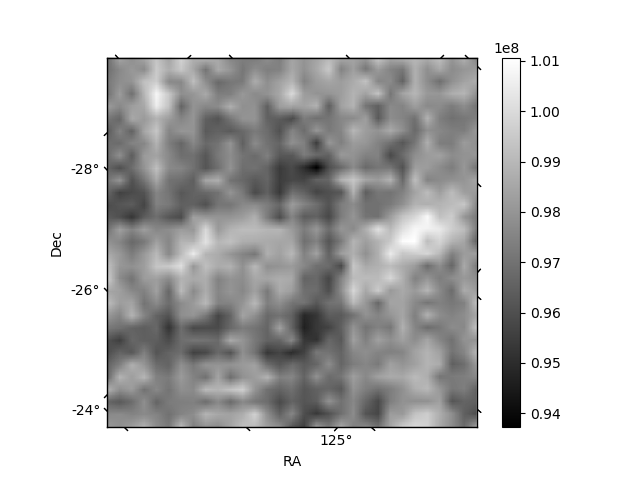
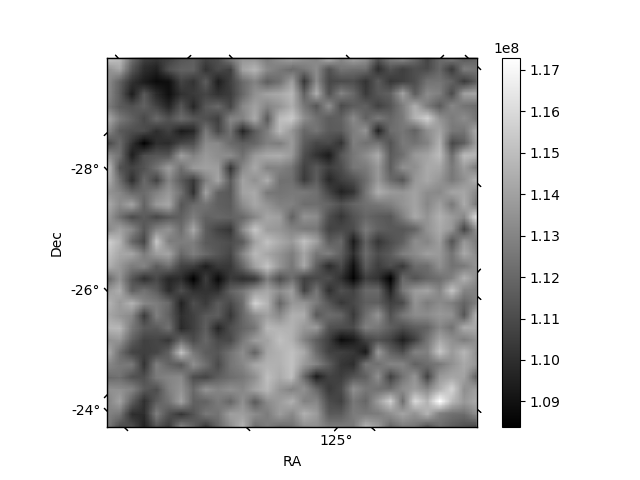
Histogram calculated using DETX and DETY for each event in the final _common_clean file
| Quadrant A | 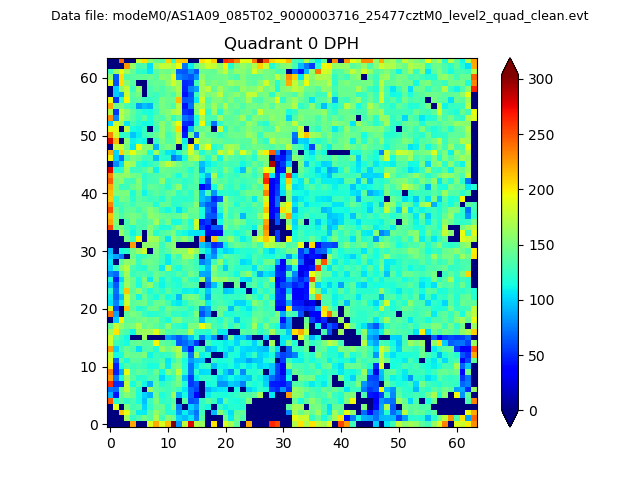 |
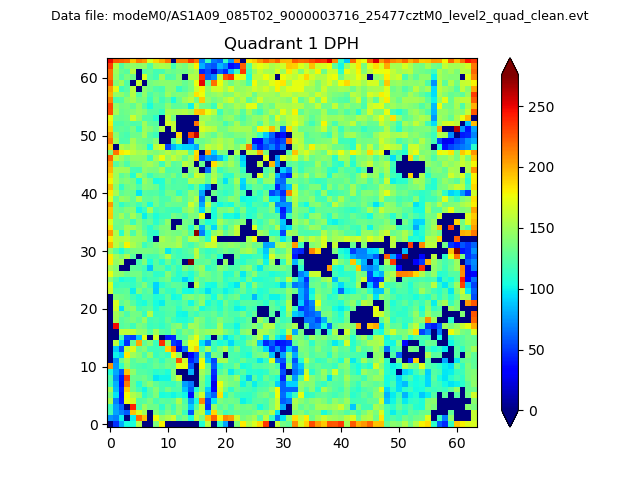 |
Quadrant B |
|---|---|---|---|
| Quadrant D | 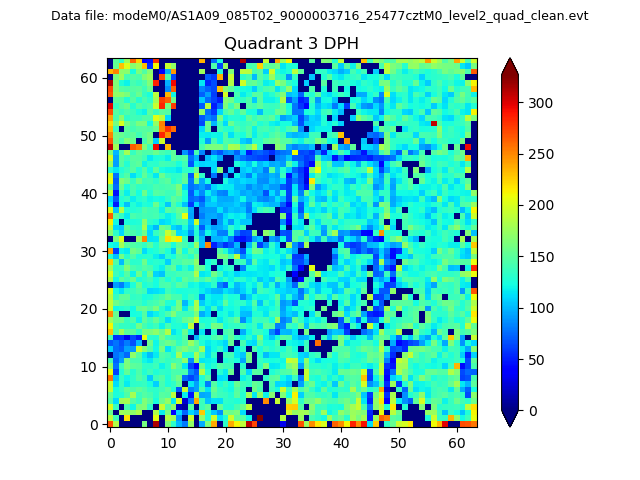 |
 |
Quadrant C |
| Plot type | Count rate plots | Images |
|---|---|---|
| Comparison with Poisson distribution Blue bars denote a histogram of data divided into 1 sec bins. Red curve is a Poisson curve with rate = median count rate of data. |
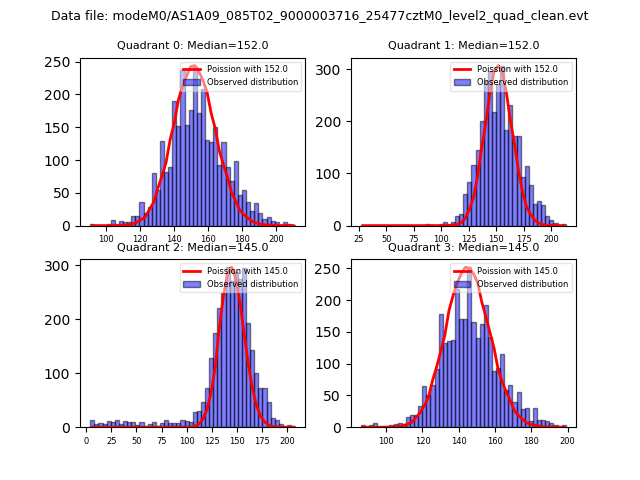 |
 |
| Quadrant-wise count rates Data is divided into 100 sec bins |
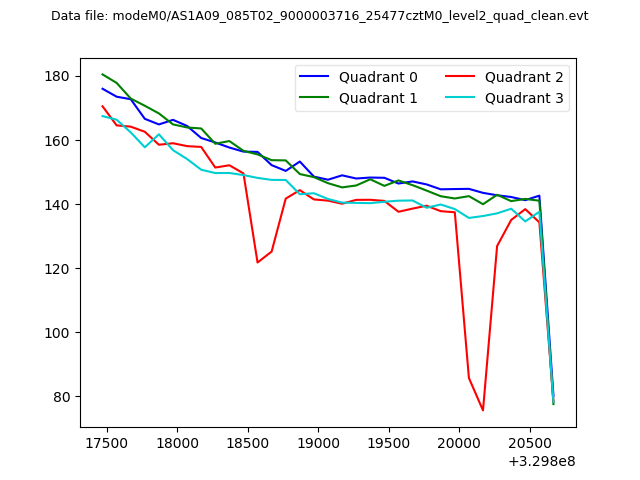 |
|
| Module-wise count rates for Quadrant A Data is divided into 100 sec bins |
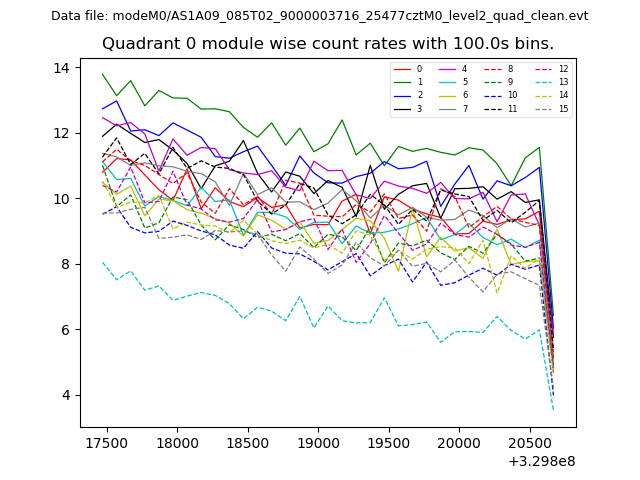 |
 |
| Module-wise count rates for Quadrant B Data is divided into 100 sec bins |
 |
 |
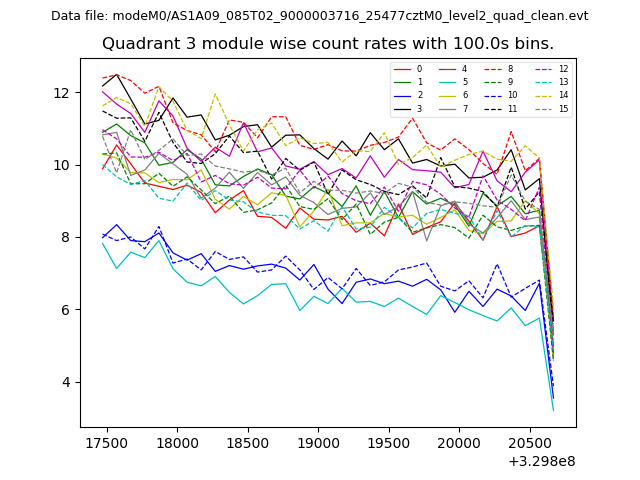
| Module-wise count rates for Quadrant C Data is divided into 100 sec bins |
 |
 |
| Module-wise count rates for Quadrant D Data is divided into 100 sec bins |
 |
 |
| Parameter | Plot |
|---|---|
| CZT HV Monitor |  |
| D_VDD | 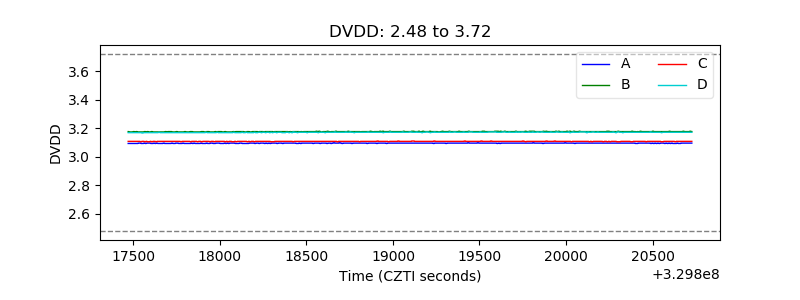 |
| Temperature 1 | 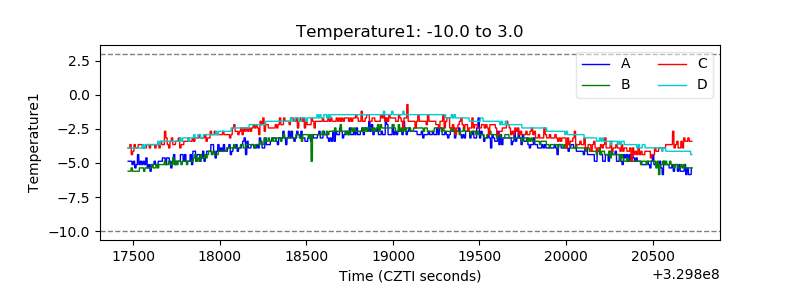 |
| Veto HV Monitor | 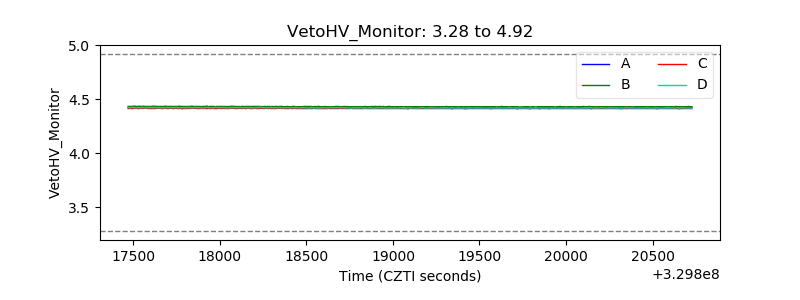 |
| Veto LLD | 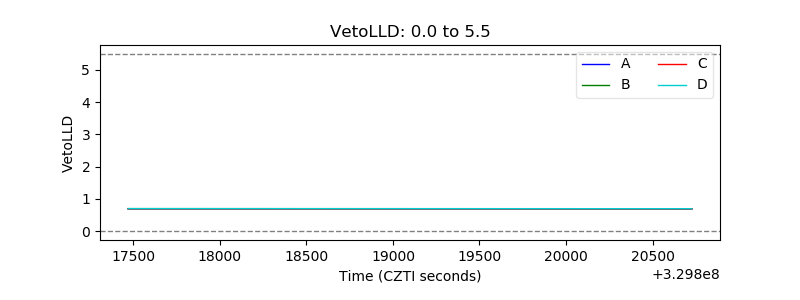 |
| Alpha Counter | 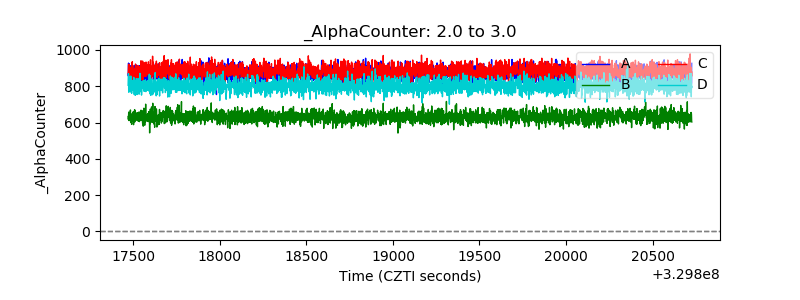 |
| _CPM_Rate | 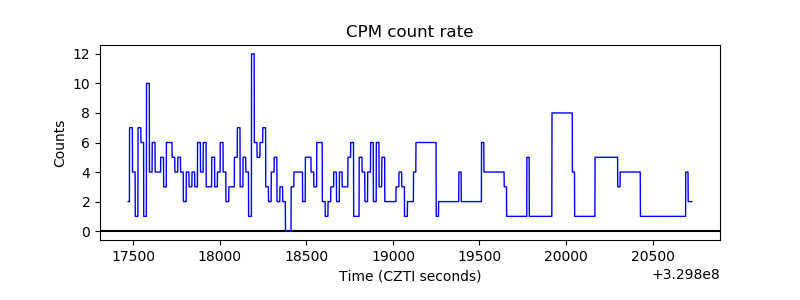 |
| CZT Counter | 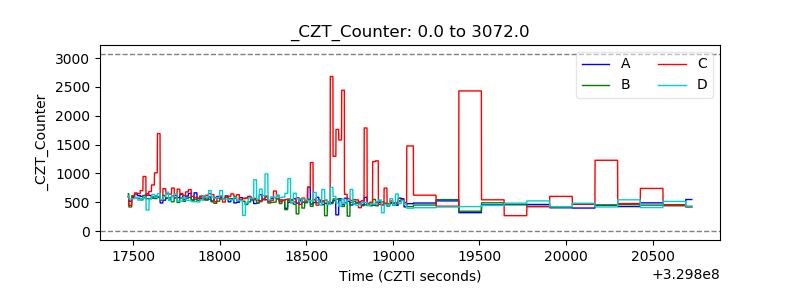 |
| +2.5 Volts monitor |  |
| +5 Volts monitor |  |
| _ROLL_ROT | 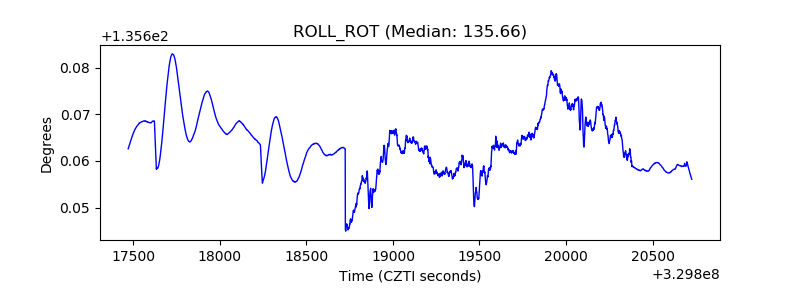 |
| _Roll_DEC | 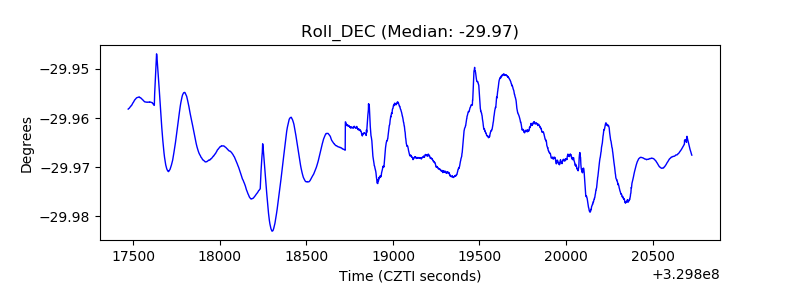 |
| _Roll_RA | 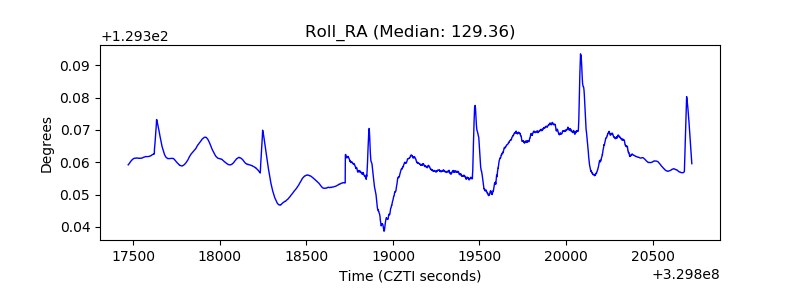 |
| Veto Counter | 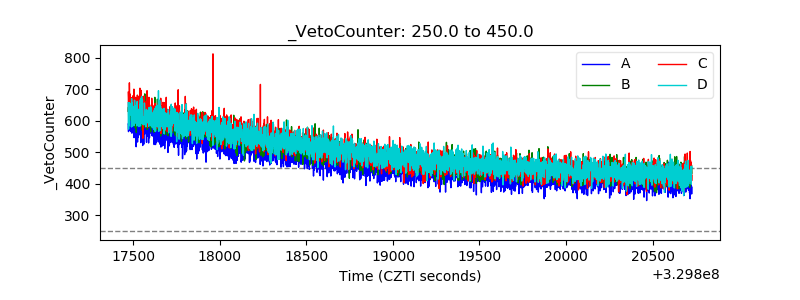 |