| Param | Original file | Final file |
|---|---|---|
| Filename | modeM0/AS1C05_012T07_9000003718cztM0_level2.fits | modeM0/AS1C05_012T07_9000003718cztM0_level2_quad_clean.evt |
| Size (bytes) | 814,829,760 | 972,060,480 |
| Size | 777.1 MB | 927.0 MB |
| Events in quadrant A | 5,098,962 | 6,283,071 |
| Events in quadrant B | 4,800,926 | 6,190,771 |
| Events in quadrant C | 4,874,556 | 5,935,720 |
| Events in quadrant D | 4,220,392 | 5,350,026 |
| Mode M9 | |||
|---|---|---|---|
| Quadrant | BADHDUFLAG | Total packets | Discarded packets |
| A | 0 | 147 | 0 |
| B | 0 | 147 | 0 |
| C | 0 | 147 | 0 |
| D | 0 | 147 | 0 |
| Mode M0 | |||
|---|---|---|---|
| Quadrant | BADHDUFLAG | Total packets | Discarded packets |
| A | 0 | 169728 | 0 |
| B | 0 | 181498 | 0 |
| C | 0 | 170359 | 0 |
| D | 0 | 229753 | 0 |
| Mode SS | |||
|---|---|---|---|
| Quadrant | BADHDUFLAG | Total packets | Discarded packets |
| A | 0 | 1686 | 0 |
| B | 0 | 1686 | 0 |
| C | 0 | 1686 | 0 |
| D | 0 | 1686 | 0 |
| Quadrant | Total seconds | Saturated seconds | Saturation percentage |
|---|---|---|---|
| A | 82883 | 760 | 0.916955% |
| B | 82883 | 1900 | 2.292388% |
| C | 82883 | 1268 | 1.529867% |
| D | 82883 | 3466 | 4.181798% |
Noise dominated data is calculated using 1-second bins in cleaned event files. If a bin has >2000 counts, and if more than 50% of those come from <1% of pixels, then it is considered to be noise-dominated and hence unusable.
| Quadrant | # 1 sec bins | Bins with >0 counts | Bins with >2000 counts | High rate bins dominated by noise | Noise dominated (total time) | Noise dominated (detector-on time) | Marked lightcurve |
|---|---|---|---|---|---|---|---|
| A | 97418 | 82884 | 0 | 0 | 0.00% | 0.00% | 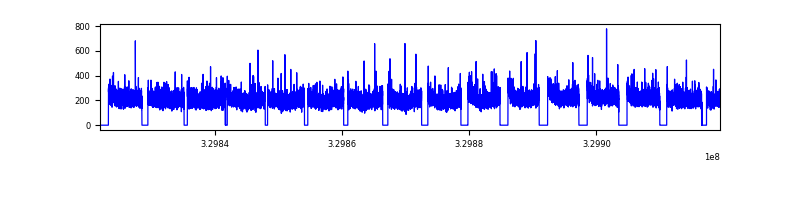 |
| B | 97418 | 82847 | 0 | 0 | 0.00% | 0.00% | 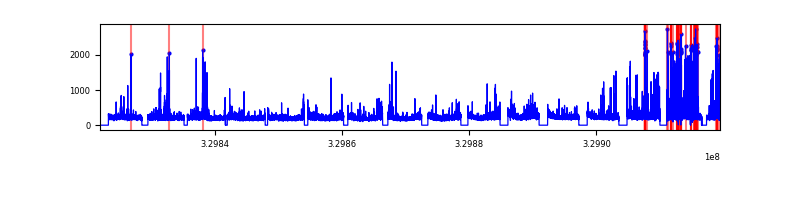 |
| C | 97418 | 82883 | 0 | 0 | 0.00% | 0.00% | 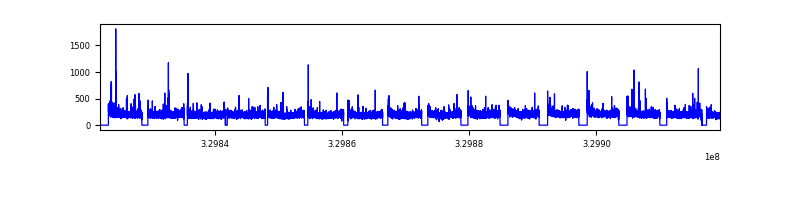 |
| D | 97418 | 82795 | 0 | 0 | 0.00% | 0.00% |  |
Top three noisy pixels from each quadrant. If the there are fewer than three noisy pixels in the level2.evt file, extra rows are filled as -1
| Pixel properties | Quadrant properties | ||||||
|---|---|---|---|---|---|---|---|
| Quadrant | DetID | PixID | Counts | Sigma | Mean | Median | Sigma |
| A | 0 | 29 | 4967 | 11.5 | 1328 | 1251 | 323.2 |
| A | 7 | 110 | 4173 | 9.04 | 1328 | 1251 | 323.2 |
| A | 0 | 30 | 3964 | 8.39 | 1328 | 1251 | 323.2 |
| B | 2 | 9 | 3721 | 10.35 | 1270 | 1220 | 241.6 |
| B | 14 | 254 | 3149 | 7.99 | 1270 | 1220 | 241.6 |
| B | 5 | 128 | 3136 | 7.93 | 1270 | 1220 | 241.6 |
| C | 12 | 241 | 3476 | 6.99 | 1287 | 1212 | 323.7 |
| C | 9 | 209 | 3306 | 6.47 | 1287 | 1212 | 323.7 |
| C | 3 | 126 | 3241 | 6.27 | 1287 | 1212 | 323.7 |
| D | 6 | 67 | 3014 | 6.0 | 1204 | 1099 | 319.1 |
| D | 3 | 14 | 2984 | 5.91 | 1204 | 1099 | 319.1 |
| D | 7 | 3 | 2967 | 5.85 | 1204 | 1099 | 319.1 |
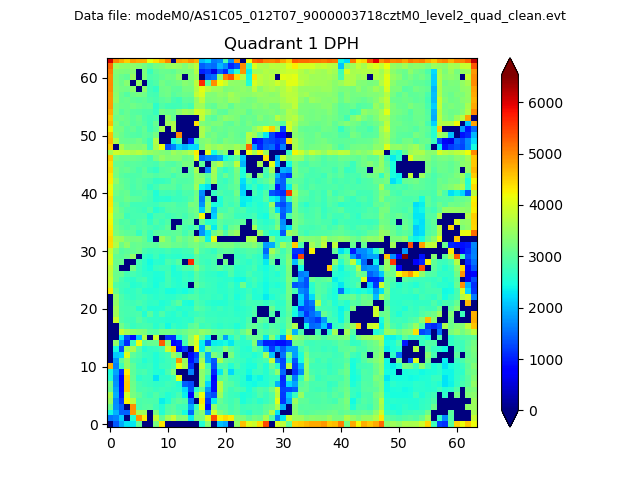
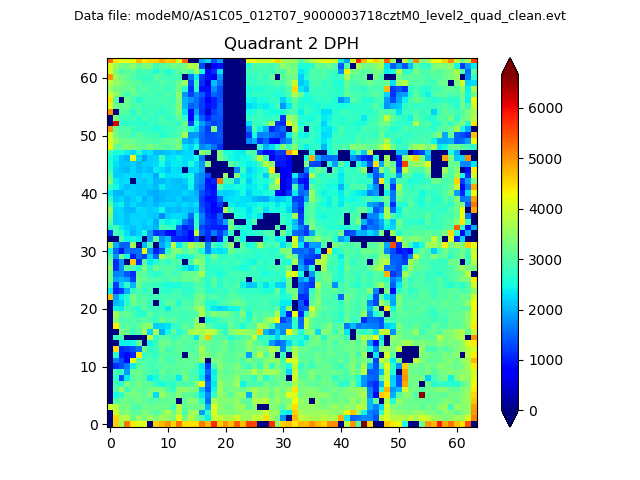
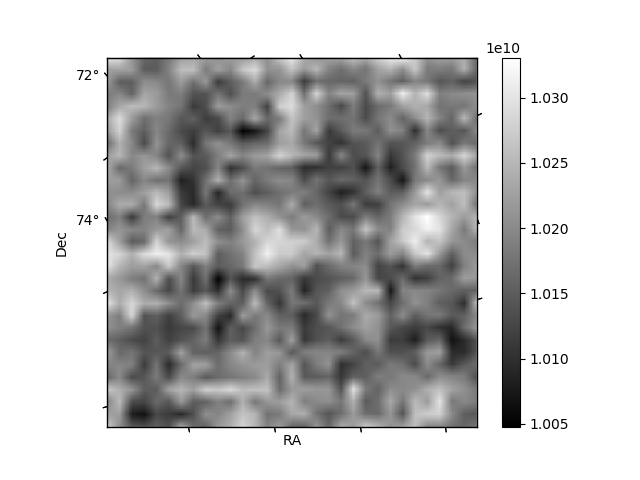
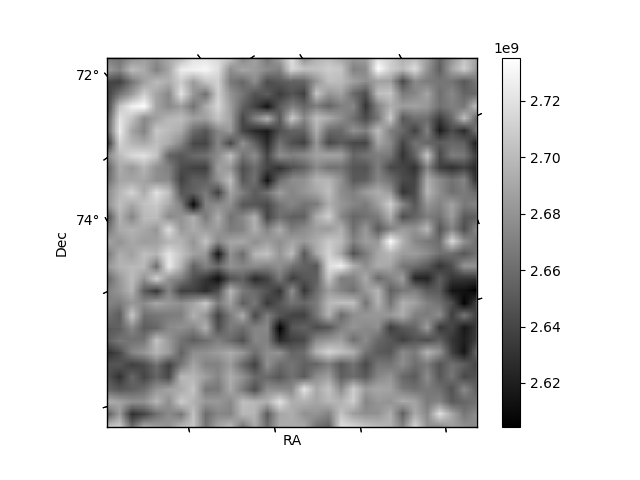
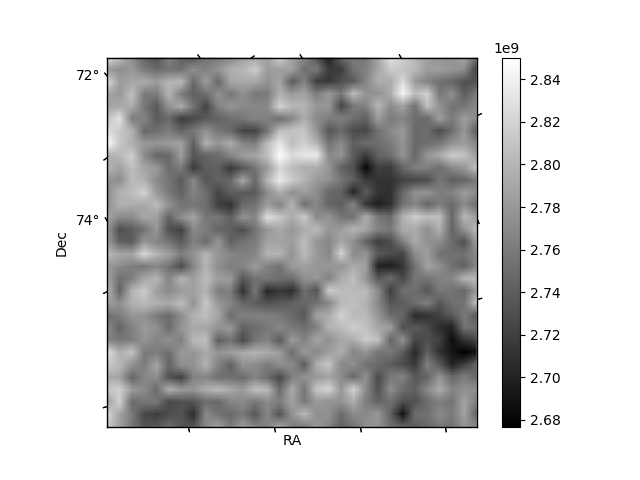
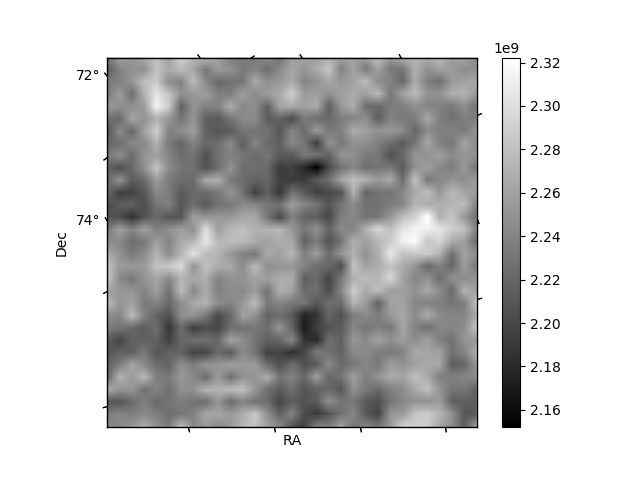
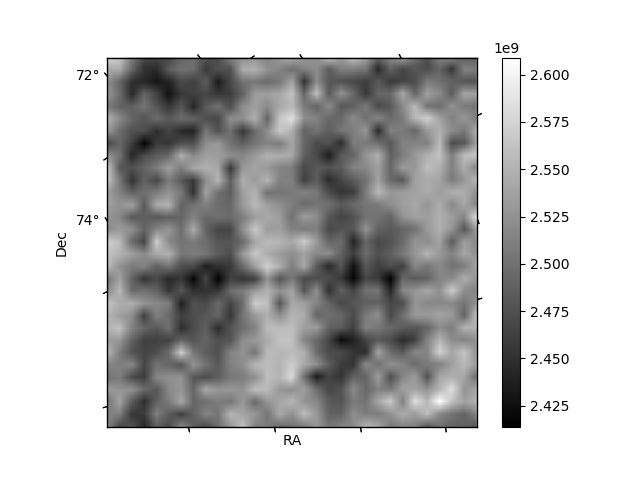
Histogram calculated using DETX and DETY for each event in the final _common_clean file
| Quadrant A | 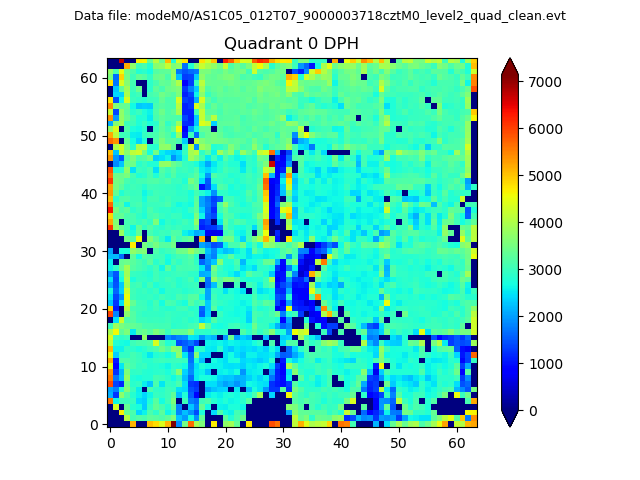 |
 |
Quadrant B |
|---|---|---|---|
| Quadrant D | 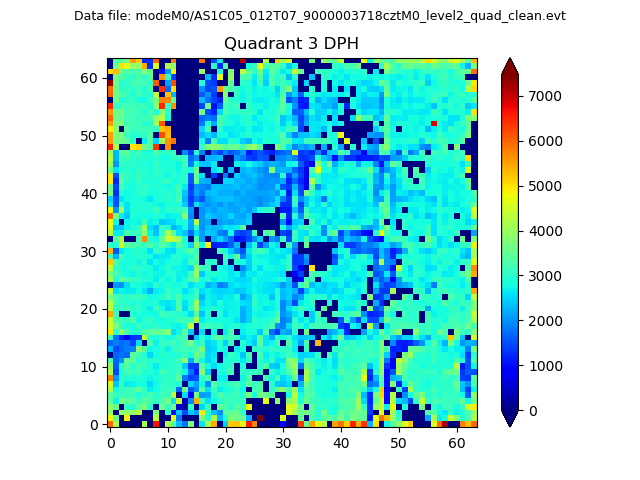 |
 |
Quadrant C |
| Plot type | Count rate plots | Images |
|---|---|---|
| Comparison with Poisson distribution Blue bars denote a histogram of data divided into 1 sec bins. Red curve is a Poisson curve with rate = median count rate of data. |
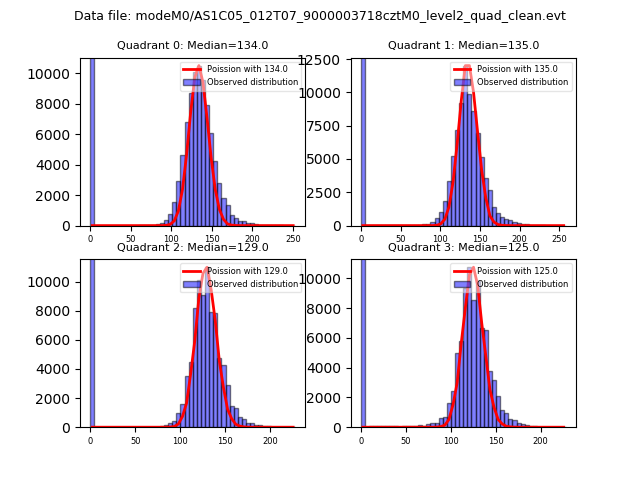 |
 |
| Quadrant-wise count rates Data is divided into 100 sec bins |
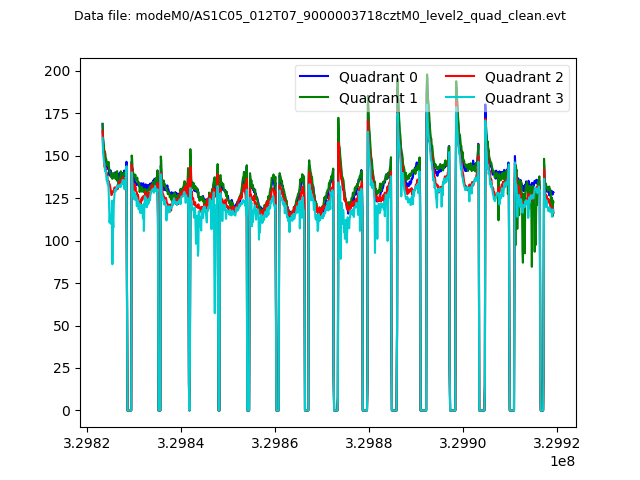 |
|
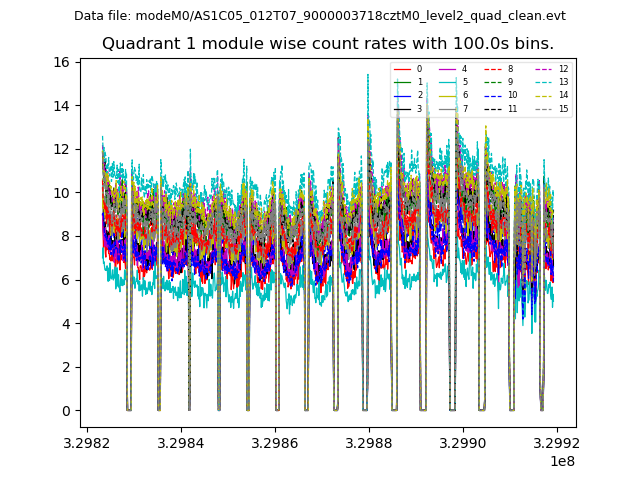
| Module-wise count rates for Quadrant A Data is divided into 100 sec bins |
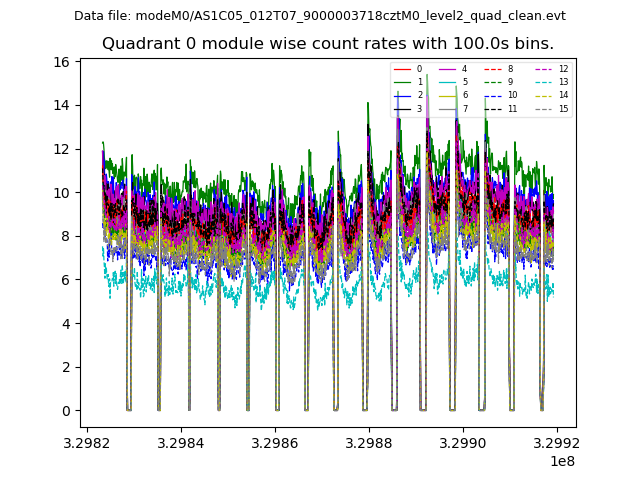 |
 |
| Module-wise count rates for Quadrant B Data is divided into 100 sec bins |
 |
 |
| Module-wise count rates for Quadrant C Data is divided into 100 sec bins |
 |
 |
| Module-wise count rates for Quadrant D Data is divided into 100 sec bins |
 |
 |
| Parameter | Plot |
|---|---|
| CZT HV Monitor | 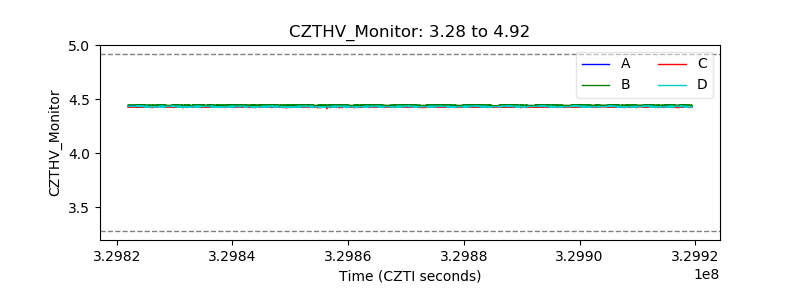 |
| D_VDD | 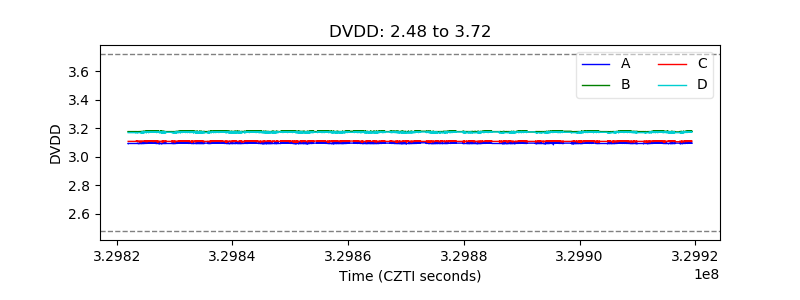 |
| Temperature 1 |  |
| Veto HV Monitor |  |
| Veto LLD | 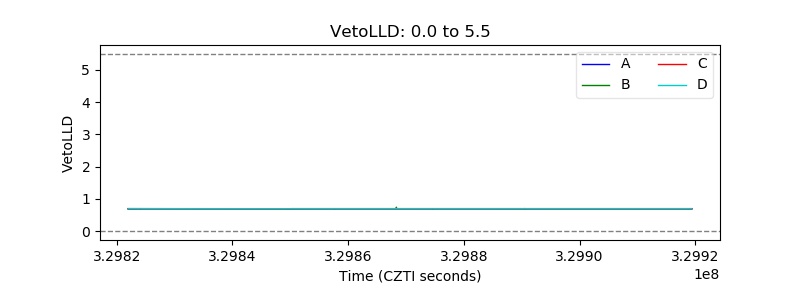 |
| Alpha Counter | 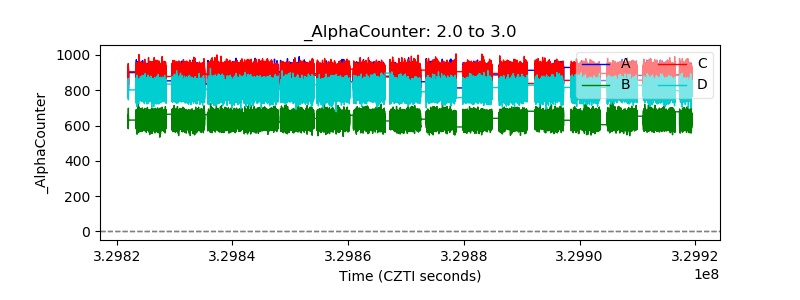 |
| _CPM_Rate | 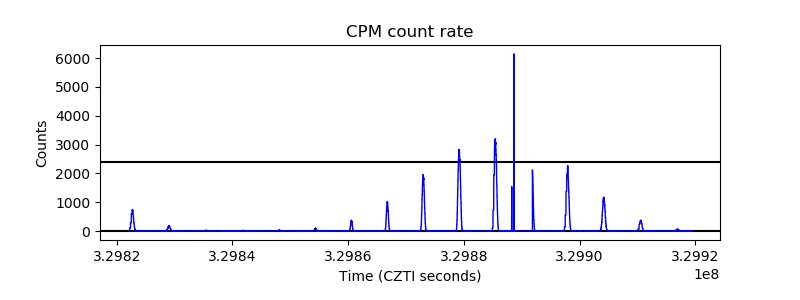 |
| CZT Counter |  |
| +2.5 Volts monitor | 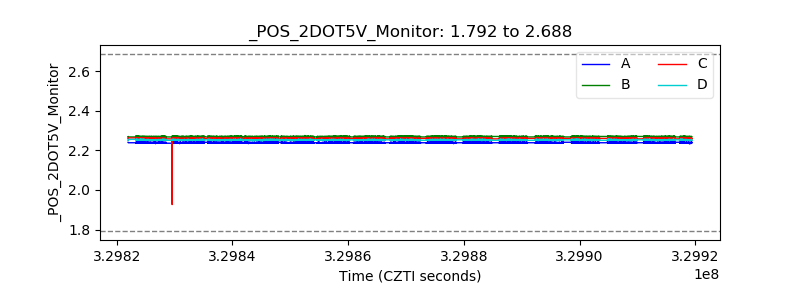 |
| +5 Volts monitor | 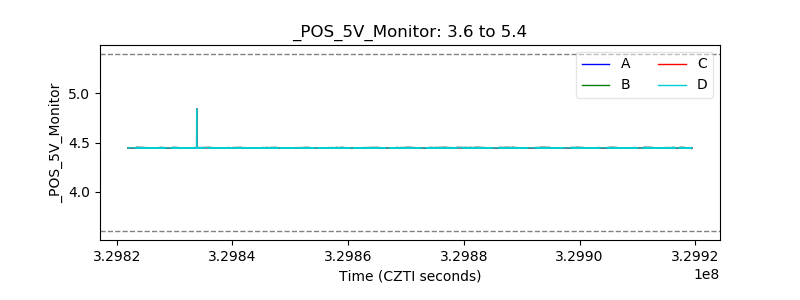 |
| _ROLL_ROT | 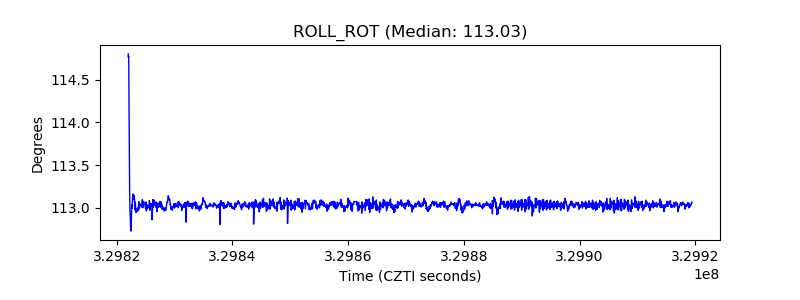 |
| _Roll_DEC | 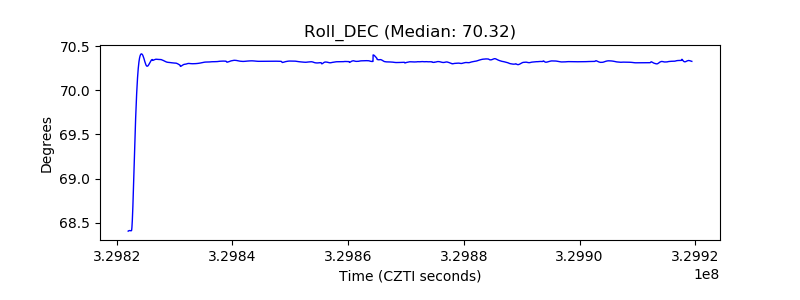 |
| _Roll_RA |  |
| Veto Counter | 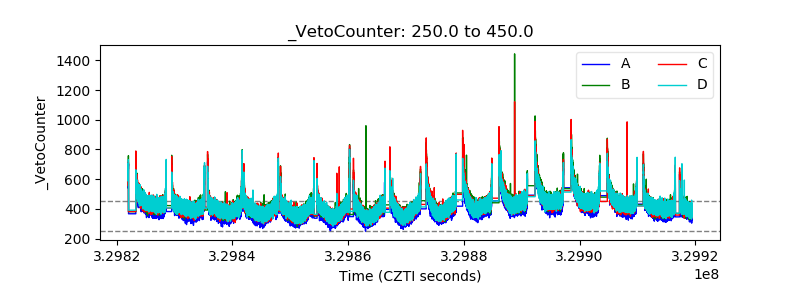 |