| Param | Original file | Final file |
|---|---|---|
| Filename | modeM0/AS1C05_012T07_9000003718_25477cztM0_level2.evt | modeM0/AS1C05_012T07_9000003718_25477cztM0_level2_quad_clean.evt |
| Size (bytes) | 98,242,560 | 29,177,280 |
| Size | 93.7 MB | 27.8 MB |
| Events in quadrant A | 718,925 | 198,779 |
| Events in quadrant B | 713,221 | 201,667 |
| Events in quadrant C | 751,581 | 191,864 |
| Events in quadrant D | 695,572 | 188,690 |
| Mode M9 | |||
|---|---|---|---|
| Quadrant | BADHDUFLAG | Total packets | Discarded packets |
| A | 0 | 13 | 0 |
| B | 0 | 13 | 0 |
| C | 0 | 13 | 0 |
| D | 0 | 13 | 0 |
| Mode M0 | |||
|---|---|---|---|
| Quadrant | BADHDUFLAG | Total packets | Discarded packets |
| A | 0 | 2879 | 0 |
| B | 0 | 2873 | 0 |
| C | 0 | 3027 | 0 |
| D | 0 | 2863 | 0 |
| Quadrant | Total seconds | Saturated seconds | Saturation percentage |
|---|---|---|---|
| A | 1372 | 45 | 3.279883% |
| B | 1372 | 50 | 3.644315% |
| C | 1372 | 55 | 4.008746% |
| D | 1372 | 39 | 2.842566% |
Noise dominated data is calculated using 1-second bins in cleaned event files. If a bin has >2000 counts, and if more than 50% of those come from <1% of pixels, then it is considered to be noise-dominated and hence unusable.
| Quadrant | # 1 sec bins | Bins with >0 counts | Bins with >2000 counts | High rate bins dominated by noise | Noise dominated (total time) | Noise dominated (detector-on time) | Marked lightcurve |
|---|---|---|---|---|---|---|---|
| A | 2642 | 1373 | 0 | 0 | 0.00% | 0.00% | 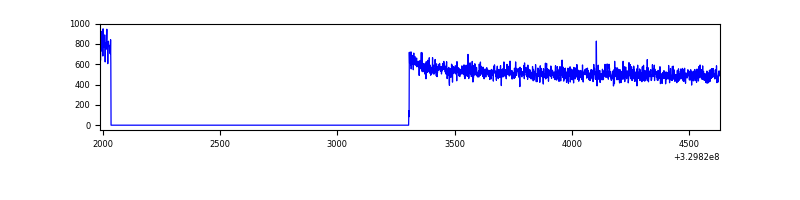 |
| B | 2642 | 1373 | 0 | 0 | 0.00% | 0.00% | 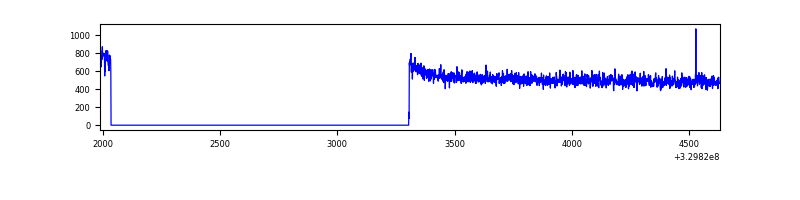 |
| C | 2642 | 1373 | 1 | 1 | 0.04% | 0.07% | 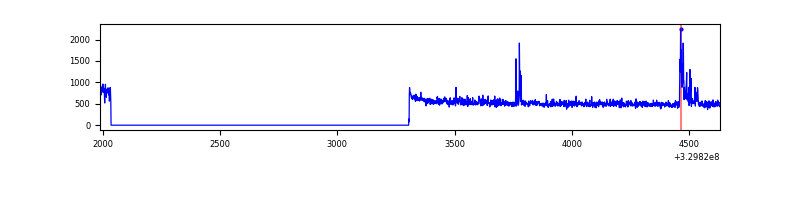 |
| D | 2642 | 1373 | 0 | 0 | 0.00% | 0.00% | 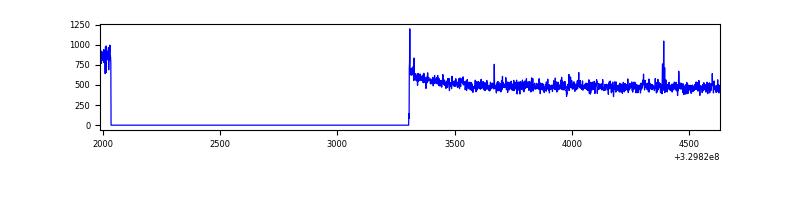 |
Top three noisy pixels from each quadrant. If the there are fewer than three noisy pixels in the level2.evt file, extra rows are filled as -1
| Pixel properties | Quadrant properties | ||||||
|---|---|---|---|---|---|---|---|
| Quadrant | DetID | PixID | Counts | Sigma | Mean | Median | Sigma |
| A | 3 | 137 | 1717 | 39.93 | 186 | 182 | 38.4 |
| A | 13 | 254 | 1676 | 38.86 | 186 | 182 | 38.4 |
| A | 0 | 226 | 1614 | 37.25 | 186 | 182 | 38.4 |
| B | 12 | 111 | 4335 | 116.28 | 182 | 178 | 35.8 |
| B | 11 | 111 | 3767 | 100.39 | 182 | 178 | 35.8 |
| B | 14 | 111 | 3485 | 92.5 | 182 | 178 | 35.8 |
| C | 7 | 87 | 31980 | 777.27 | 172 | 174 | 40.9 |
| C | 14 | 238 | 28691 | 696.9 | 172 | 174 | 40.9 |
| C | 2 | 16 | 14879 | 359.36 | 172 | 174 | 40.9 |
| D | 8 | 195 | 12851 | 289.3 | 177 | 172 | 43.8 |
| D | 1 | 52 | 7174 | 159.77 | 177 | 172 | 43.8 |
| D | 2 | 234 | 4660 | 102.4 | 177 | 172 | 43.8 |
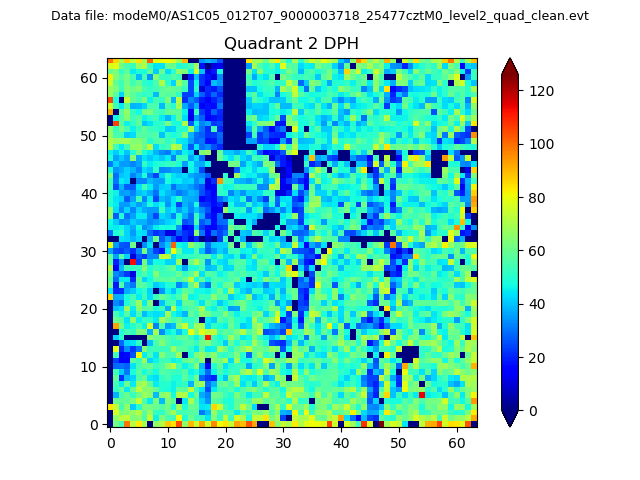
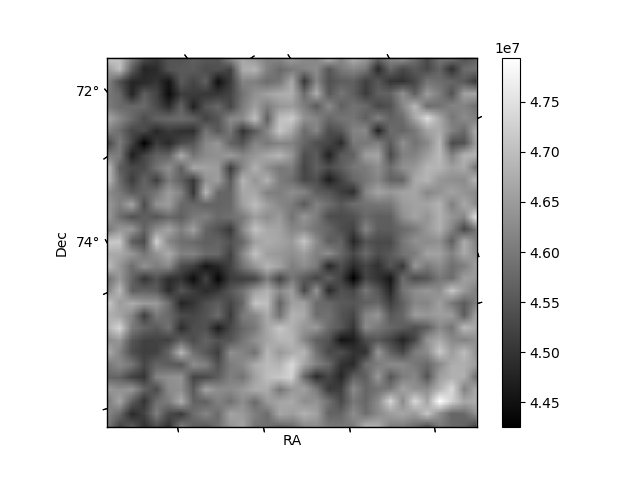
Histogram calculated using DETX and DETY for each event in the final _common_clean file
| Quadrant A | 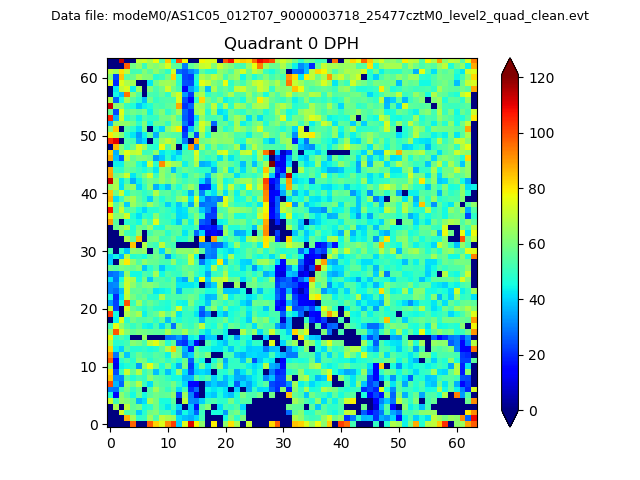 |
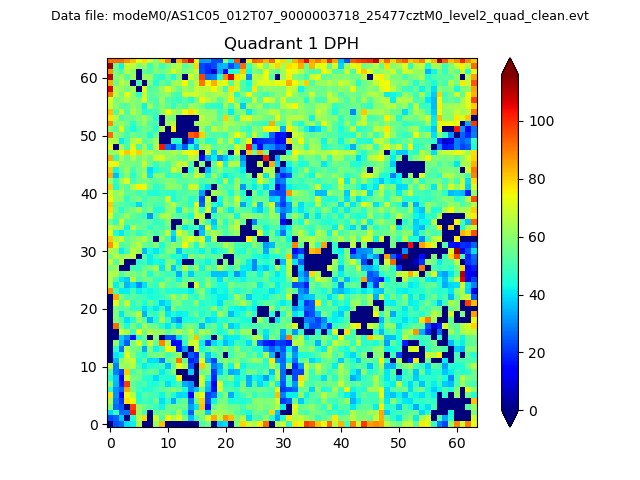 |
Quadrant B |
|---|---|---|---|
| Quadrant D | 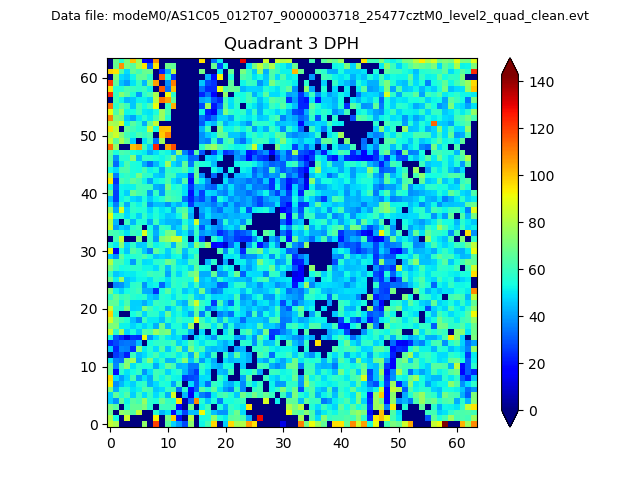 |
 |
Quadrant C |
| Plot type | Count rate plots | Images |
|---|---|---|
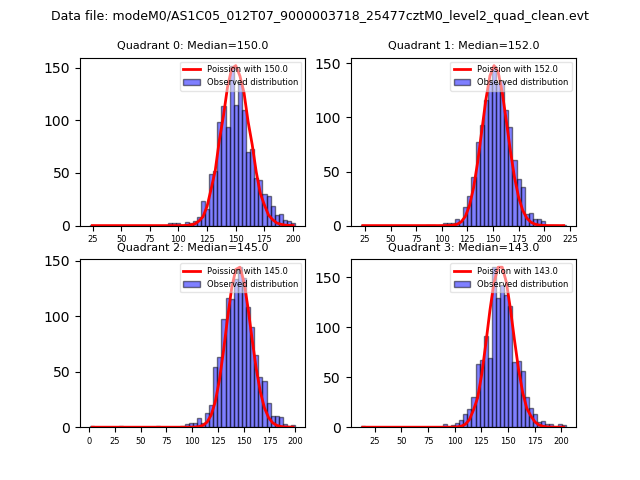
| Comparison with Poisson distribution Blue bars denote a histogram of data divided into 1 sec bins. Red curve is a Poisson curve with rate = median count rate of data. |
 |
 |
| Quadrant-wise count rates Data is divided into 100 sec bins |
 |
|
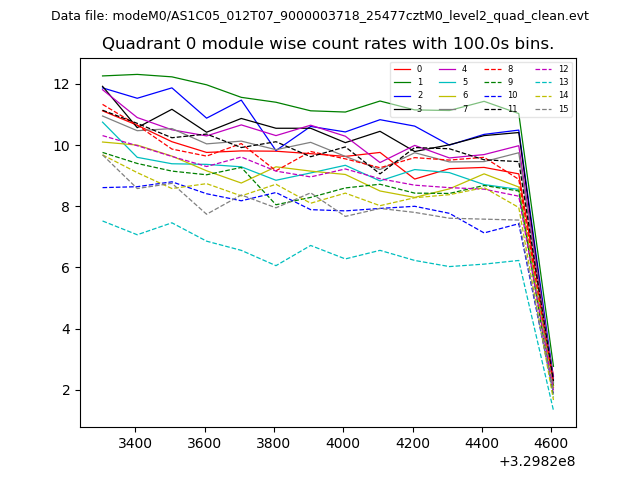
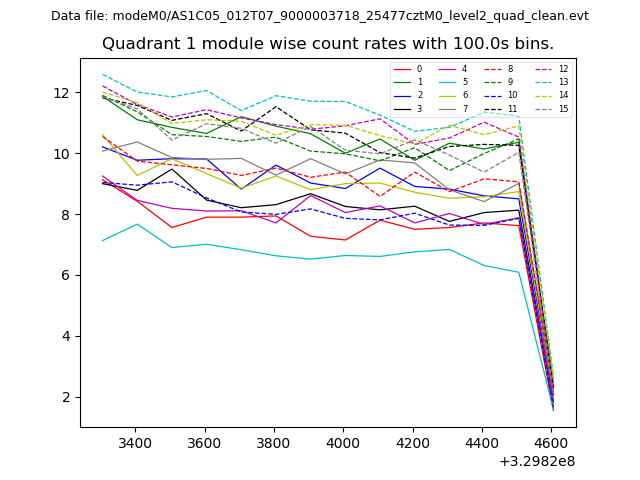
| Module-wise count rates for Quadrant A Data is divided into 100 sec bins |
 |
 |
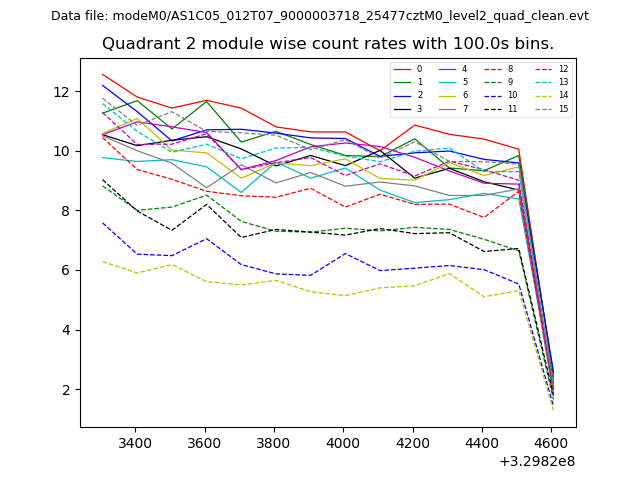
| Module-wise count rates for Quadrant B Data is divided into 100 sec bins |
 |
 |
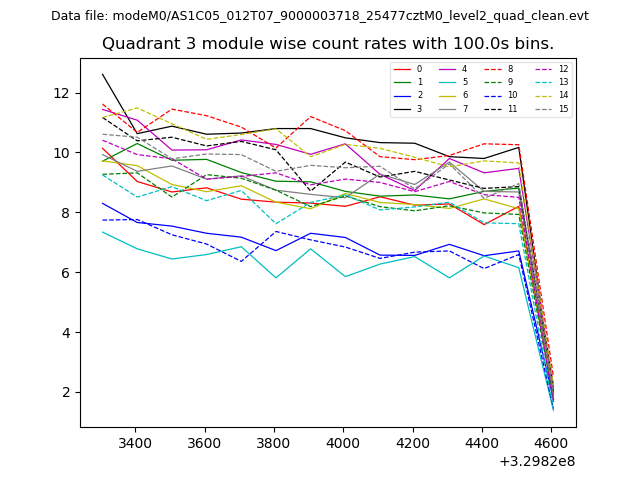
| Module-wise count rates for Quadrant C Data is divided into 100 sec bins |
 |
 |
| Module-wise count rates for Quadrant D Data is divided into 100 sec bins |
 |
 |
| Parameter | Plot |
|---|---|
| CZT HV Monitor | 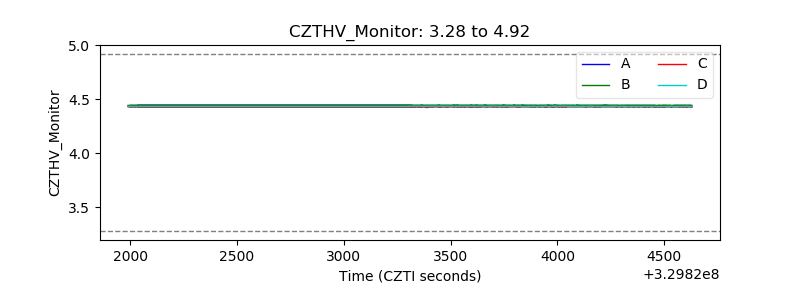 |
| D_VDD | 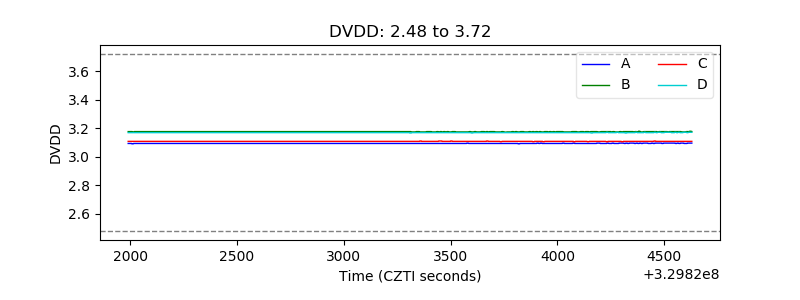 |
| Temperature 1 | 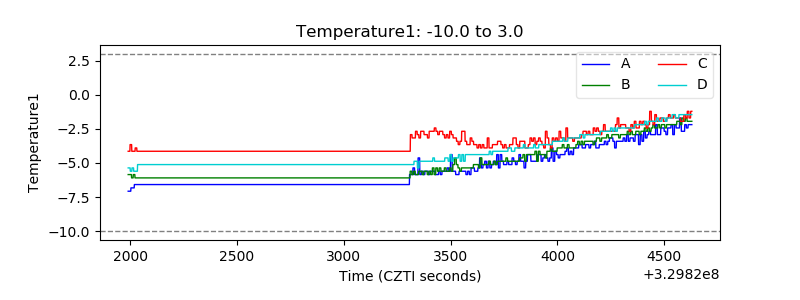 |
| Veto HV Monitor | 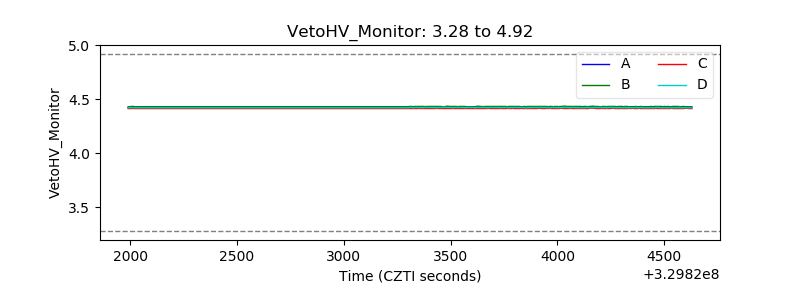 |
| Veto LLD | 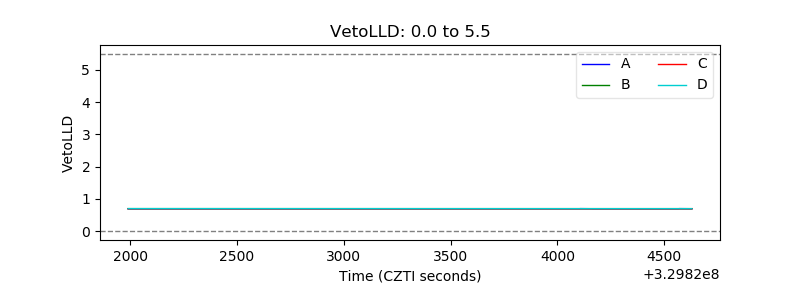 |
| Alpha Counter |  |
| _CPM_Rate | 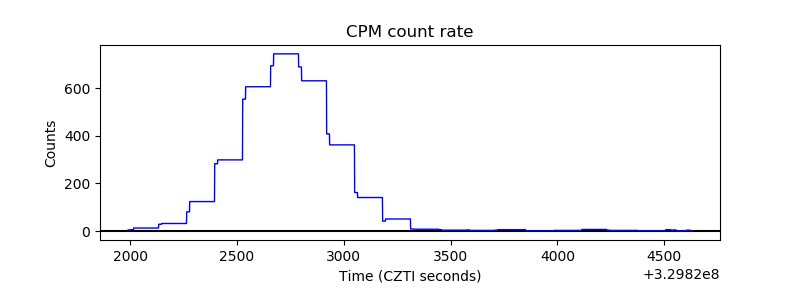 |
| CZT Counter | 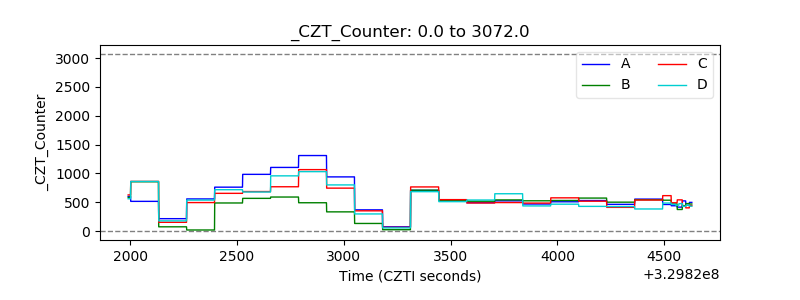 |
| +2.5 Volts monitor |  |
| +5 Volts monitor |  |
| _ROLL_ROT | 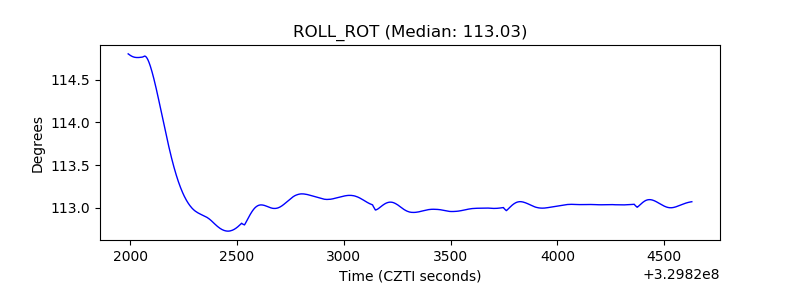 |
| _Roll_DEC | 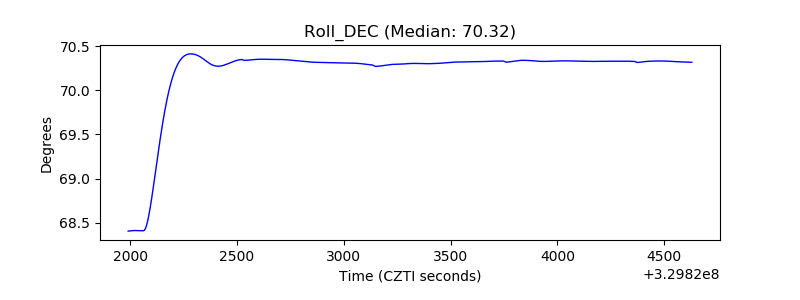 |
| _Roll_RA | 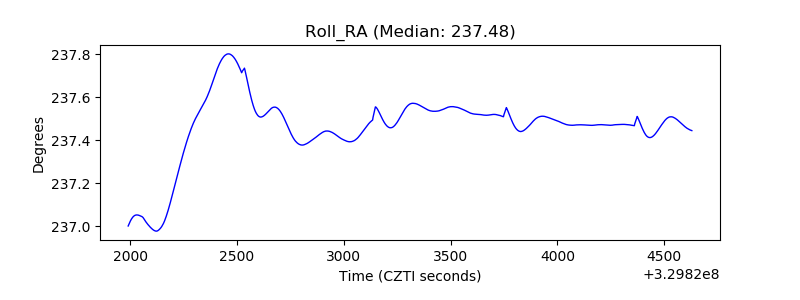 |
| Veto Counter | 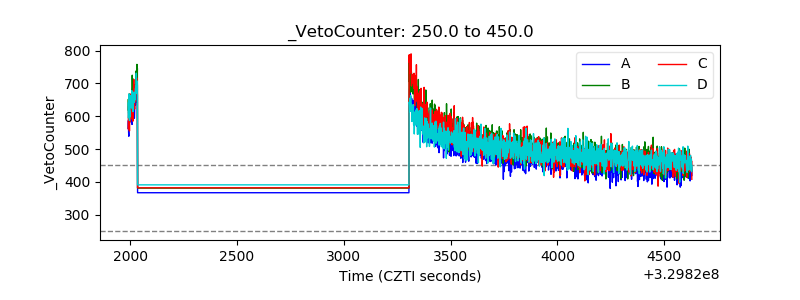 |