| Param | Original file | Final file |
|---|---|---|
| Filename | modeM0/AS1C05_012T07_9000003718_25478cztM0_level2.evt | modeM0/AS1C05_012T07_9000003718_25478cztM0_level2_quad_clean.evt |
| Size (bytes) | 521,642,880 | 139,910,400 |
| Size | 497.5 MB | 133.4 MB |
| Events in quadrant A | 3,322,220 | 966,333 |
| Events in quadrant B | 3,430,962 | 971,523 |
| Events in quadrant C | 3,392,584 | 925,925 |
| Events in quadrant D | 5,184,911 | 894,164 |
| Mode M9 | |||
|---|---|---|---|
| Quadrant | BADHDUFLAG | Total packets | Discarded packets |
| A | 0 | 10 | 0 |
| B | 0 | 10 | 0 |
| C | 0 | 10 | 0 |
| D | 0 | 10 | 0 |
| Mode M0 | |||
|---|---|---|---|
| Quadrant | BADHDUFLAG | Total packets | Discarded packets |
| A | 0 | 14071 | 0 |
| B | 0 | 14334 | 0 |
| C | 0 | 14291 | 0 |
| D | 0 | 19814 | 0 |
| Quadrant | Total seconds | Saturated seconds | Saturation percentage |
|---|---|---|---|
| A | 6890 | 77 | 1.117562% |
| B | 6890 | 99 | 1.436865% |
| C | 6890 | 115 | 1.669086% |
| D | 6891 | 469 | 6.805979% |
Noise dominated data is calculated using 1-second bins in cleaned event files. If a bin has >2000 counts, and if more than 50% of those come from <1% of pixels, then it is considered to be noise-dominated and hence unusable.
| Quadrant | # 1 sec bins | Bins with >0 counts | Bins with >2000 counts | High rate bins dominated by noise | Noise dominated (total time) | Noise dominated (detector-on time) | Marked lightcurve |
|---|---|---|---|---|---|---|---|
| A | 7835 | 6891 | 0 | 0 | 0.00% | 0.00% | 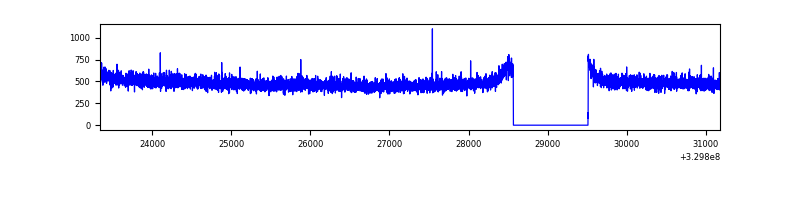 |
| B | 7835 | 6891 | 3 | 3 | 0.04% | 0.04% | 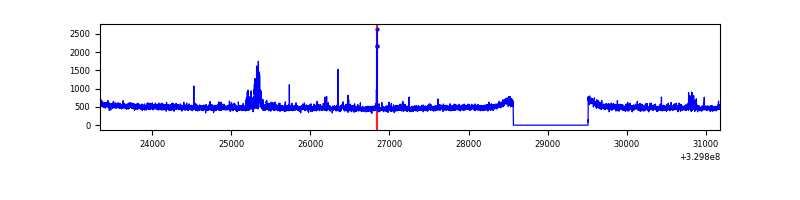 |
| C | 7835 | 6891 | 1 | 1 | 0.01% | 0.01% | 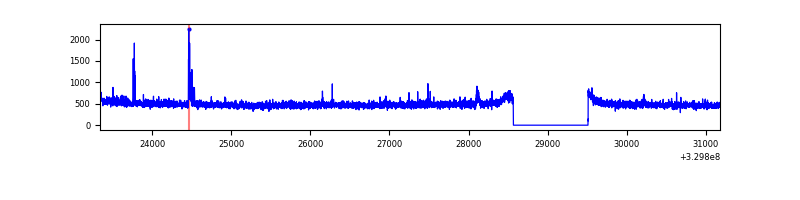 |
| D | 7836 | 6892 | 446 | 446 | 5.69% | 6.47% | 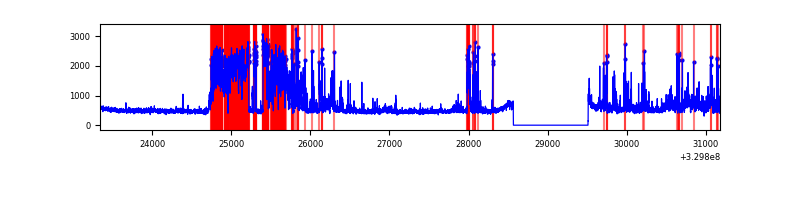 |
Top three noisy pixels from each quadrant. If the there are fewer than three noisy pixels in the level2.evt file, extra rows are filled as -1
| Pixel properties | Quadrant properties | ||||||
|---|---|---|---|---|---|---|---|
| Quadrant | DetID | PixID | Counts | Sigma | Mean | Median | Sigma |
| A | 13 | 254 | 10466 | 56.58 | 861 | 846 | 170.0 |
| A | 3 | 137 | 7581 | 39.61 | 861 | 846 | 170.0 |
| A | 0 | 226 | 7450 | 38.84 | 861 | 846 | 170.0 |
| B | 15 | 33 | 60973 | 385.11 | 846 | 826 | 156.2 |
| B | 0 | 190 | 28398 | 176.54 | 846 | 826 | 156.2 |
| B | 0 | 229 | 22624 | 139.57 | 846 | 826 | 156.2 |
| C | 14 | 238 | 133149 | 699.54 | 818 | 823 | 189.2 |
| C | 7 | 87 | 39664 | 205.33 | 818 | 823 | 189.2 |
| C | 2 | 16 | 31109 | 160.11 | 818 | 823 | 189.2 |
| D | 1 | 52 | 1805974 | 9184.45 | 822 | 795 | 196.5 |
| D | 8 | 195 | 127473 | 644.52 | 822 | 795 | 196.5 |
| D | 2 | 244 | 60503 | 303.78 | 822 | 795 | 196.5 |
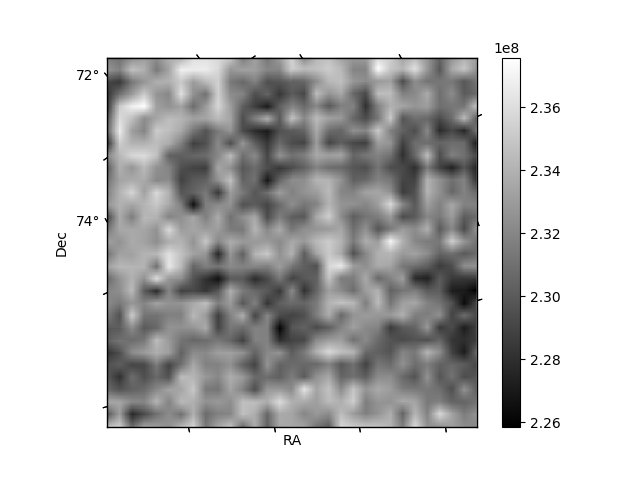
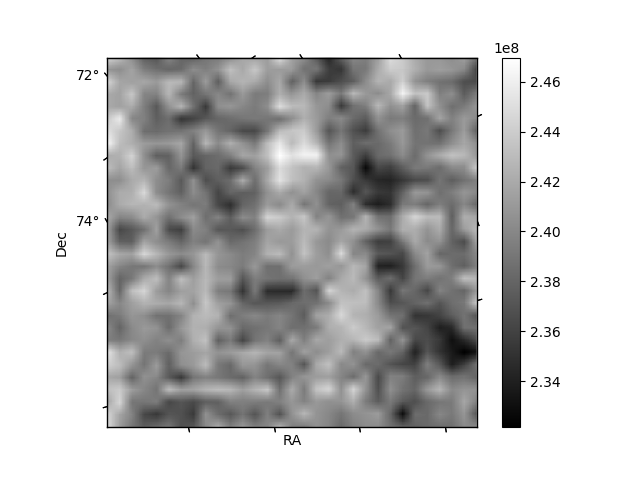
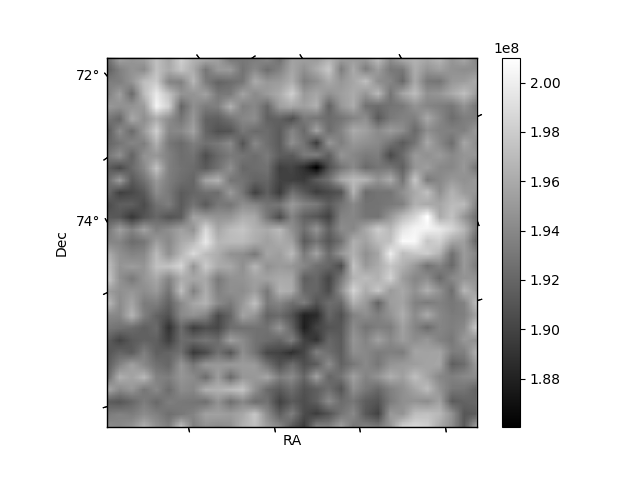
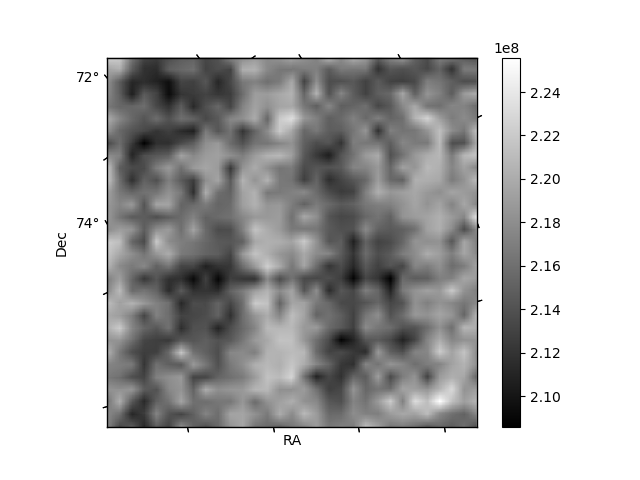
Histogram calculated using DETX and DETY for each event in the final _common_clean file
| Quadrant A | 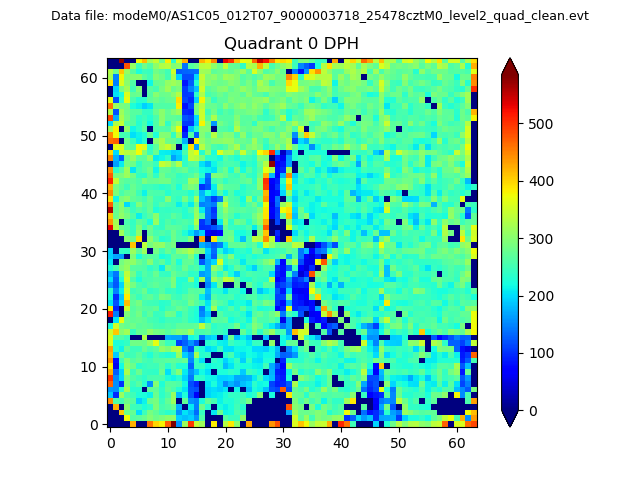 |
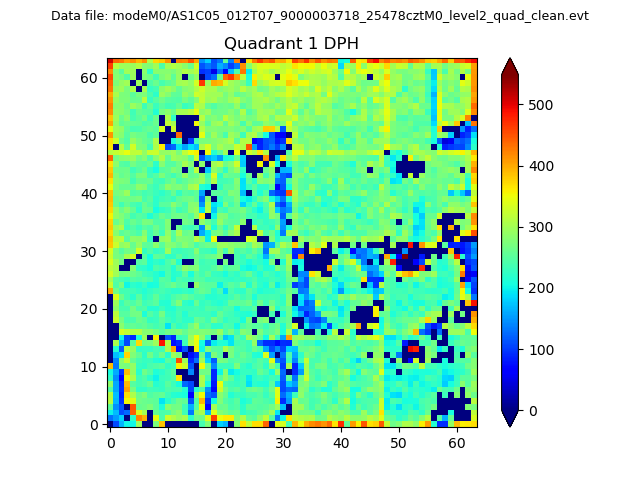 |
Quadrant B |
|---|---|---|---|
| Quadrant D | 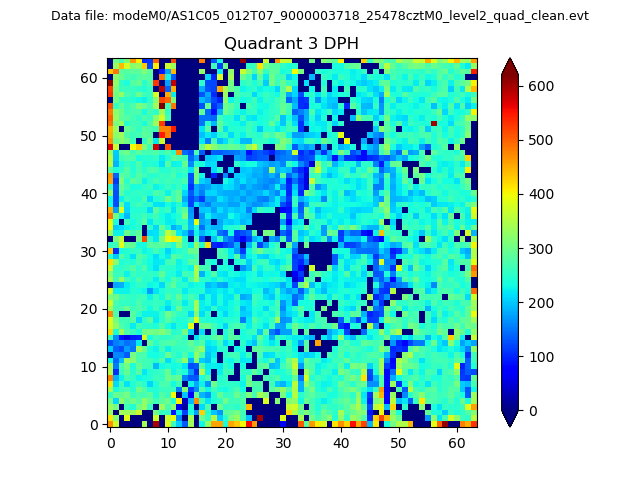 |
 |
Quadrant C |
| Plot type | Count rate plots | Images |
|---|---|---|
| Comparison with Poisson distribution Blue bars denote a histogram of data divided into 1 sec bins. Red curve is a Poisson curve with rate = median count rate of data. |
 |
 |
| Quadrant-wise count rates Data is divided into 100 sec bins |
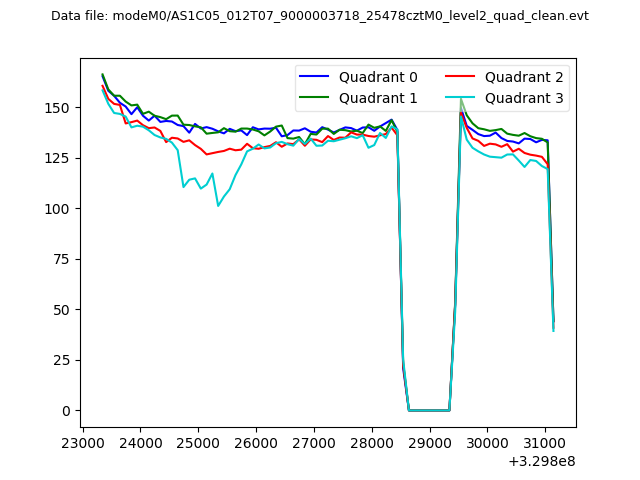 |
|
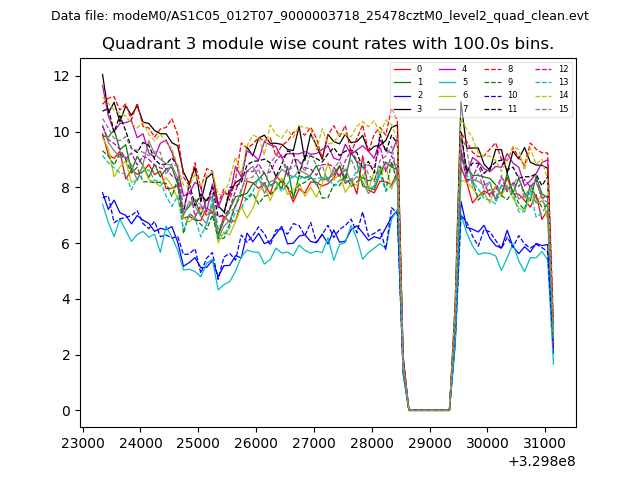
| Module-wise count rates for Quadrant A Data is divided into 100 sec bins |
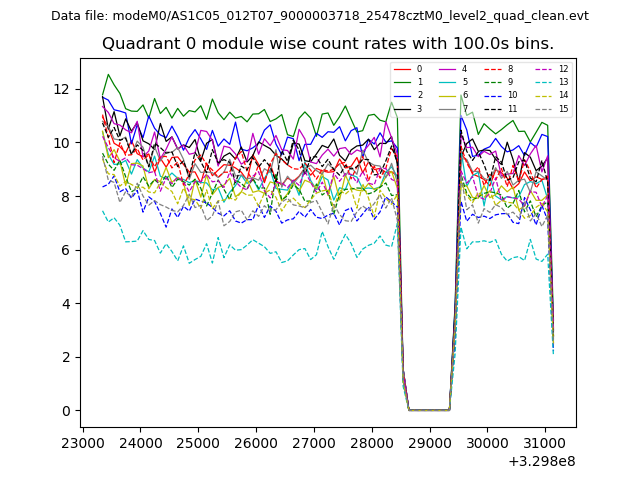 |
 |
| Module-wise count rates for Quadrant B Data is divided into 100 sec bins |
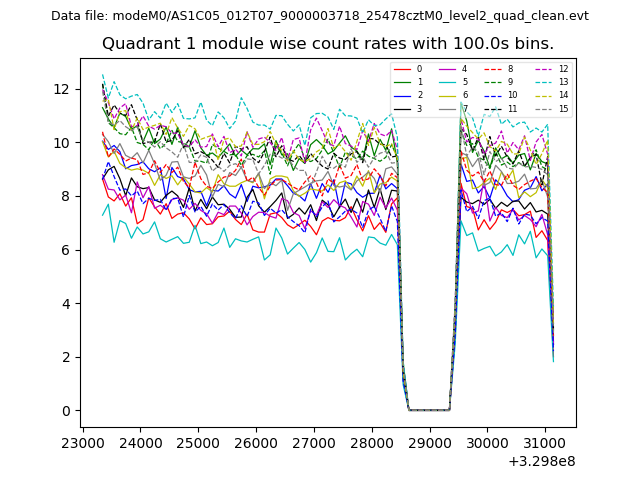 |
 |
| Module-wise count rates for Quadrant C Data is divided into 100 sec bins |
 |
 |
| Module-wise count rates for Quadrant D Data is divided into 100 sec bins |
 |
 |
| Parameter | Plot |
|---|---|
| CZT HV Monitor |  |
| D_VDD | 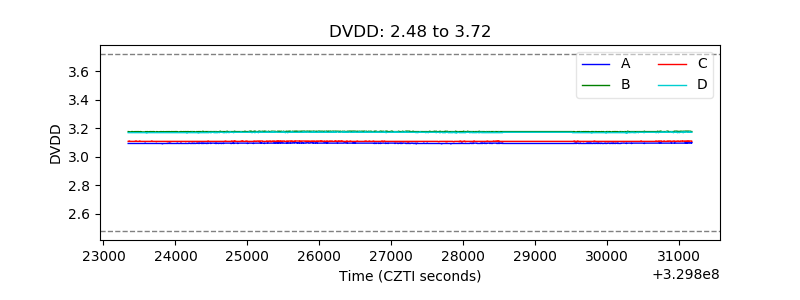 |
| Temperature 1 | 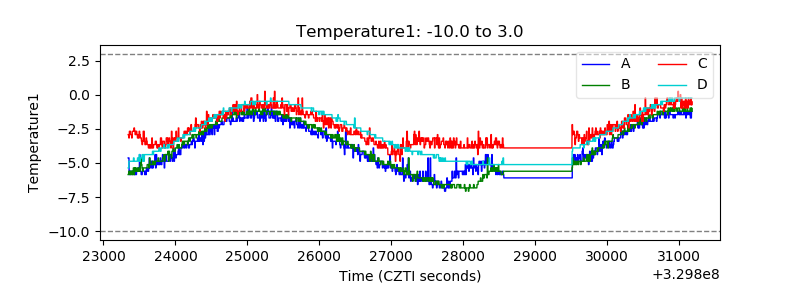 |
| Veto HV Monitor | 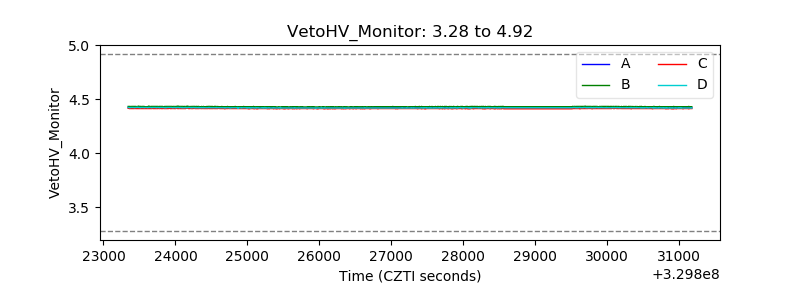 |
| Veto LLD | 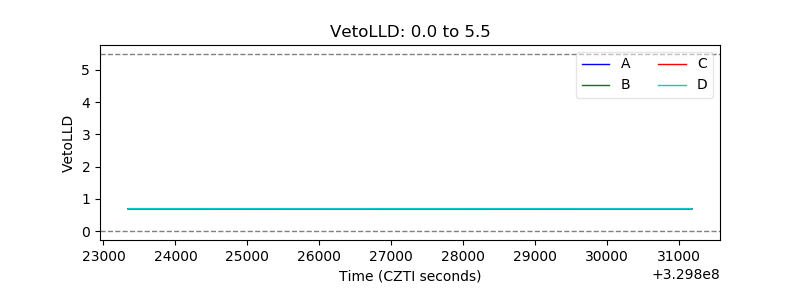 |
| Alpha Counter | 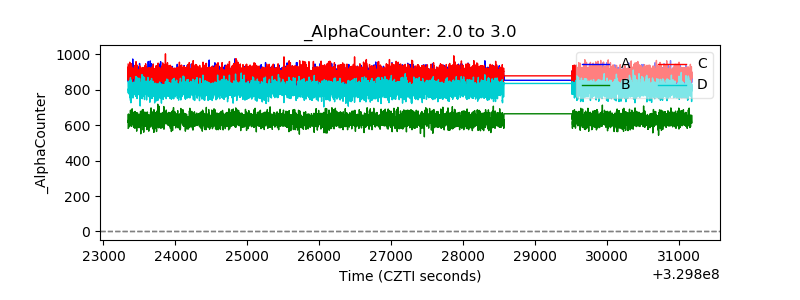 |
| _CPM_Rate | 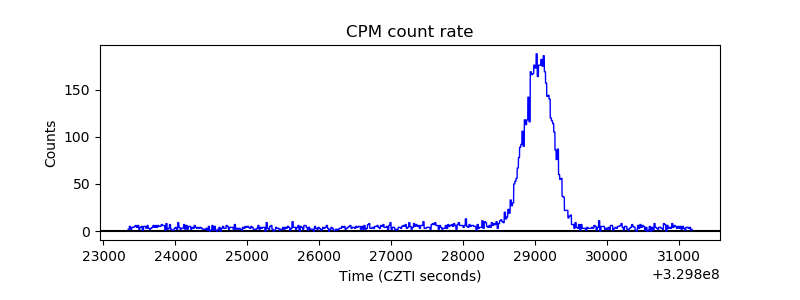 |
| CZT Counter | 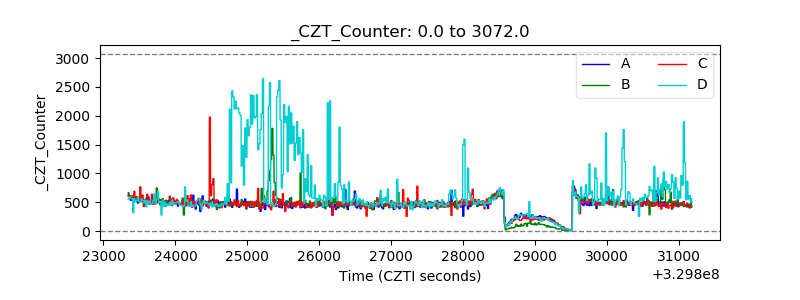 |
| +2.5 Volts monitor |  |
| +5 Volts monitor | 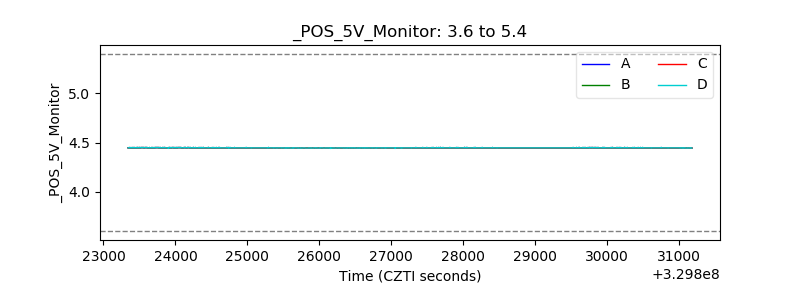 |
| _ROLL_ROT | 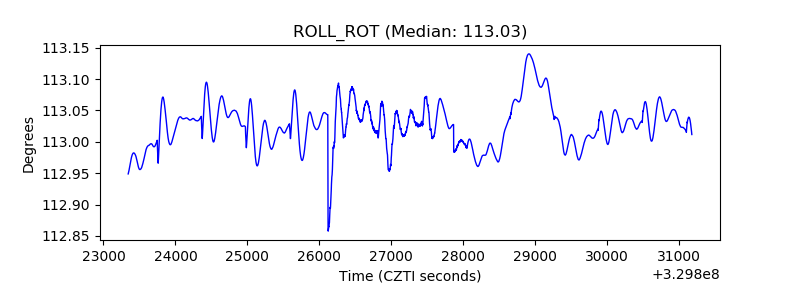 |
| _Roll_DEC | 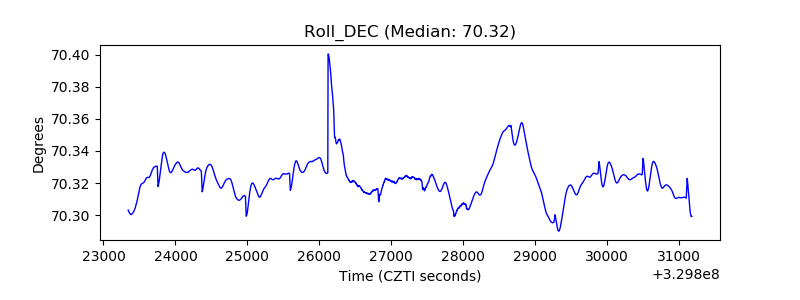 |
| _Roll_RA | 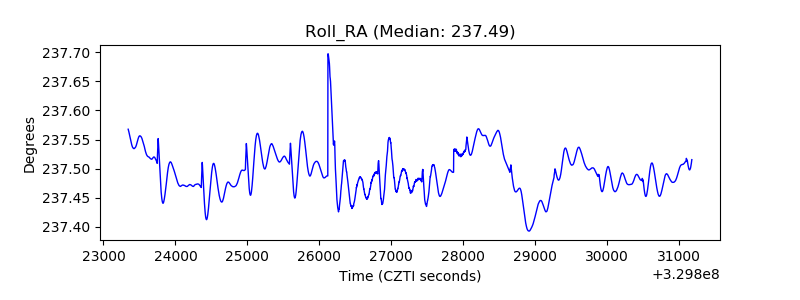 |
| Veto Counter | 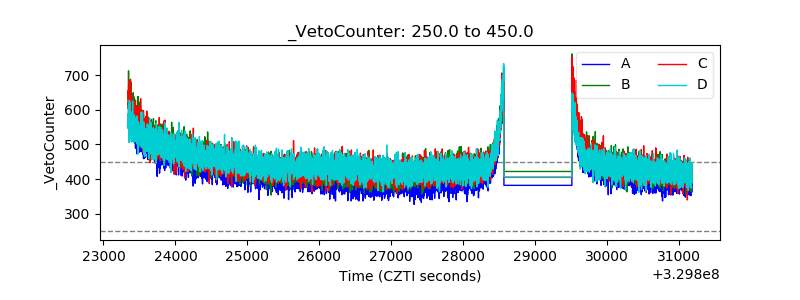 |