| Param | Original file | Final file |
|---|---|---|
| Filename | modeM0/AS1C05_012T07_9000003718_25479cztM0_level2.evt | modeM0/AS1C05_012T07_9000003718_25479cztM0_level2_quad_clean.evt |
| Size (bytes) | 493,007,040 | 134,596,800 |
| Size | 470.2 MB | 128.4 MB |
| Events in quadrant A | 3,241,699 | 921,668 |
| Events in quadrant B | 3,390,224 | 925,248 |
| Events in quadrant C | 3,284,646 | 885,532 |
| Events in quadrant D | 4,543,249 | 861,301 |
| Mode M9 | |||
|---|---|---|---|
| Quadrant | BADHDUFLAG | Total packets | Discarded packets |
| A | 0 | 5 | 0 |
| B | 0 | 5 | 0 |
| C | 0 | 5 | 0 |
| D | 0 | 5 | 0 |
| Mode M0 | |||
|---|---|---|---|
| Quadrant | BADHDUFLAG | Total packets | Discarded packets |
| A | 0 | 14125 | 0 |
| B | 0 | 14474 | 0 |
| C | 0 | 14171 | 0 |
| D | 0 | 18052 | 0 |
| Quadrant | Total seconds | Saturated seconds | Saturation percentage |
|---|---|---|---|
| A | 6928 | 86 | 1.241339% |
| B | 6928 | 87 | 1.255774% |
| C | 6928 | 125 | 1.804273% |
| D | 6928 | 215 | 3.103349% |
Noise dominated data is calculated using 1-second bins in cleaned event files. If a bin has >2000 counts, and if more than 50% of those come from <1% of pixels, then it is considered to be noise-dominated and hence unusable.
| Quadrant | # 1 sec bins | Bins with >0 counts | Bins with >2000 counts | High rate bins dominated by noise | Noise dominated (total time) | Noise dominated (detector-on time) | Marked lightcurve |
|---|---|---|---|---|---|---|---|
| A | 7448 | 6929 | 0 | 0 | 0.00% | 0.00% | 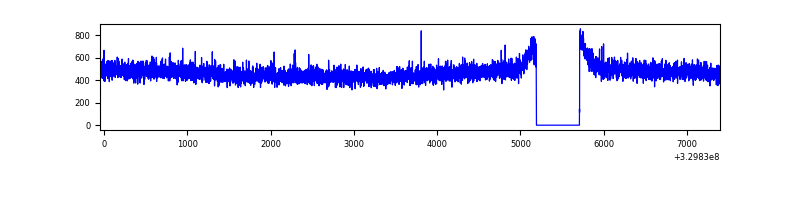 |
| B | 7448 | 6929 | 5 | 5 | 0.07% | 0.07% | 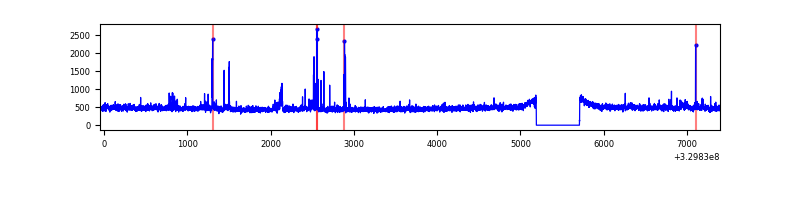 |
| C | 7448 | 6929 | 0 | 0 | 0.00% | 0.00% | 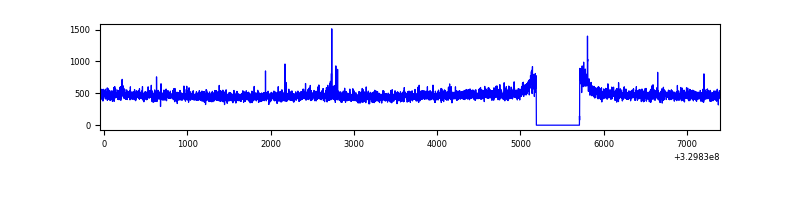 |
| D | 7448 | 6929 | 135 | 135 | 1.81% | 1.95% | 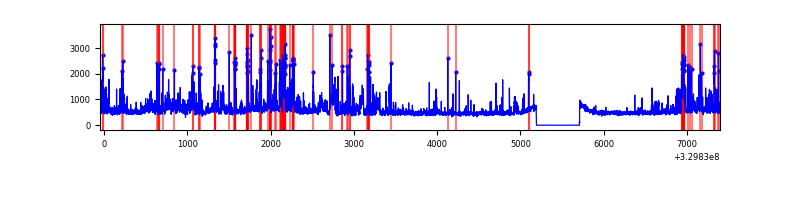 |
Top three noisy pixels from each quadrant. If the there are fewer than three noisy pixels in the level2.evt file, extra rows are filled as -1
| Pixel properties | Quadrant properties | ||||||
|---|---|---|---|---|---|---|---|
| Quadrant | DetID | PixID | Counts | Sigma | Mean | Median | Sigma |
| A | 13 | 254 | 11341 | 62.48 | 839 | 822 | 168.3 |
| A | 3 | 137 | 7573 | 40.1 | 839 | 822 | 168.3 |
| A | 0 | 226 | 7260 | 38.24 | 839 | 822 | 168.3 |
| B | 0 | 229 | 96613 | 622.35 | 825 | 806 | 153.9 |
| B | 0 | 190 | 38323 | 243.71 | 825 | 806 | 153.9 |
| B | 12 | 111 | 18716 | 116.34 | 825 | 806 | 153.9 |
| C | 14 | 238 | 129940 | 696.09 | 799 | 805 | 185.5 |
| C | 7 | 87 | 20851 | 108.06 | 799 | 805 | 185.5 |
| C | 2 | 16 | 11491 | 57.6 | 799 | 805 | 185.5 |
| D | 1 | 52 | 790811 | 4095.36 | 805 | 781 | 192.9 |
| D | 7 | 38 | 210837 | 1088.89 | 805 | 781 | 192.9 |
| D | 8 | 195 | 153336 | 790.82 | 805 | 781 | 192.9 |
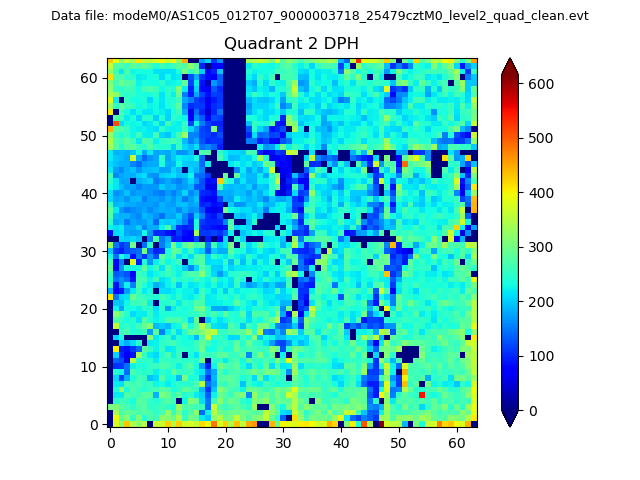
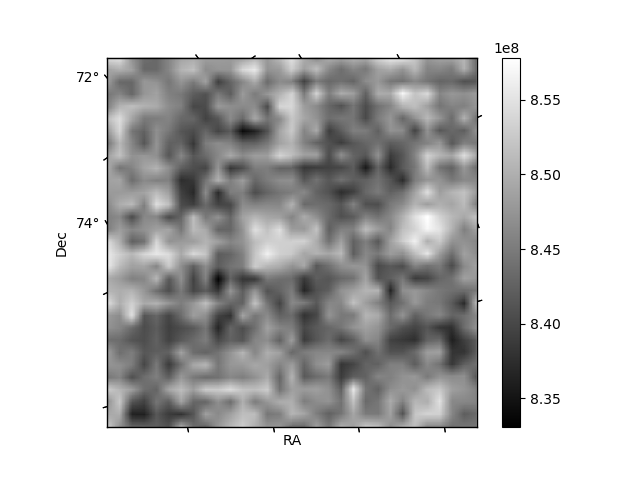
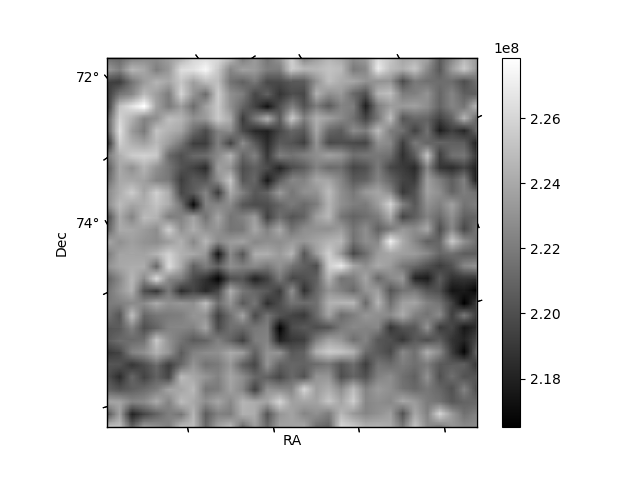
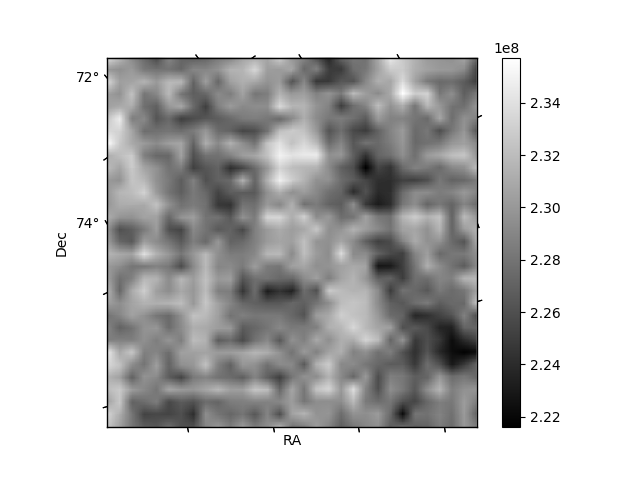
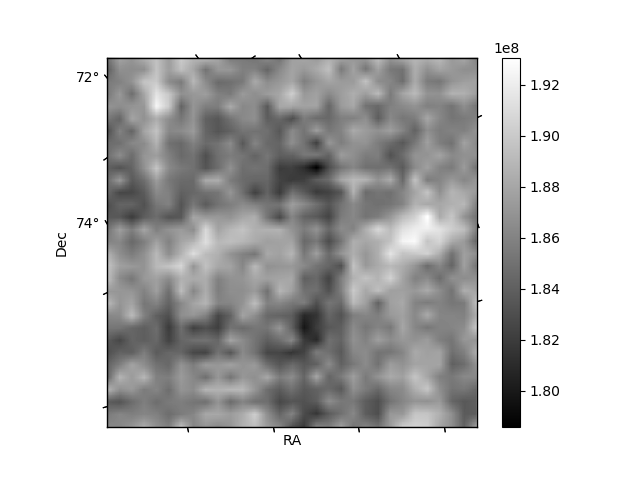
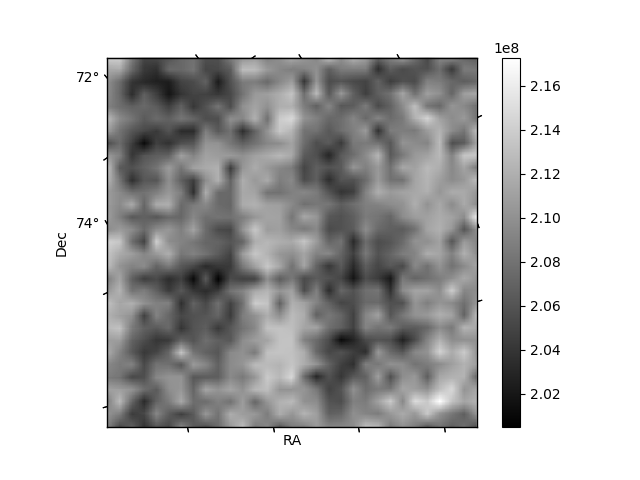
Histogram calculated using DETX and DETY for each event in the final _common_clean file
| Quadrant A | 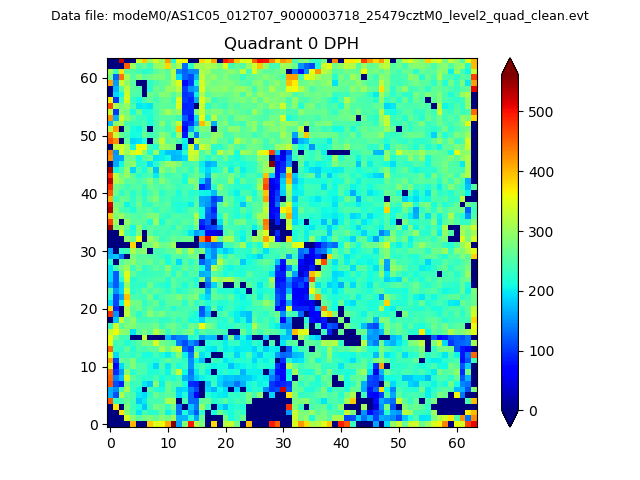 |
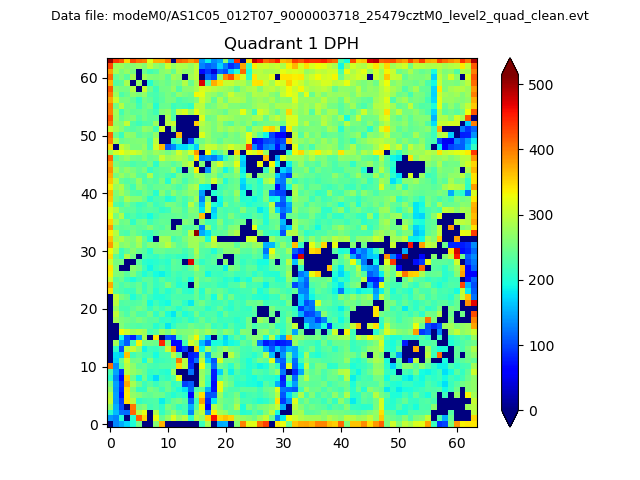 |
Quadrant B |
|---|---|---|---|
| Quadrant D | 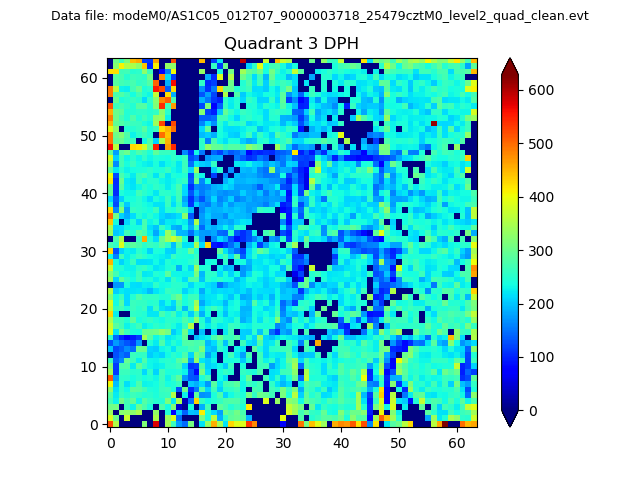 |
 |
Quadrant C |
| Plot type | Count rate plots | Images |
|---|---|---|
| Comparison with Poisson distribution Blue bars denote a histogram of data divided into 1 sec bins. Red curve is a Poisson curve with rate = median count rate of data. |
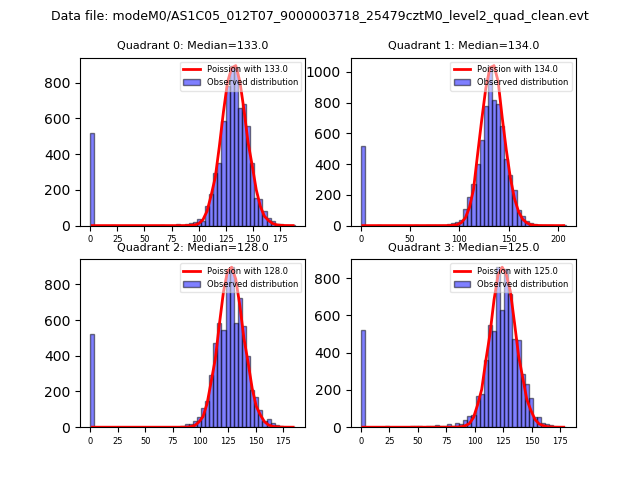 |
 |
| Quadrant-wise count rates Data is divided into 100 sec bins |
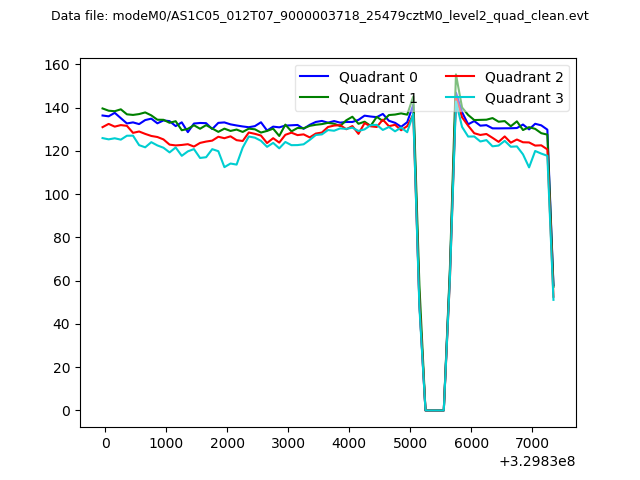 |
|
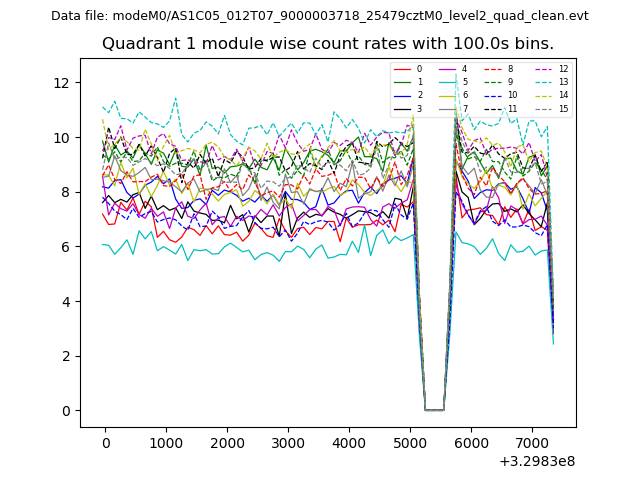
| Module-wise count rates for Quadrant A Data is divided into 100 sec bins |
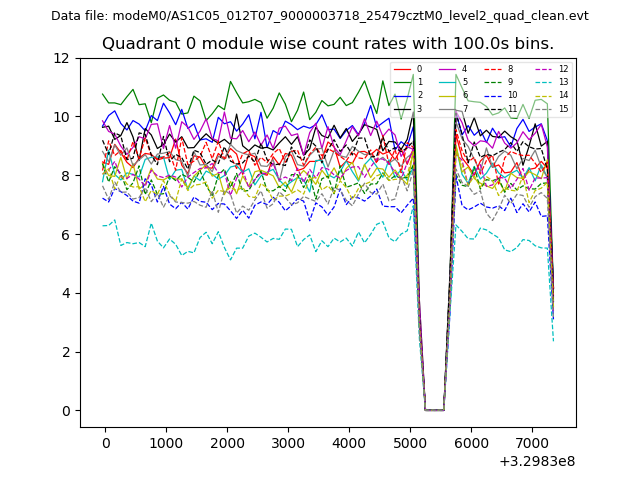 |
 |
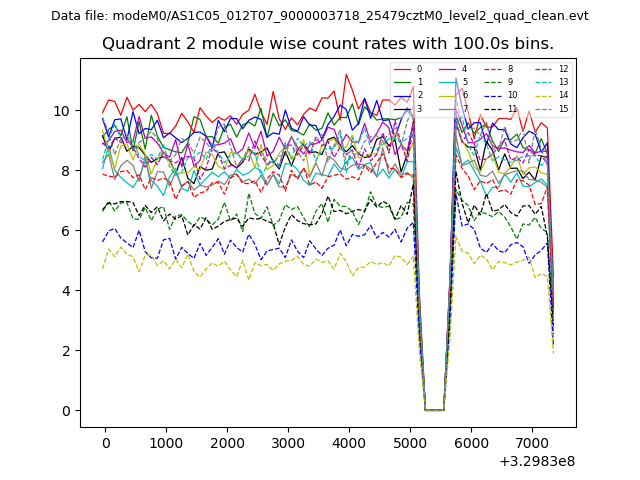
| Module-wise count rates for Quadrant B Data is divided into 100 sec bins |
 |
 |
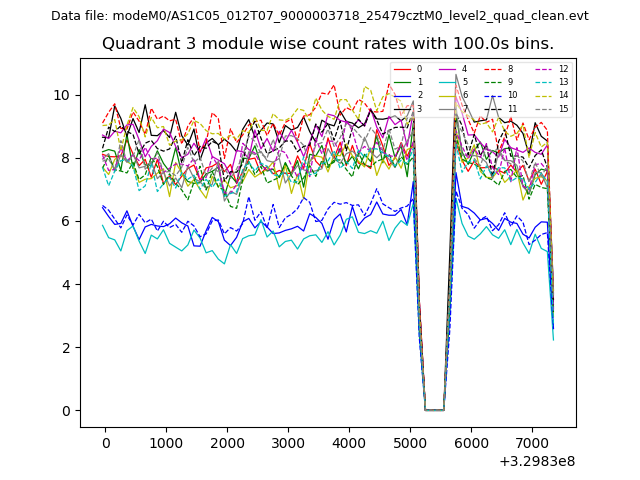
| Module-wise count rates for Quadrant C Data is divided into 100 sec bins |
 |
 |
| Module-wise count rates for Quadrant D Data is divided into 100 sec bins |
 |
 |
| Parameter | Plot |
|---|---|
| CZT HV Monitor | 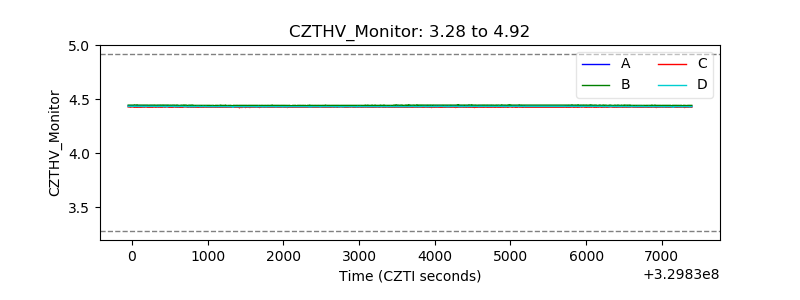 |
| D_VDD | 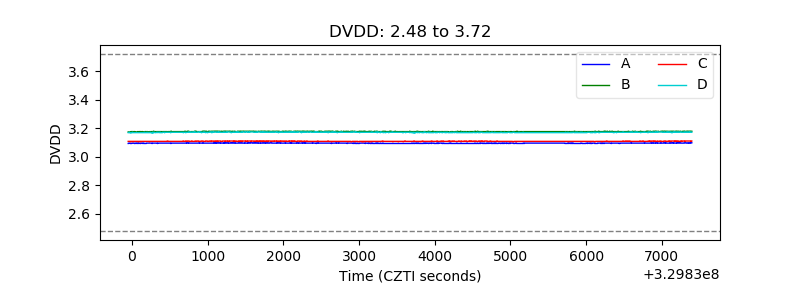 |
| Temperature 1 | 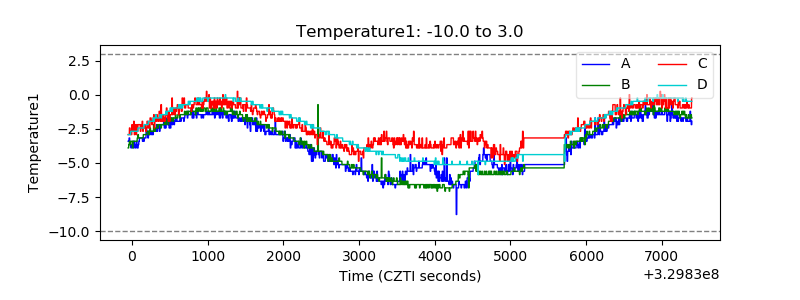 |
| Veto HV Monitor | 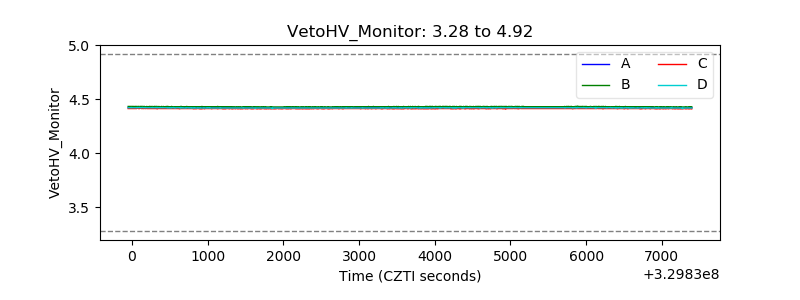 |
| Veto LLD | 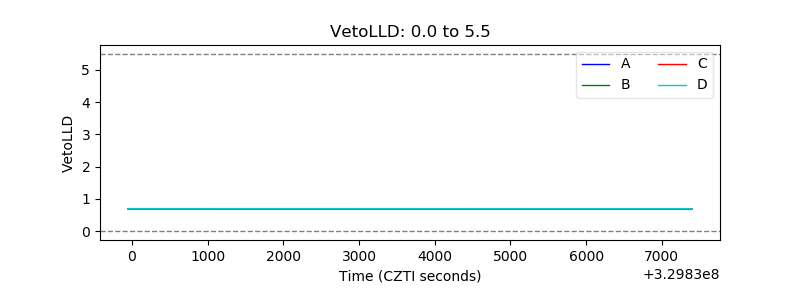 |
| Alpha Counter | 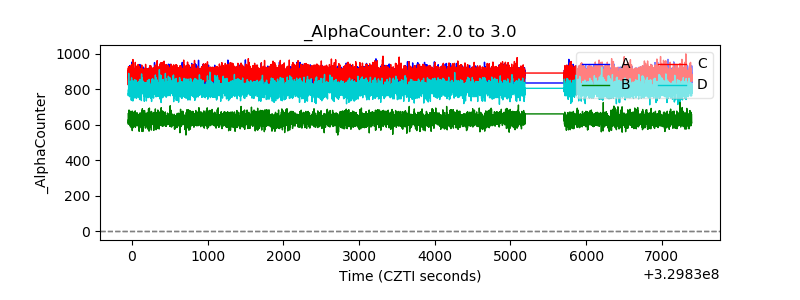 |
| _CPM_Rate | 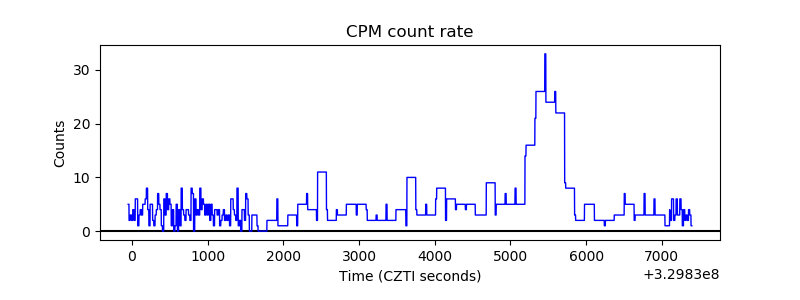 |
| CZT Counter | 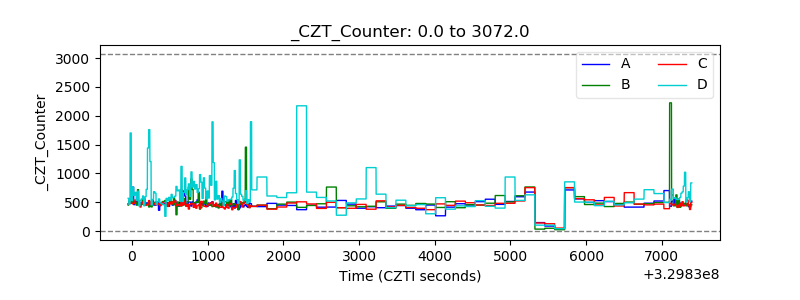 |
| +2.5 Volts monitor |  |
| +5 Volts monitor |  |
| _ROLL_ROT | 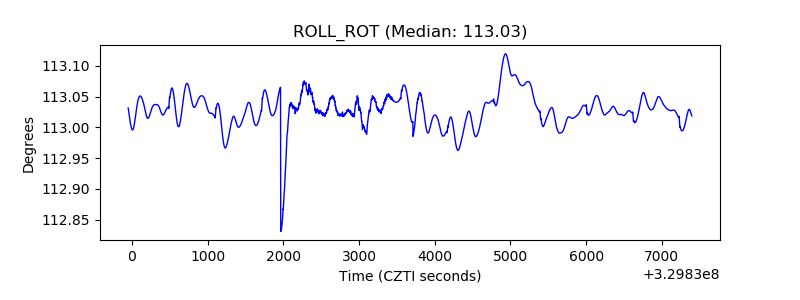 |
| _Roll_DEC | 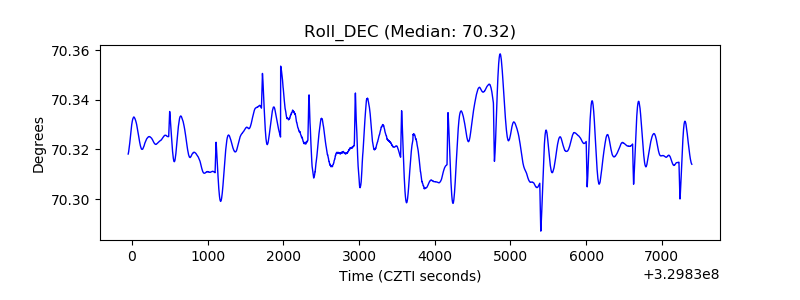 |
| _Roll_RA | 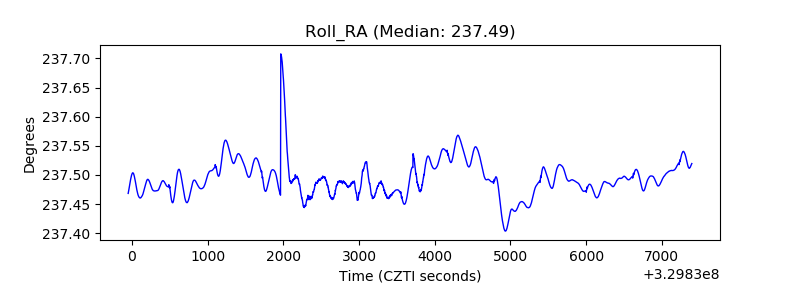 |
| Veto Counter | 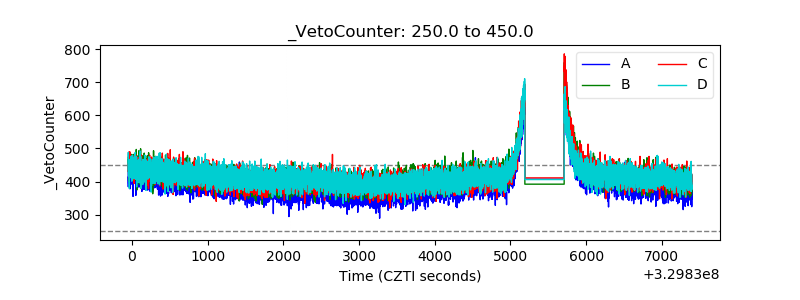 |