| Param | Original file | Final file |
|---|---|---|
| Filename | modeM0/AS1C05_012T07_9000003718_25480cztM0_level2.evt | modeM0/AS1C05_012T07_9000003718_25480cztM0_level2_quad_clean.evt |
| Size (bytes) | 483,719,040 | 127,722,240 |
| Size | 461.3 MB | 121.8 MB |
| Events in quadrant A | 3,141,196 | 871,297 |
| Events in quadrant B | 3,357,753 | 874,743 |
| Events in quadrant C | 3,149,533 | 839,030 |
| Events in quadrant D | 4,545,111 | 815,487 |
| Mode M9 | |||
|---|---|---|---|
| Quadrant | BADHDUFLAG | Total packets | Discarded packets |
| A | 0 | 3 | 0 |
| B | 0 | 3 | 0 |
| C | 0 | 3 | 0 |
| D | 0 | 3 | 0 |
| Mode M0 | |||
|---|---|---|---|
| Quadrant | BADHDUFLAG | Total packets | Discarded packets |
| A | 0 | 13722 | 0 |
| B | 0 | 14237 | 0 |
| C | 0 | 13717 | 0 |
| D | 0 | 17938 | 0 |
| Quadrant | Total seconds | Saturated seconds | Saturation percentage |
|---|---|---|---|
| A | 6710 | 63 | 0.938897% |
| B | 6711 | 83 | 1.236775% |
| C | 6711 | 128 | 1.907316% |
| D | 6711 | 327 | 4.872597% |
Noise dominated data is calculated using 1-second bins in cleaned event files. If a bin has >2000 counts, and if more than 50% of those come from <1% of pixels, then it is considered to be noise-dominated and hence unusable.
| Quadrant | # 1 sec bins | Bins with >0 counts | Bins with >2000 counts | High rate bins dominated by noise | Noise dominated (total time) | Noise dominated (detector-on time) | Marked lightcurve |
|---|---|---|---|---|---|---|---|
| A | 7000 | 6712 | 0 | 0 | 0.00% | 0.00% |  |
| B | 7001 | 6713 | 8 | 8 | 0.11% | 0.12% |  |
| C | 7001 | 6713 | 0 | 0 | 0.00% | 0.00% |  |
| D | 7001 | 6713 | 160 | 160 | 2.29% | 2.38% |  |
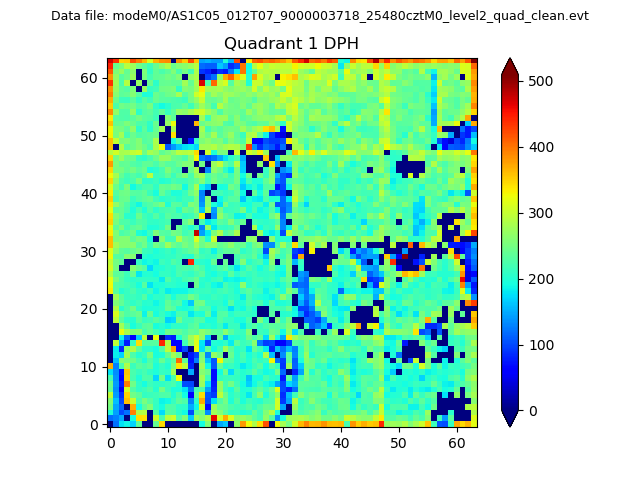
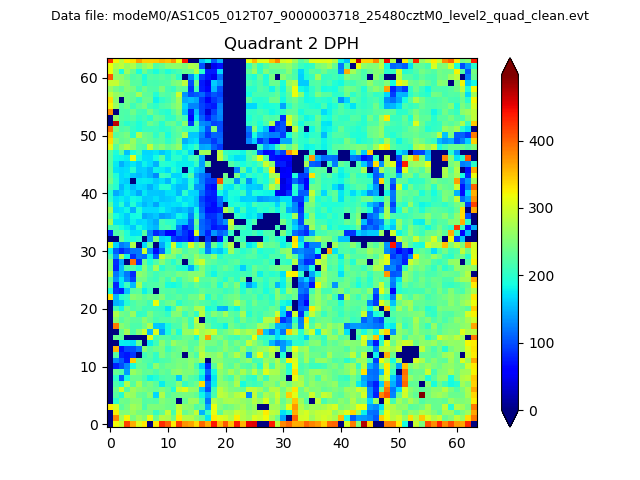
Top three noisy pixels from each quadrant. If the there are fewer than three noisy pixels in the level2.evt file, extra rows are filled as -1
| Pixel properties | Quadrant properties | ||||||
|---|---|---|---|---|---|---|---|
| Quadrant | DetID | PixID | Counts | Sigma | Mean | Median | Sigma |
| A | 3 | 1 | 22427 | 134.33 | 807 | 789 | 161.1 |
| A | 13 | 254 | 11657 | 67.47 | 807 | 789 | 161.1 |
| A | 3 | 137 | 7325 | 40.57 | 807 | 789 | 161.1 |
| B | 5 | 235 | 115442 | 761.87 | 796 | 776 | 150.5 |
| B | 0 | 229 | 57159 | 374.62 | 796 | 776 | 150.5 |
| B | 0 | 190 | 32757 | 212.49 | 796 | 776 | 150.5 |
| C | 14 | 238 | 123085 | 679.51 | 774 | 777 | 180.0 |
| C | 3 | 233 | 10116 | 51.88 | 774 | 777 | 180.0 |
| C | 13 | 61 | 5457 | 26.0 | 774 | 777 | 180.0 |
| D | 1 | 52 | 890813 | 4741.62 | 776 | 753 | 187.7 |
| D | 8 | 195 | 301838 | 1603.97 | 776 | 753 | 187.7 |
| D | 2 | 244 | 106700 | 564.41 | 776 | 753 | 187.7 |
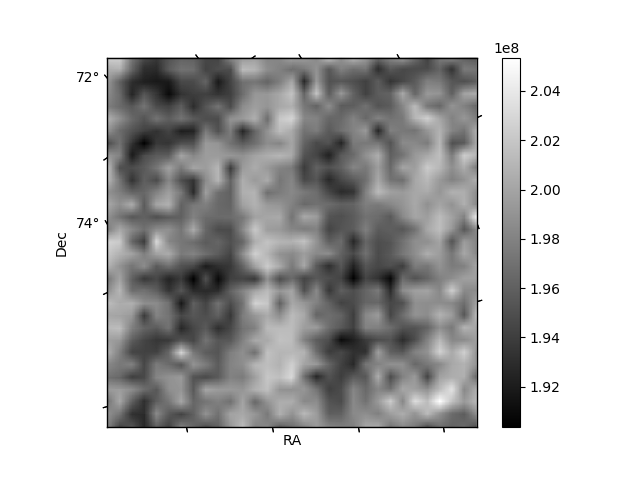
Histogram calculated using DETX and DETY for each event in the final _common_clean file
| Quadrant A | 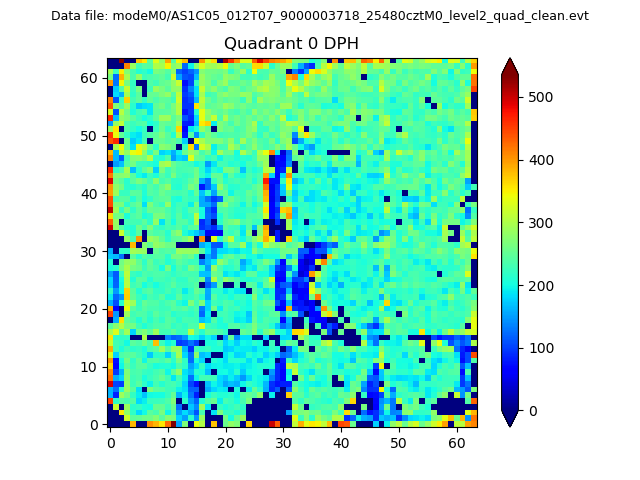 |
 |
Quadrant B |
|---|---|---|---|
| Quadrant D |  |
 |
Quadrant C |
| Plot type | Count rate plots | Images |
|---|---|---|
| Comparison with Poisson distribution Blue bars denote a histogram of data divided into 1 sec bins. Red curve is a Poisson curve with rate = median count rate of data. |
 |
 |
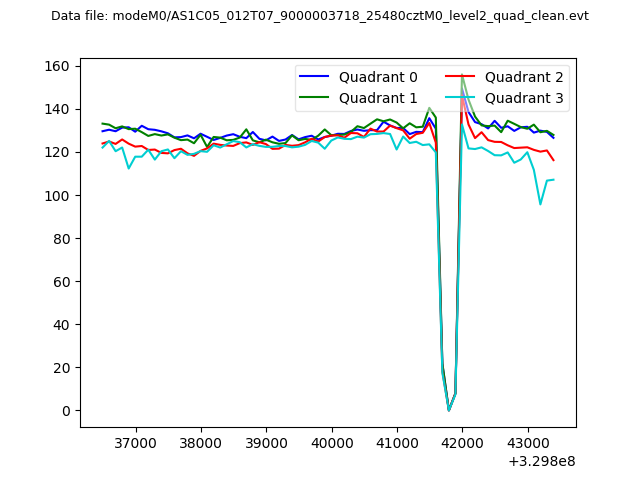
| Quadrant-wise count rates Data is divided into 100 sec bins |
 |
|
| Module-wise count rates for Quadrant A Data is divided into 100 sec bins |
 |
 |
| Module-wise count rates for Quadrant B Data is divided into 100 sec bins |
 |
 |
| Module-wise count rates for Quadrant C Data is divided into 100 sec bins |
 |
 |
| Module-wise count rates for Quadrant D Data is divided into 100 sec bins |
 |
 |
| Parameter | Plot |
|---|---|
| CZT HV Monitor |  |
| D_VDD | 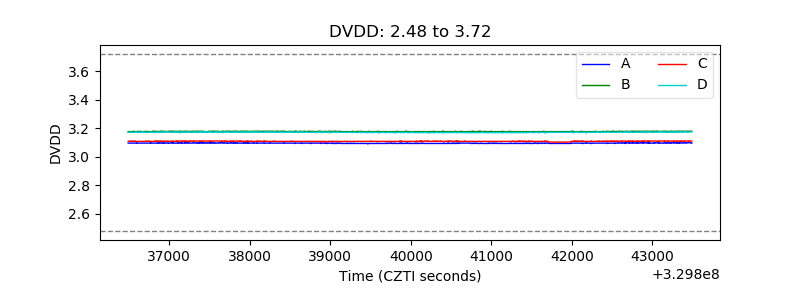 |
| Temperature 1 | 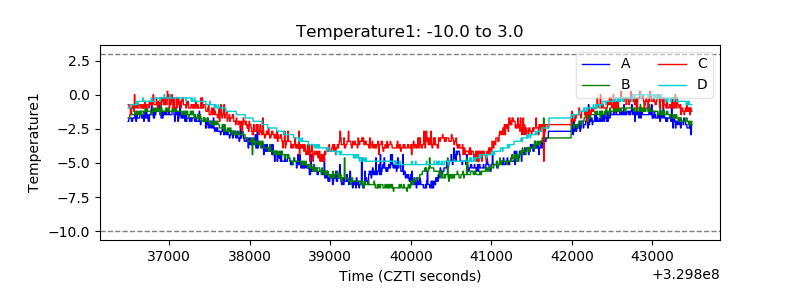 |
| Veto HV Monitor | 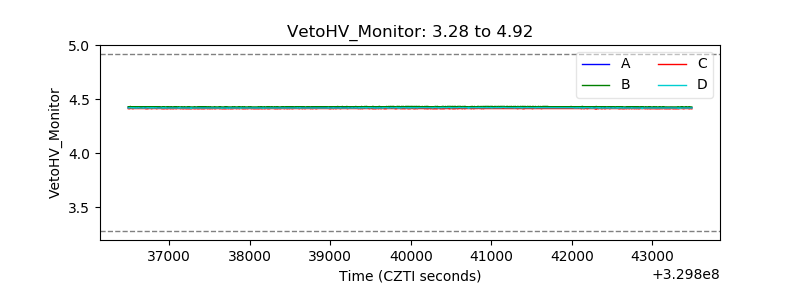 |
| Veto LLD | 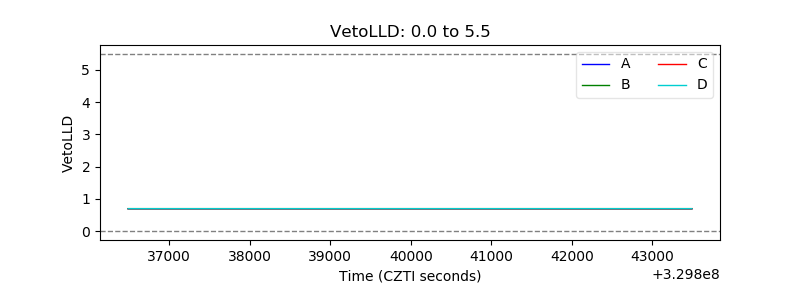 |
| Alpha Counter | 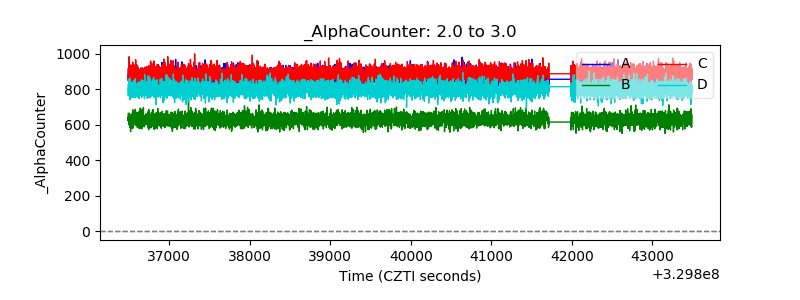 |
| _CPM_Rate | 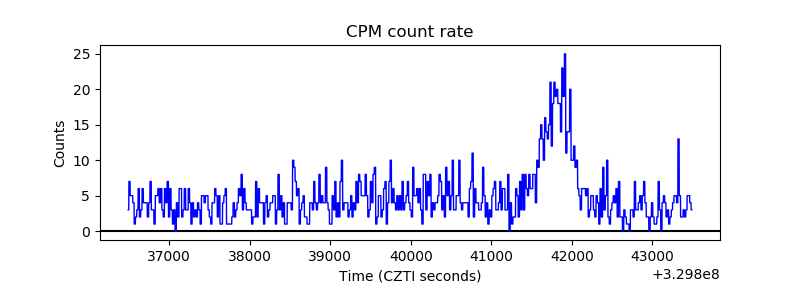 |
| CZT Counter | 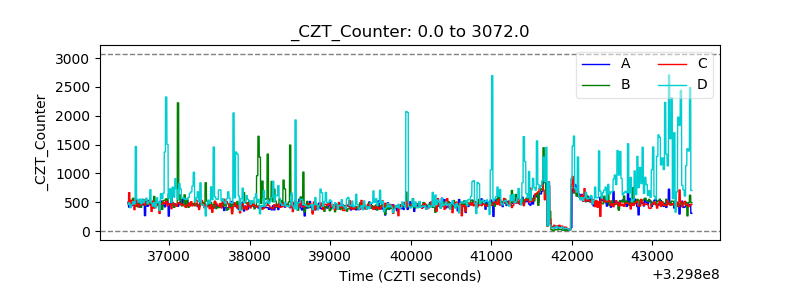 |
| +2.5 Volts monitor |  |
| +5 Volts monitor |  |
| _ROLL_ROT |  |
| _Roll_DEC |  |
| _Roll_RA | 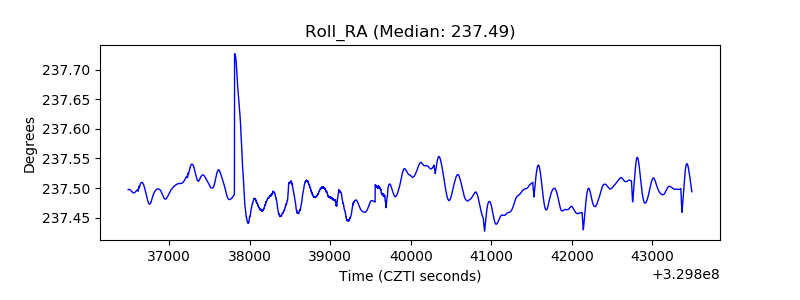 |
| Veto Counter |  |