| Param | Original file | Final file |
|---|---|---|
| Filename | modeM0/AS1C05_012T07_9000003718_25481cztM0_level2.evt | modeM0/AS1C05_012T07_9000003718_25481cztM0_level2_quad_clean.evt |
| Size (bytes) | 556,727,040 | 135,420,480 |
| Size | 530.9 MB | 129.1 MB |
| Events in quadrant A | 3,354,753 | 930,264 |
| Events in quadrant B | 3,447,614 | 934,061 |
| Events in quadrant C | 3,377,791 | 893,889 |
| Events in quadrant D | 6,189,909 | 839,867 |
| Mode M9 | |||
|---|---|---|---|
| Quadrant | BADHDUFLAG | Total packets | Discarded packets |
| A | 0 | 4 | 0 |
| B | 0 | 4 | 0 |
| C | 0 | 4 | 0 |
| D | 0 | 4 | 0 |
| Mode M0 | |||
|---|---|---|---|
| Quadrant | BADHDUFLAG | Total packets | Discarded packets |
| A | 0 | 14730 | 0 |
| B | 0 | 14857 | 0 |
| C | 0 | 14721 | 0 |
| D | 0 | 23395 | 0 |
| Quadrant | Total seconds | Saturated seconds | Saturation percentage |
|---|---|---|---|
| A | 7233 | 39 | 0.539195% |
| B | 7233 | 58 | 0.801880% |
| C | 7233 | 95 | 1.313425% |
| D | 7233 | 597 | 8.253837% |
Noise dominated data is calculated using 1-second bins in cleaned event files. If a bin has >2000 counts, and if more than 50% of those come from <1% of pixels, then it is considered to be noise-dominated and hence unusable.
| Quadrant | # 1 sec bins | Bins with >0 counts | Bins with >2000 counts | High rate bins dominated by noise | Noise dominated (total time) | Noise dominated (detector-on time) | Marked lightcurve |
|---|---|---|---|---|---|---|---|
| A | 7603 | 7234 | 0 | 0 | 0.00% | 0.00% | 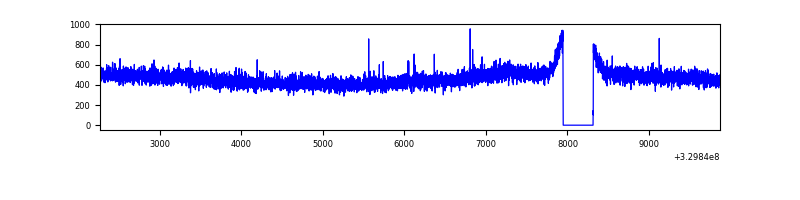 |
| B | 7603 | 7234 | 1 | 1 | 0.01% | 0.01% | 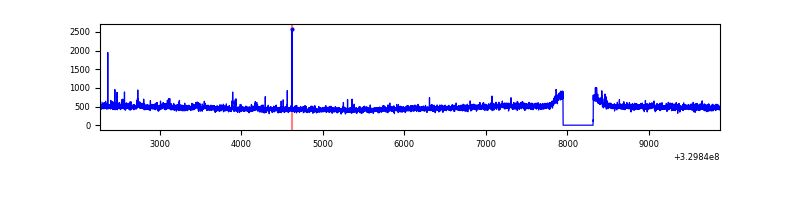 |
| C | 7603 | 7234 | 0 | 0 | 0.00% | 0.00% | 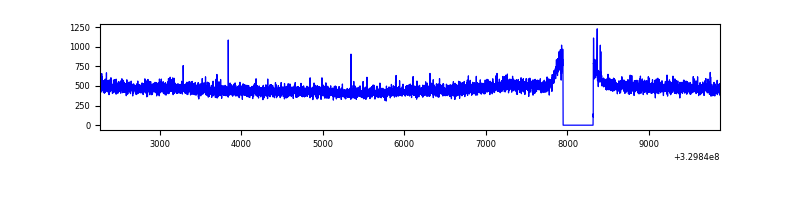 |
| D | 7603 | 7234 | 397 | 397 | 5.22% | 5.49% | 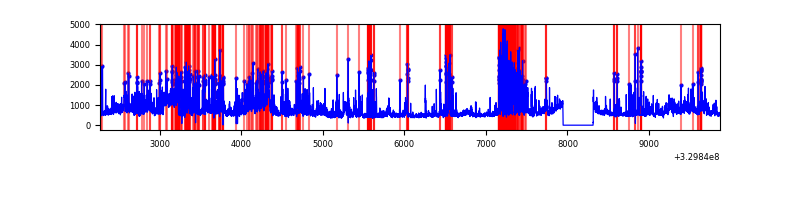 |
Top three noisy pixels from each quadrant. If the there are fewer than three noisy pixels in the level2.evt file, extra rows are filled as -1
| Pixel properties | Quadrant properties | ||||||
|---|---|---|---|---|---|---|---|
| Quadrant | DetID | PixID | Counts | Sigma | Mean | Median | Sigma |
| A | 13 | 254 | 11717 | 62.58 | 865 | 845 | 173.7 |
| A | 3 | 1 | 7835 | 40.23 | 865 | 845 | 173.7 |
| A | 3 | 137 | 7761 | 39.81 | 865 | 845 | 173.7 |
| B | 0 | 229 | 50322 | 304.47 | 856 | 832 | 162.5 |
| B | 0 | 190 | 30935 | 185.2 | 856 | 832 | 162.5 |
| B | 12 | 111 | 19293 | 113.58 | 856 | 832 | 162.5 |
| C | 14 | 238 | 131759 | 676.82 | 830 | 834 | 193.4 |
| C | 3 | 233 | 9688 | 45.77 | 830 | 834 | 193.4 |
| C | 13 | 61 | 5921 | 26.3 | 830 | 834 | 193.4 |
| D | 1 | 52 | 2069706 | 10477.68 | 811 | 787 | 197.5 |
| D | 8 | 195 | 709682 | 3590.08 | 811 | 787 | 197.5 |
| D | 2 | 244 | 108364 | 544.81 | 811 | 787 | 197.5 |
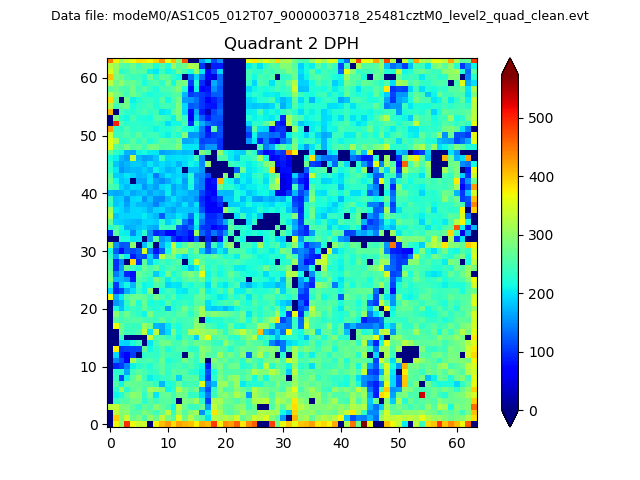
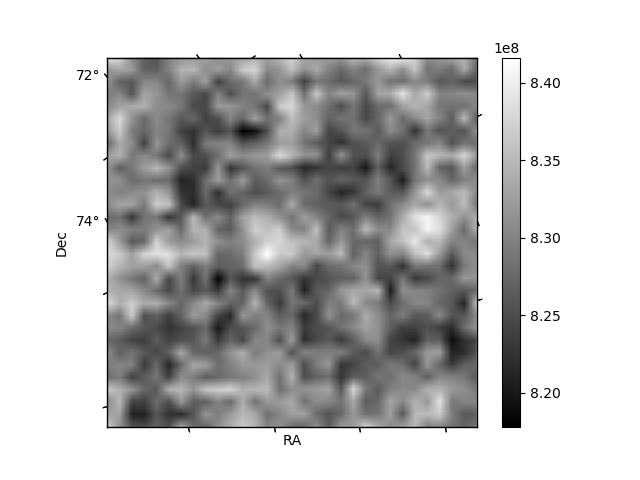
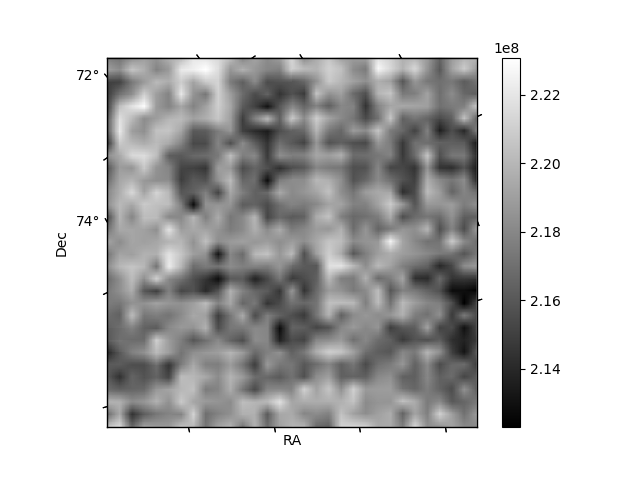
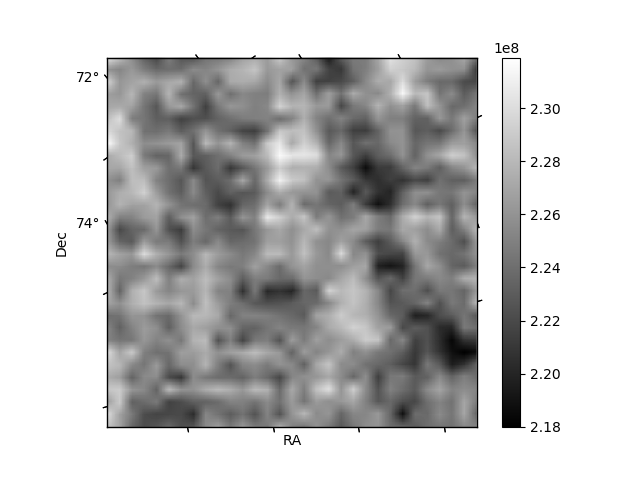
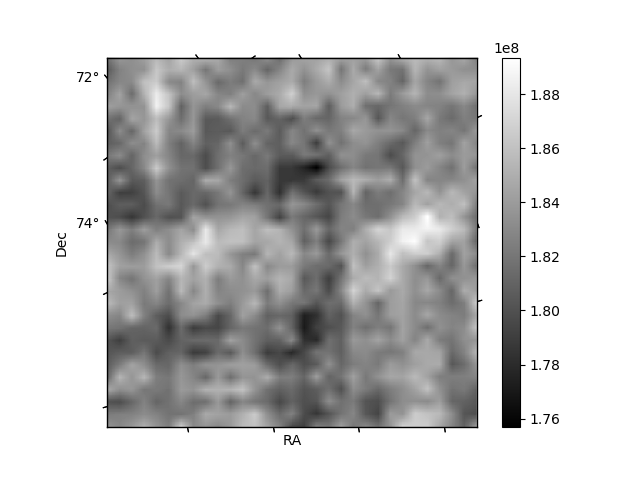
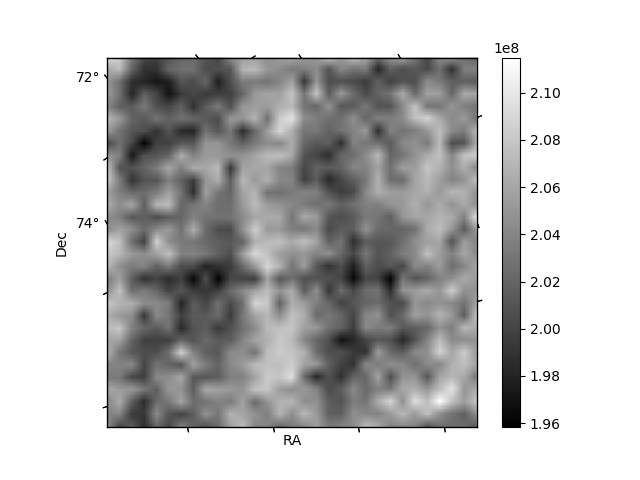
Histogram calculated using DETX and DETY for each event in the final _common_clean file
| Quadrant A | 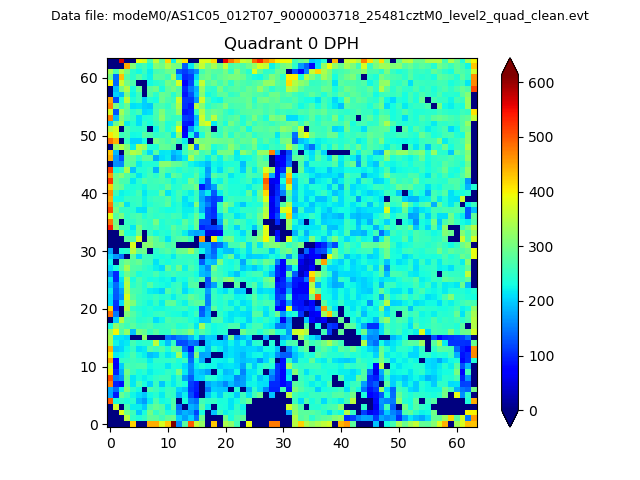 |
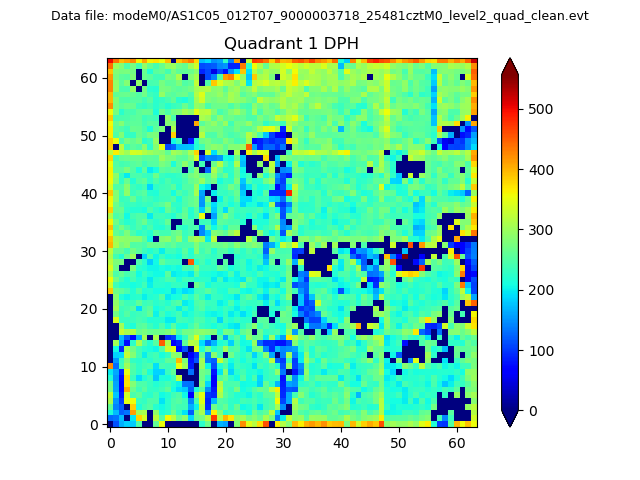 |
Quadrant B |
|---|---|---|---|
| Quadrant D | 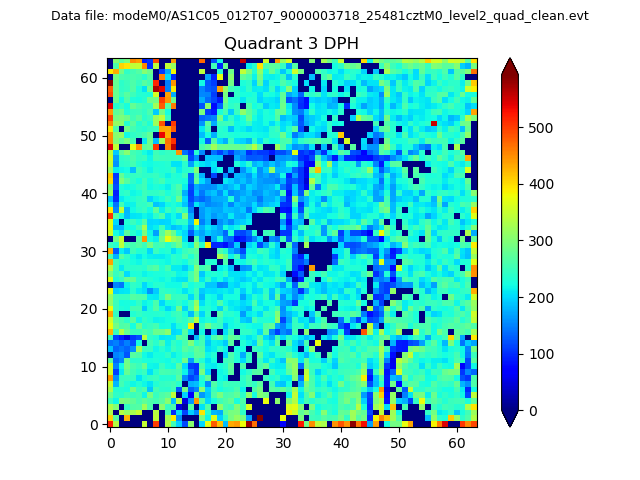 |
 |
Quadrant C |
| Plot type | Count rate plots | Images |
|---|---|---|
| Comparison with Poisson distribution Blue bars denote a histogram of data divided into 1 sec bins. Red curve is a Poisson curve with rate = median count rate of data. |
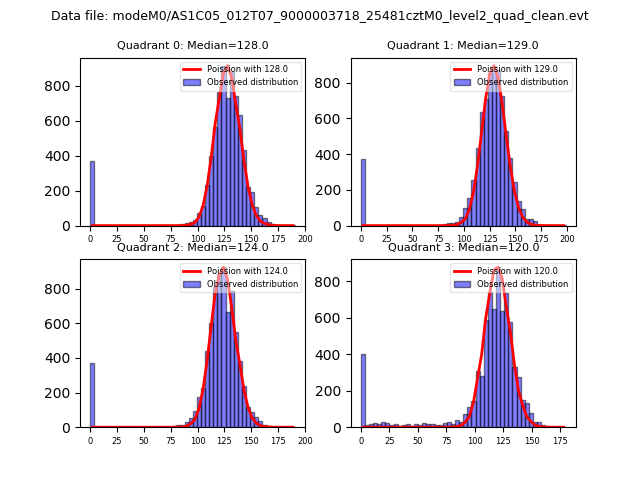 |
 |
| Quadrant-wise count rates Data is divided into 100 sec bins |
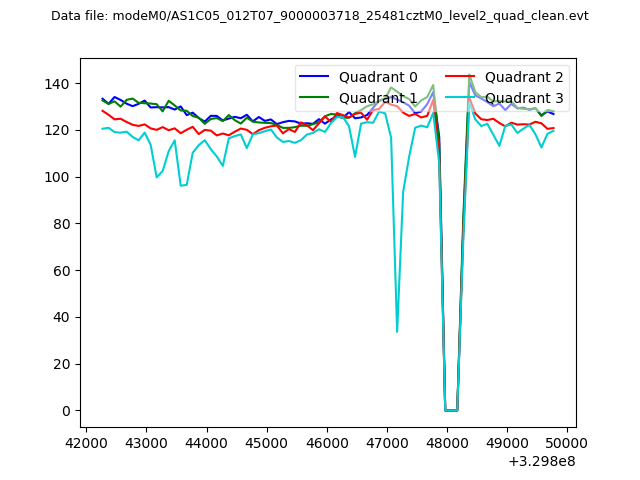 |
|
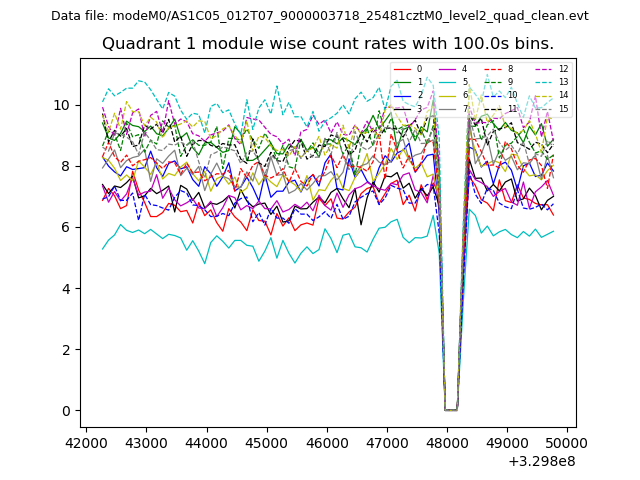
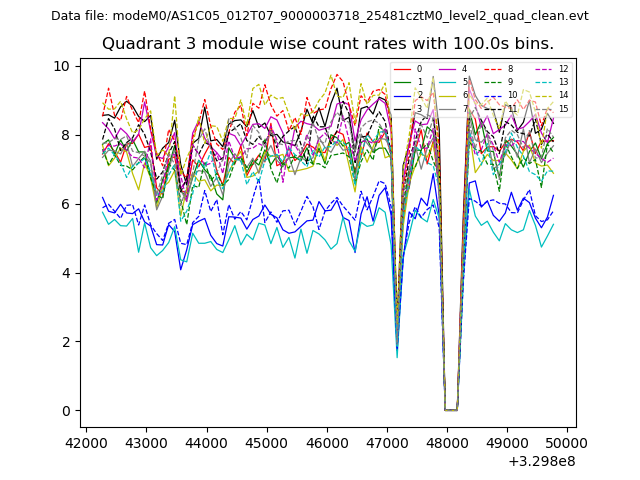
| Module-wise count rates for Quadrant A Data is divided into 100 sec bins |
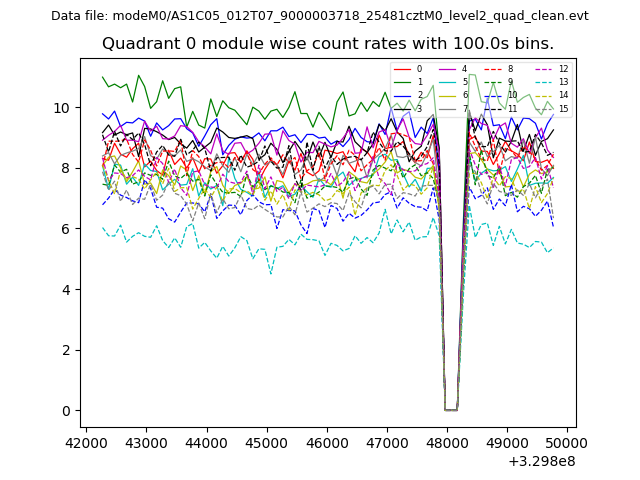 |
 |
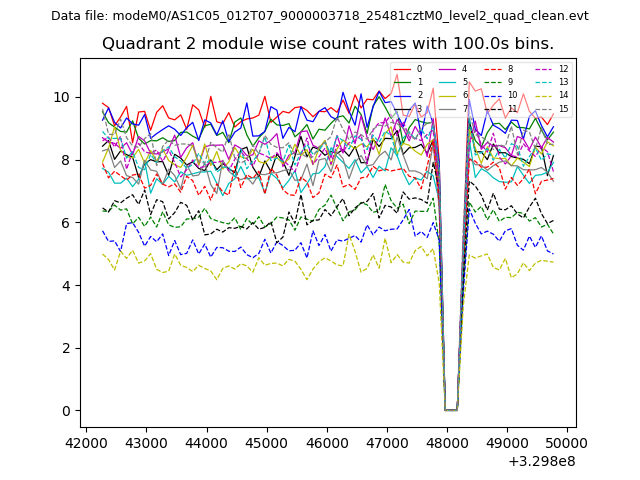
| Module-wise count rates for Quadrant B Data is divided into 100 sec bins |
 |
 |
| Module-wise count rates for Quadrant C Data is divided into 100 sec bins |
 |
 |
| Module-wise count rates for Quadrant D Data is divided into 100 sec bins |
 |
 |
| Parameter | Plot |
|---|---|
| CZT HV Monitor | 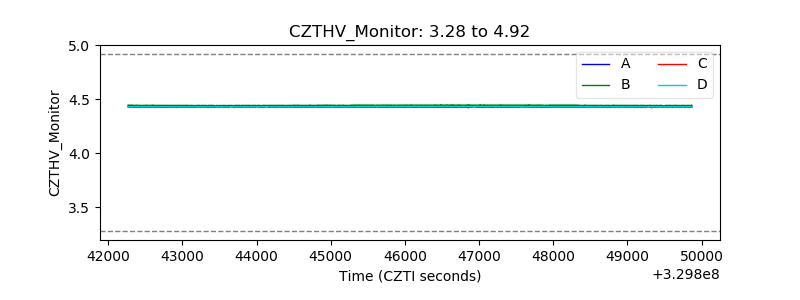 |
| D_VDD | 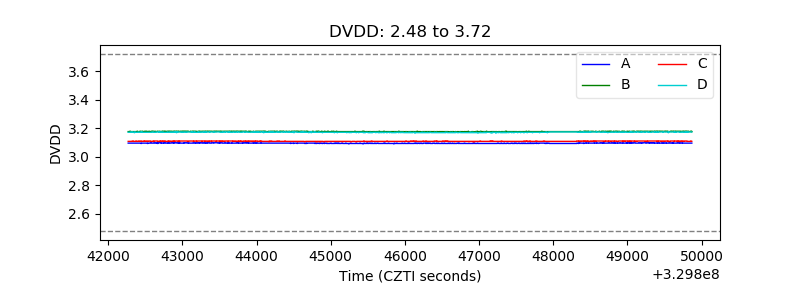 |
| Temperature 1 | 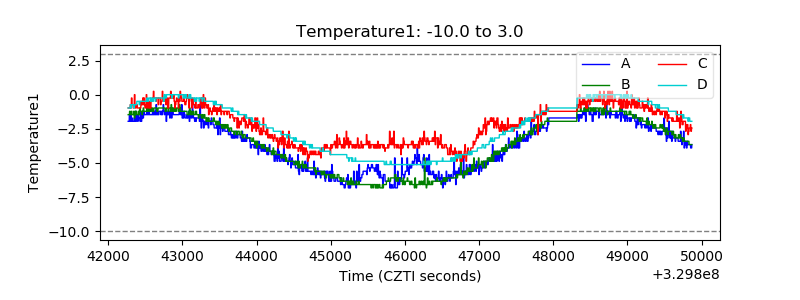 |
| Veto HV Monitor |  |
| Veto LLD | 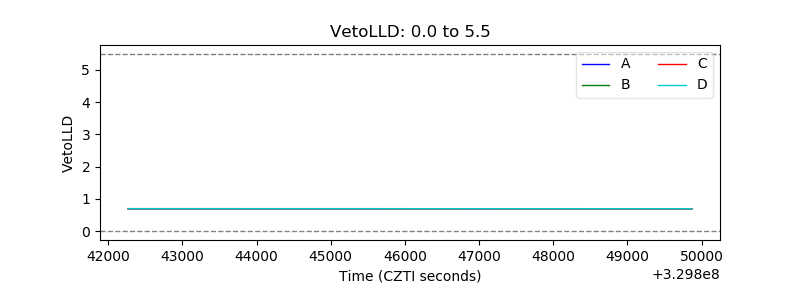 |
| Alpha Counter |  |
| _CPM_Rate | 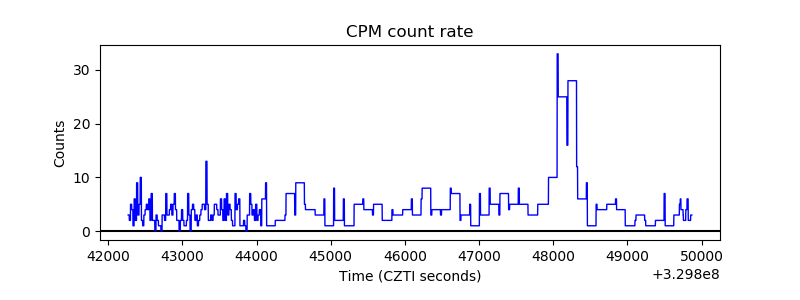 |
| CZT Counter | 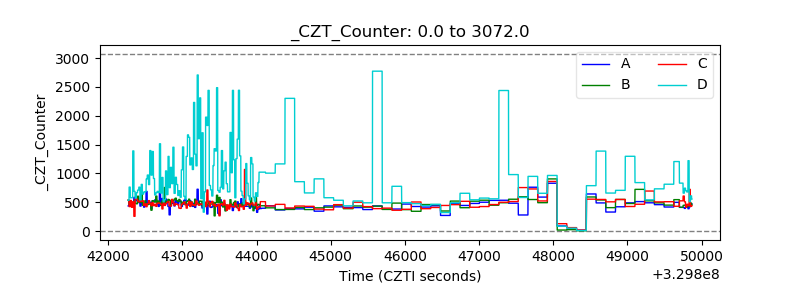 |
| +2.5 Volts monitor |  |
| +5 Volts monitor |  |
| _ROLL_ROT | 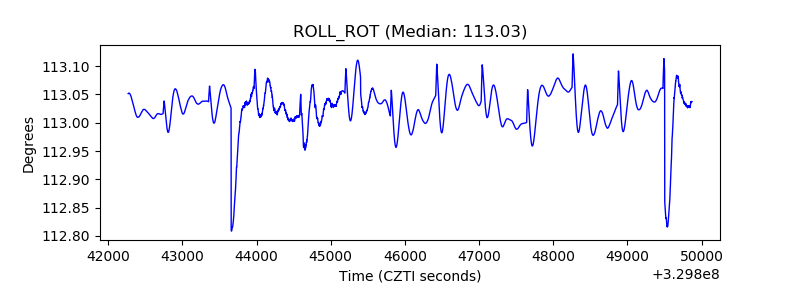 |
| _Roll_DEC | 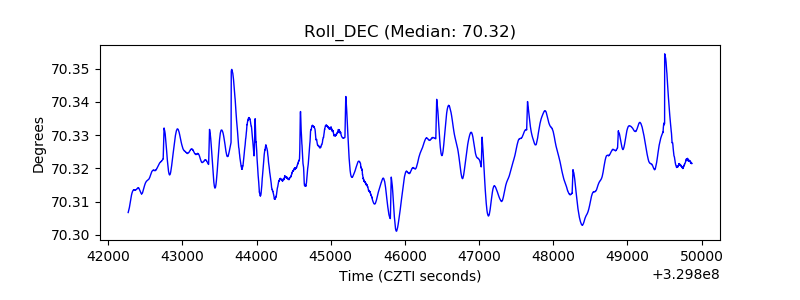 |
| _Roll_RA | 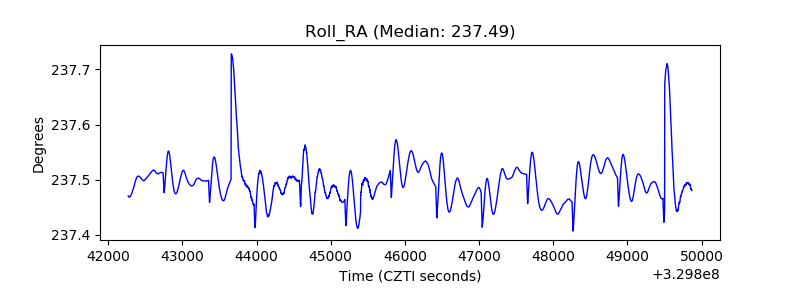 |
| Veto Counter | 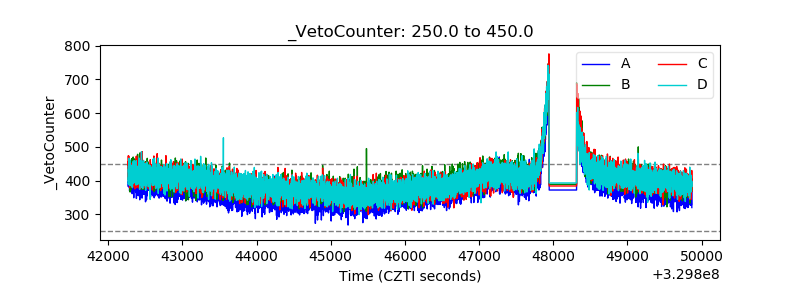 |