| Param | Original file | Final file |
|---|---|---|
| Filename | modeM0/AS1C05_012T07_9000003718_25484cztM0_level2.evt | modeM0/AS1C05_012T07_9000003718_25484cztM0_level2_quad_clean.evt |
| Size (bytes) | 1,316,661,120 | 336,081,600 |
| Size | 1.2 GB | 320.5 MB |
| Events in quadrant A | 8,172,588 | 2,282,088 |
| Events in quadrant B | 8,472,320 | 2,297,527 |
| Events in quadrant C | 8,316,849 | 2,222,644 |
| Events in quadrant D | 13,696,761 | 2,136,928 |
| Mode M9 | |||
|---|---|---|---|
| Quadrant | BADHDUFLAG | Total packets | Discarded packets |
| A | 0 | 20 | 0 |
| B | 0 | 20 | 0 |
| C | 0 | 20 | 0 |
| D | 0 | 20 | 0 |
| Mode M0 | |||
|---|---|---|---|
| Quadrant | BADHDUFLAG | Total packets | Discarded packets |
| A | 0 | 36606 | 0 |
| B | 0 | 37289 | 0 |
| C | 0 | 36701 | 0 |
| D | 0 | 53261 | 0 |
| Quadrant | Total seconds | Saturated seconds | Saturation percentage |
|---|---|---|---|
| A | 18003 | 66 | 0.366606% |
| B | 18004 | 117 | 0.649856% |
| C | 18004 | 184 | 1.021995% |
| D | 18004 | 655 | 3.638080% |
Noise dominated data is calculated using 1-second bins in cleaned event files. If a bin has >2000 counts, and if more than 50% of those come from <1% of pixels, then it is considered to be noise-dominated and hence unusable.
| Quadrant | # 1 sec bins | Bins with >0 counts | Bins with >2000 counts | High rate bins dominated by noise | Noise dominated (total time) | Noise dominated (detector-on time) | Marked lightcurve |
|---|---|---|---|---|---|---|---|
| A | 20028 | 18006 | 0 | 0 | 0.00% | 0.00% | 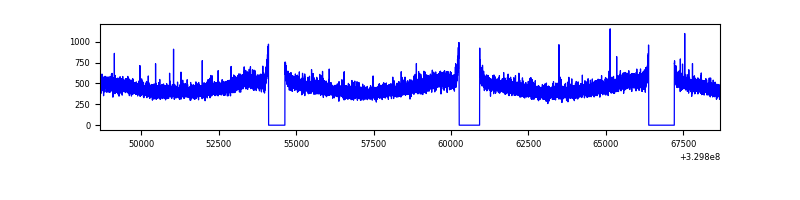 |
| B | 20029 | 18007 | 2 | 2 | 0.01% | 0.01% | 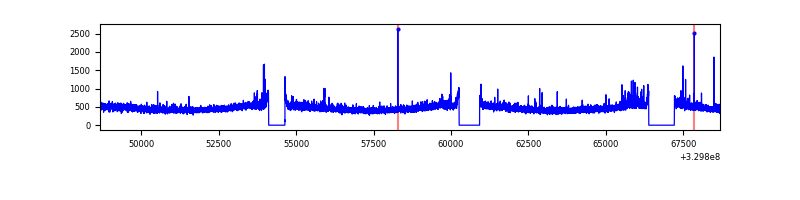 |
| C | 20029 | 18007 | 0 | 0 | 0.00% | 0.00% | 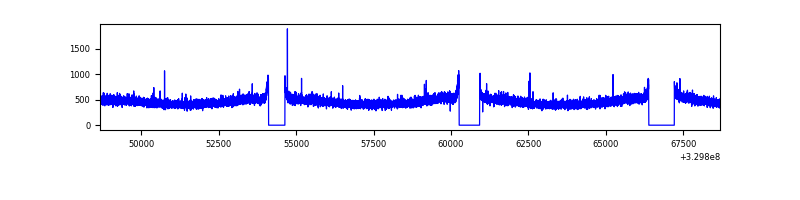 |
| D | 20029 | 18007 | 359 | 359 | 1.79% | 1.99% | 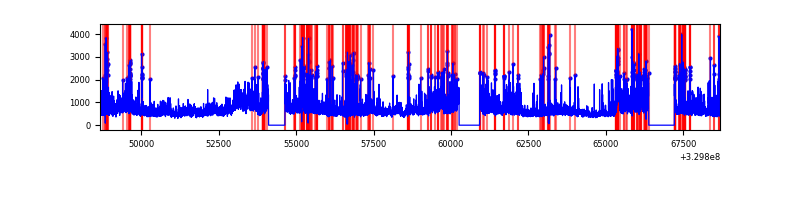 |
Top three noisy pixels from each quadrant. If the there are fewer than three noisy pixels in the level2.evt file, extra rows are filled as -1
| Pixel properties | Quadrant properties | ||||||
|---|---|---|---|---|---|---|---|
| Quadrant | DetID | PixID | Counts | Sigma | Mean | Median | Sigma |
| A | 13 | 254 | 29275 | 64.56 | 2114 | 2066 | 421.5 |
| A | 3 | 137 | 19134 | 40.5 | 2114 | 2066 | 421.5 |
| A | 0 | 226 | 18173 | 38.22 | 2114 | 2066 | 421.5 |
| B | 0 | 229 | 88651 | 218.51 | 2104 | 2046 | 396.3 |
| B | 0 | 190 | 79961 | 196.59 | 2104 | 2046 | 396.3 |
| B | 12 | 111 | 48329 | 116.78 | 2104 | 2046 | 396.3 |
| C | 14 | 238 | 324353 | 682.59 | 2039 | 2051 | 472.2 |
| C | 3 | 233 | 25120 | 48.86 | 2039 | 2051 | 472.2 |
| C | 2 | 16 | 22797 | 43.94 | 2039 | 2051 | 472.2 |
| D | 8 | 195 | 2807973 | 5725.33 | 2039 | 1981 | 490.1 |
| D | 1 | 52 | 2522995 | 5143.86 | 2039 | 1981 | 490.1 |
| D | 2 | 244 | 398075 | 808.19 | 2039 | 1981 | 490.1 |
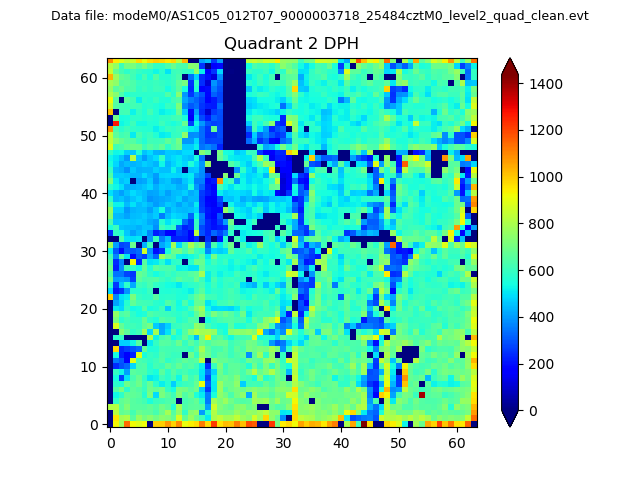
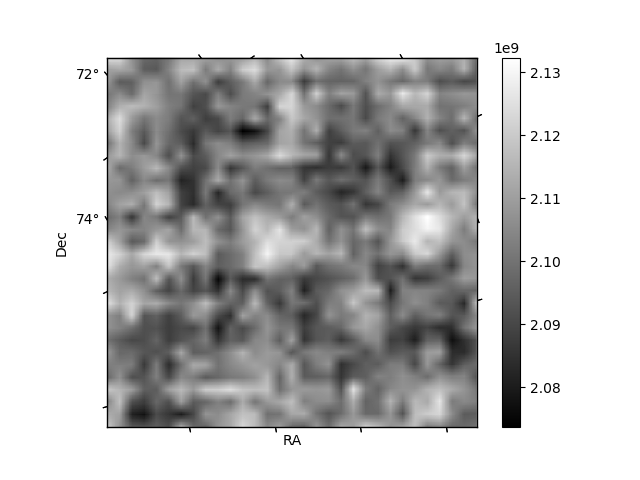
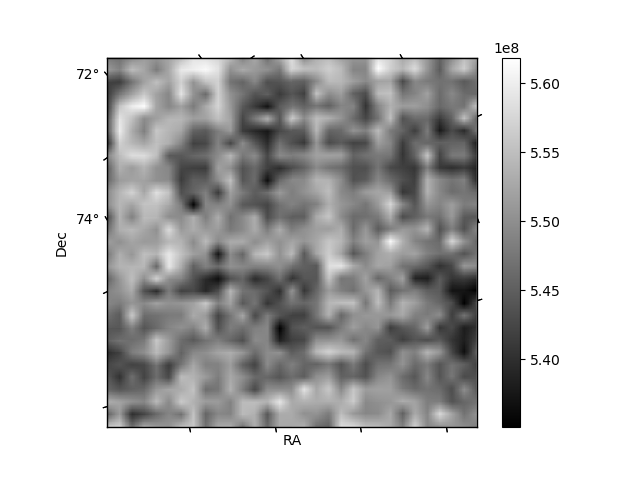
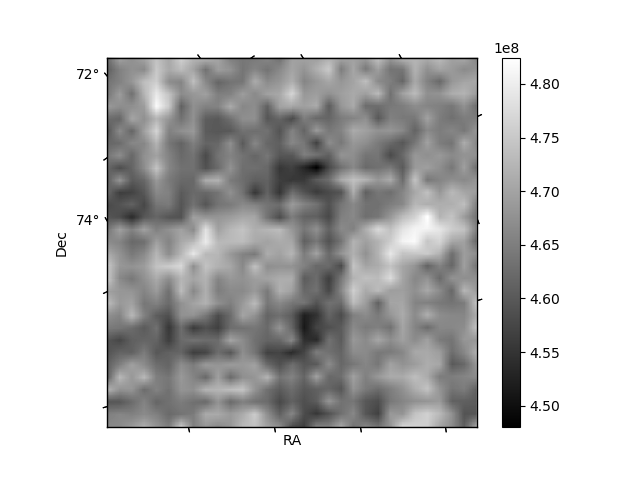
Histogram calculated using DETX and DETY for each event in the final _common_clean file
| Quadrant A | 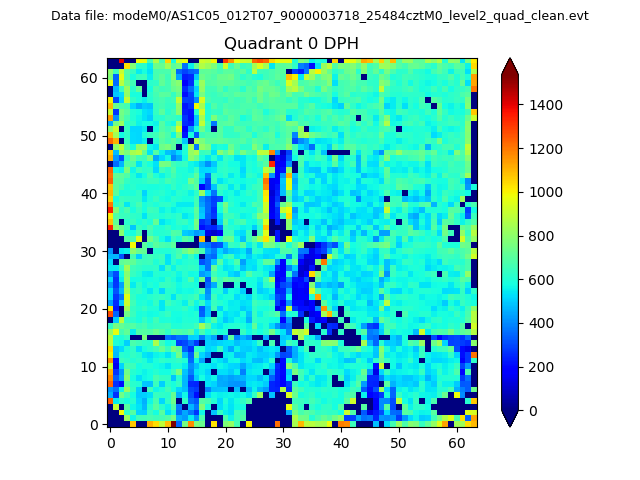 |
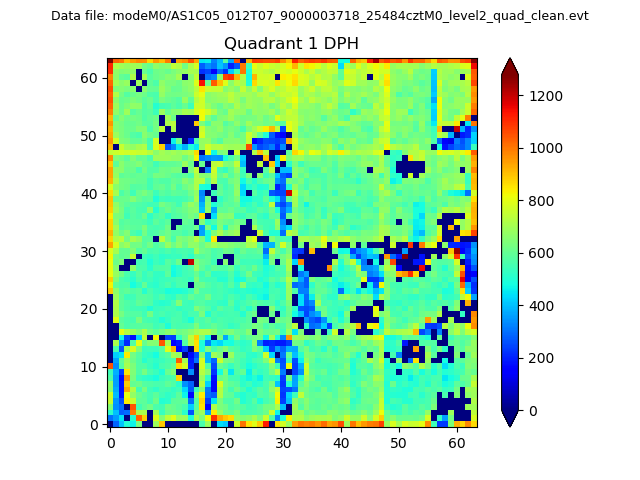 |
Quadrant B |
|---|---|---|---|
| Quadrant D | 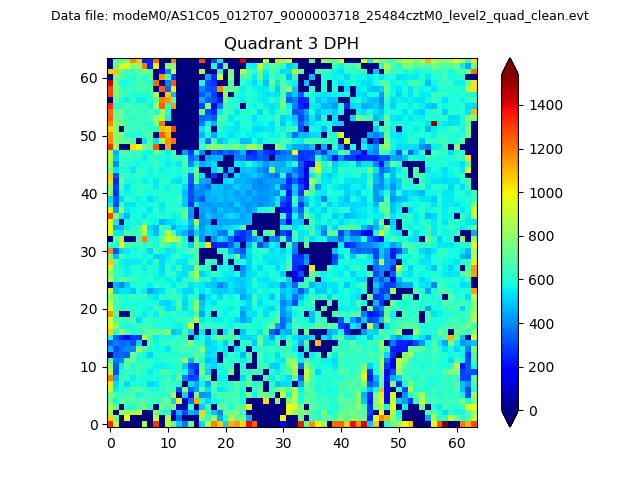 |
 |
Quadrant C |
| Plot type | Count rate plots | Images |
|---|---|---|
| Comparison with Poisson distribution Blue bars denote a histogram of data divided into 1 sec bins. Red curve is a Poisson curve with rate = median count rate of data. |
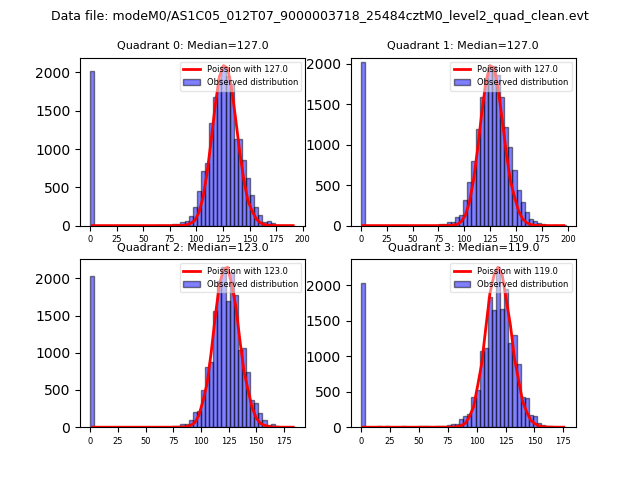 |
 |
| Quadrant-wise count rates Data is divided into 100 sec bins |
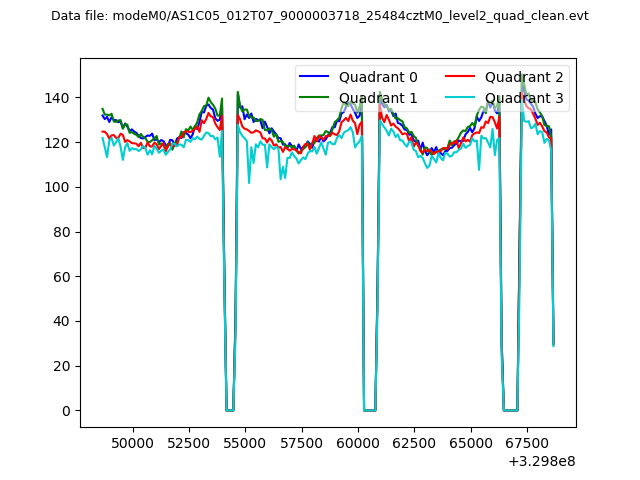 |
|
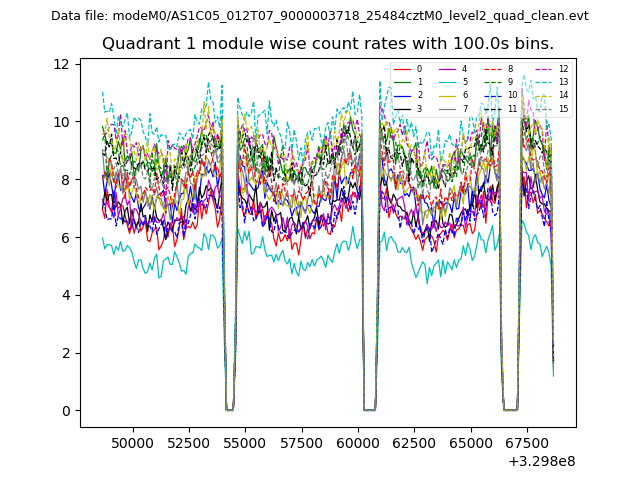
| Module-wise count rates for Quadrant A Data is divided into 100 sec bins |
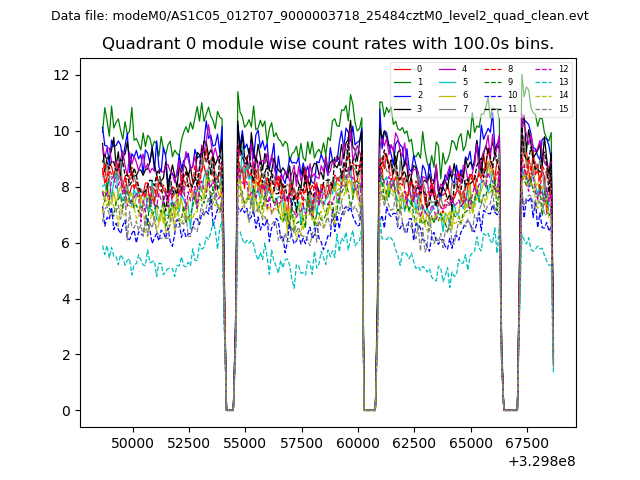 |
 |
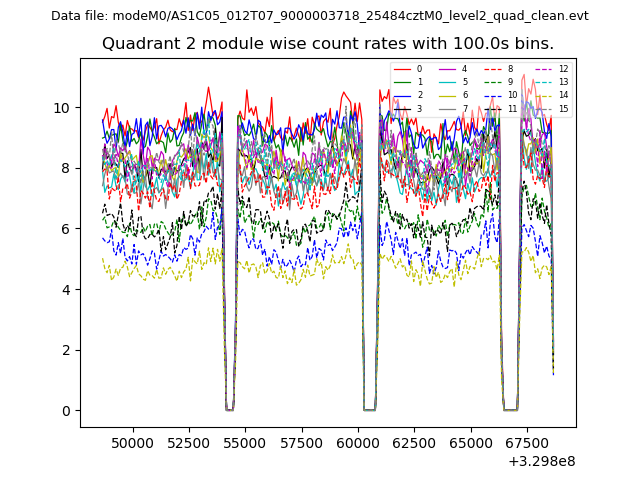
| Module-wise count rates for Quadrant B Data is divided into 100 sec bins |
 |
 |
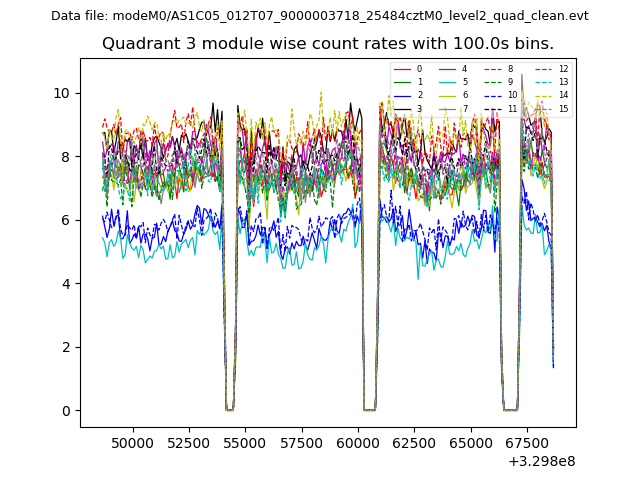
| Module-wise count rates for Quadrant C Data is divided into 100 sec bins |
 |
 |
| Module-wise count rates for Quadrant D Data is divided into 100 sec bins |
 |
 |
| Parameter | Plot |
|---|---|
| CZT HV Monitor | 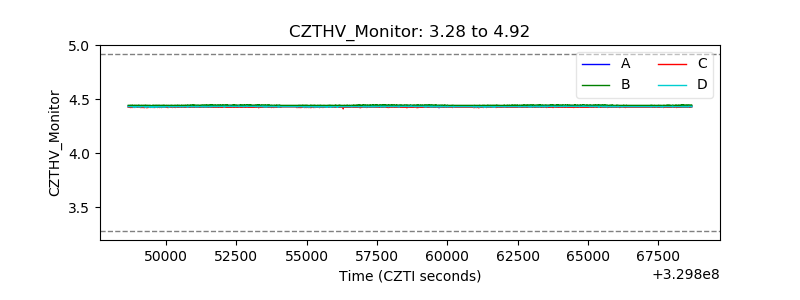 |
| D_VDD | 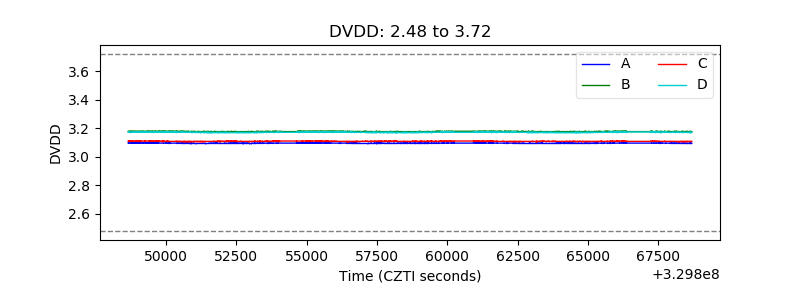 |
| Temperature 1 | 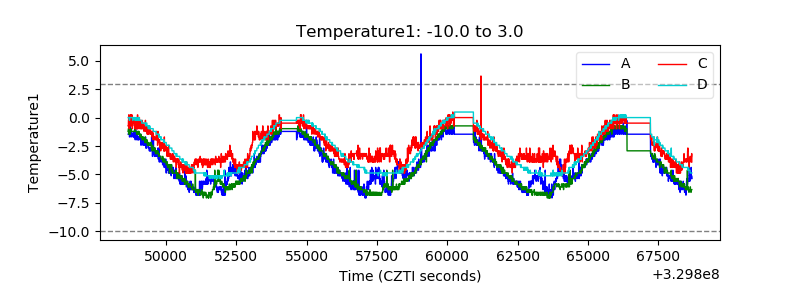 |
| Veto HV Monitor | 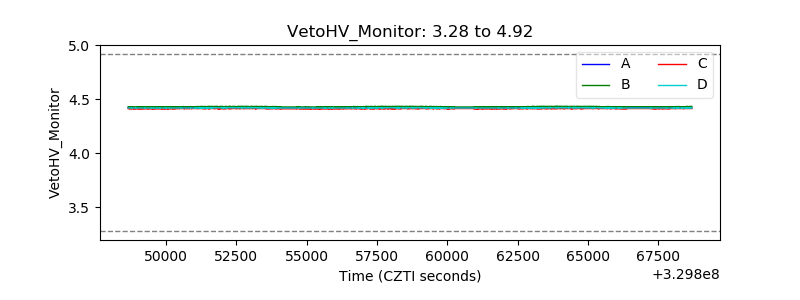 |
| Veto LLD | 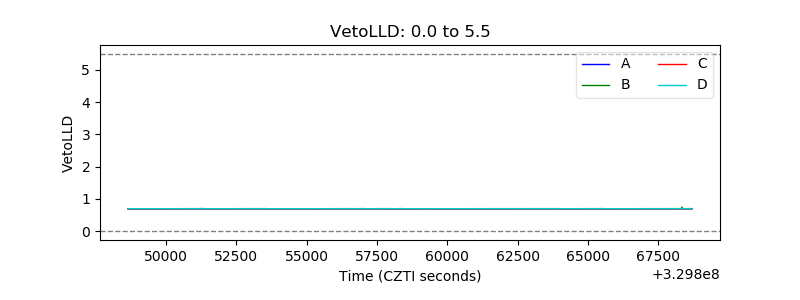 |
| Alpha Counter | 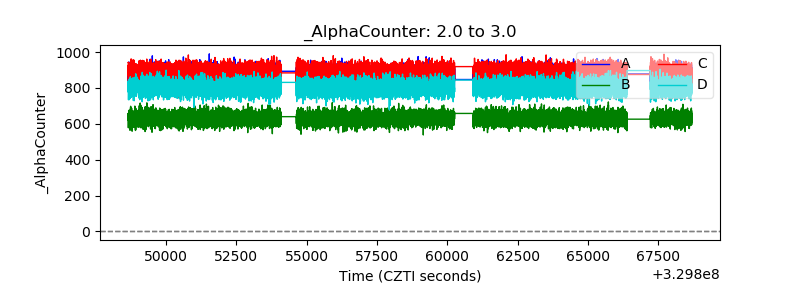 |
| _CPM_Rate | 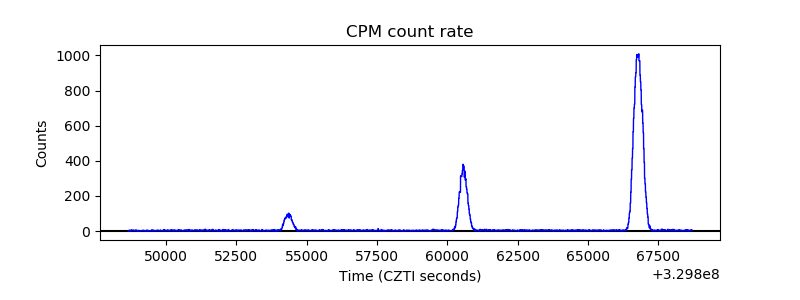 |
| CZT Counter | 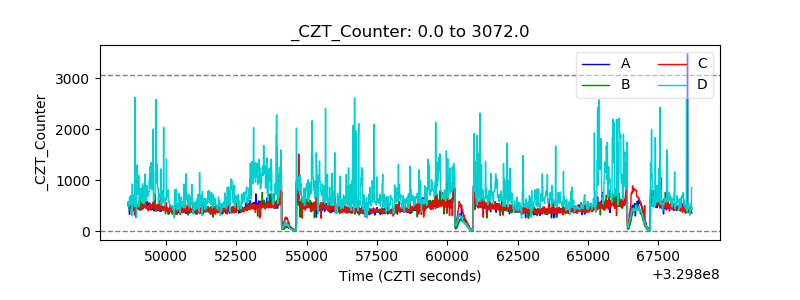 |
| +2.5 Volts monitor |  |
| +5 Volts monitor |  |
| _ROLL_ROT | 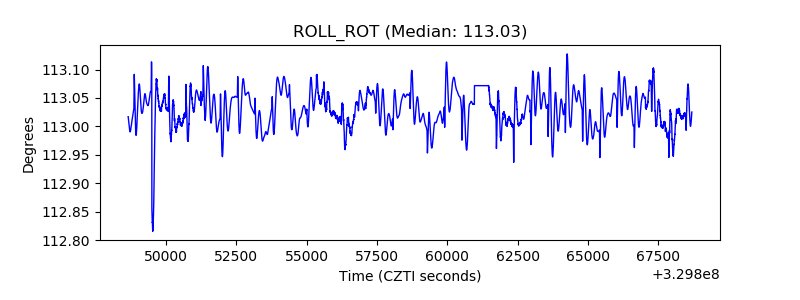 |
| _Roll_DEC | 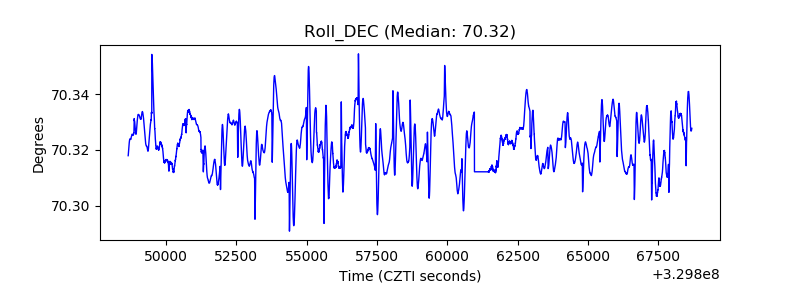 |
| _Roll_RA | 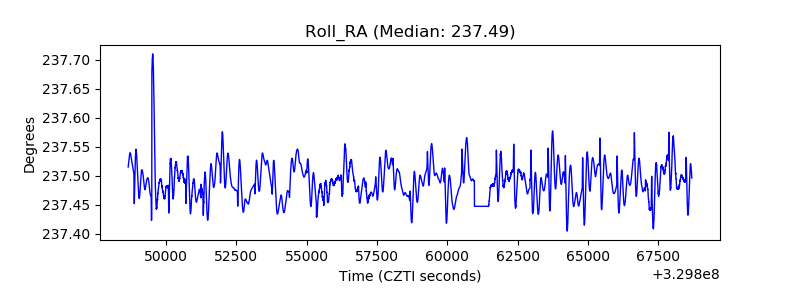 |
| Veto Counter | 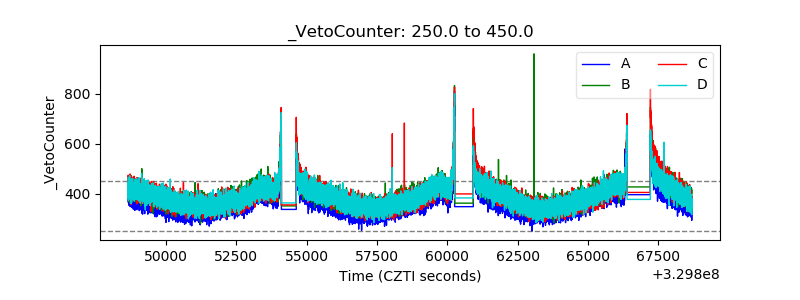 |