| Param | Original file | Final file |
|---|---|---|
| Filename | modeM0/AS1C05_012T07_9000003718_25485cztM0_level2.evt | modeM0/AS1C05_012T07_9000003718_25485cztM0_level2_quad_clean.evt |
| Size (bytes) | 521,216,640 | 130,498,560 |
| Size | 497.1 MB | 124.5 MB |
| Events in quadrant A | 3,145,499 | 889,074 |
| Events in quadrant B | 3,270,168 | 904,116 |
| Events in quadrant C | 3,221,653 | 869,633 |
| Events in quadrant D | 5,684,083 | 813,526 |
| Mode M9 | |||
|---|---|---|---|
| Quadrant | BADHDUFLAG | Total packets | Discarded packets |
| A | 0 | 18 | 0 |
| B | 0 | 18 | 0 |
| C | 0 | 18 | 0 |
| D | 0 | 18 | 0 |
| Mode M0 | |||
|---|---|---|---|
| Quadrant | BADHDUFLAG | Total packets | Discarded packets |
| A | 0 | 13962 | 0 |
| B | 0 | 14271 | 0 |
| C | 0 | 14121 | 0 |
| D | 0 | 21640 | 0 |
| Quadrant | Total seconds | Saturated seconds | Saturation percentage |
|---|---|---|---|
| A | 6834 | 17 | 0.248756% |
| B | 6835 | 55 | 0.804682% |
| C | 6835 | 76 | 1.111924% |
| D | 6835 | 511 | 7.476225% |
Noise dominated data is calculated using 1-second bins in cleaned event files. If a bin has >2000 counts, and if more than 50% of those come from <1% of pixels, then it is considered to be noise-dominated and hence unusable.
| Quadrant | # 1 sec bins | Bins with >0 counts | Bins with >2000 counts | High rate bins dominated by noise | Noise dominated (total time) | Noise dominated (detector-on time) | Marked lightcurve |
|---|---|---|---|---|---|---|---|
| A | 8644 | 6836 | 0 | 0 | 0.00% | 0.00% | 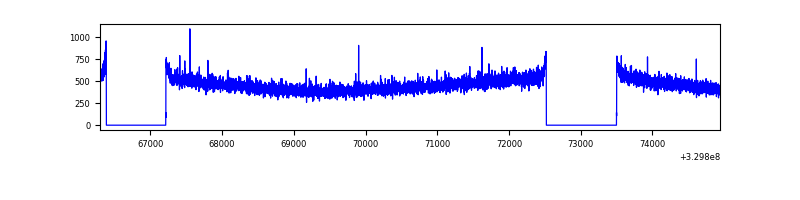 |
| B | 8645 | 6837 | 1 | 1 | 0.01% | 0.01% | 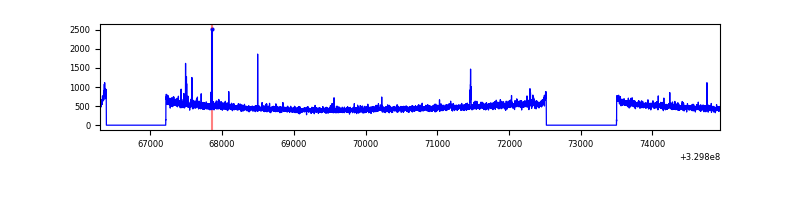 |
| C | 8645 | 6837 | 0 | 0 | 0.00% | 0.00% | 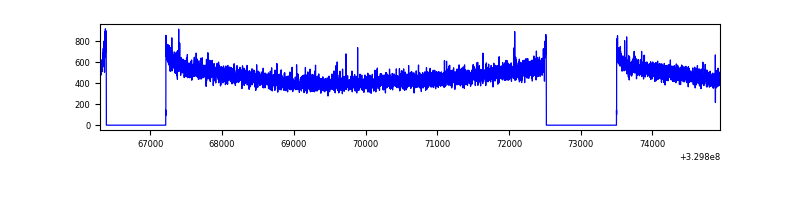 |
| D | 8645 | 6837 | 438 | 438 | 5.07% | 6.41% | 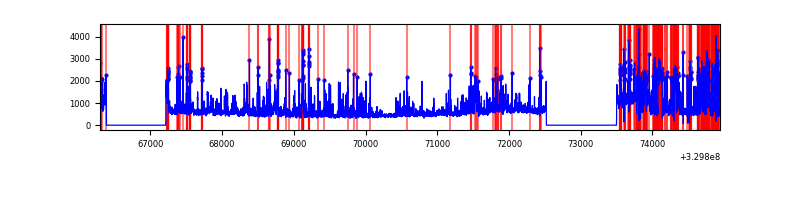 |
Top three noisy pixels from each quadrant. If the there are fewer than three noisy pixels in the level2.evt file, extra rows are filled as -1
| Pixel properties | Quadrant properties | ||||||
|---|---|---|---|---|---|---|---|
| Quadrant | DetID | PixID | Counts | Sigma | Mean | Median | Sigma |
| A | 13 | 254 | 11114 | 62.93 | 814 | 797 | 163.9 |
| A | 3 | 137 | 7475 | 40.73 | 814 | 797 | 163.9 |
| A | 0 | 226 | 6996 | 37.81 | 814 | 797 | 163.9 |
| B | 0 | 190 | 23572 | 148.68 | 816 | 793 | 153.2 |
| B | 0 | 229 | 20385 | 127.88 | 816 | 793 | 153.2 |
| B | 12 | 111 | 18543 | 115.86 | 816 | 793 | 153.2 |
| C | 14 | 238 | 124669 | 669.33 | 790 | 796 | 185.1 |
| C | 2 | 16 | 10835 | 54.24 | 790 | 796 | 185.1 |
| C | 13 | 61 | 5588 | 25.89 | 790 | 796 | 185.1 |
| D | 1 | 52 | 2296260 | 12243.06 | 771 | 747 | 187.5 |
| D | 8 | 195 | 268952 | 1430.46 | 771 | 747 | 187.5 |
| D | 2 | 244 | 92320 | 488.4 | 771 | 747 | 187.5 |
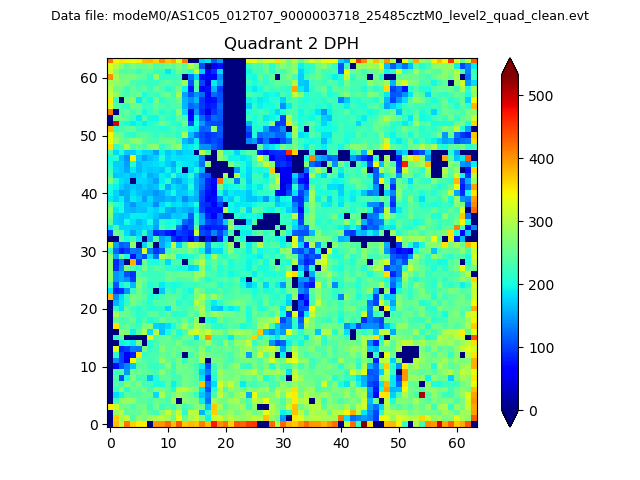
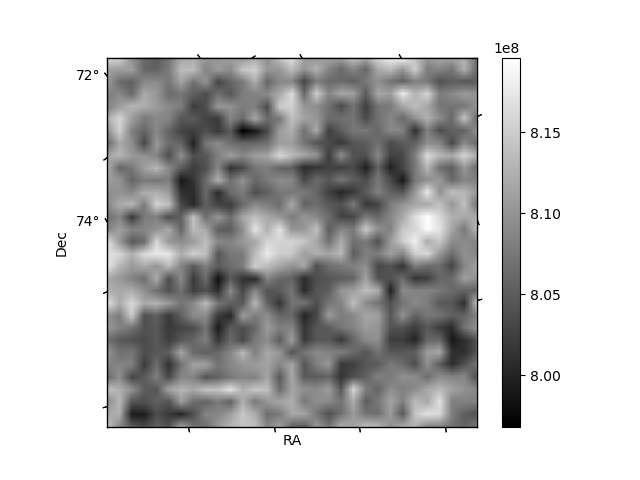
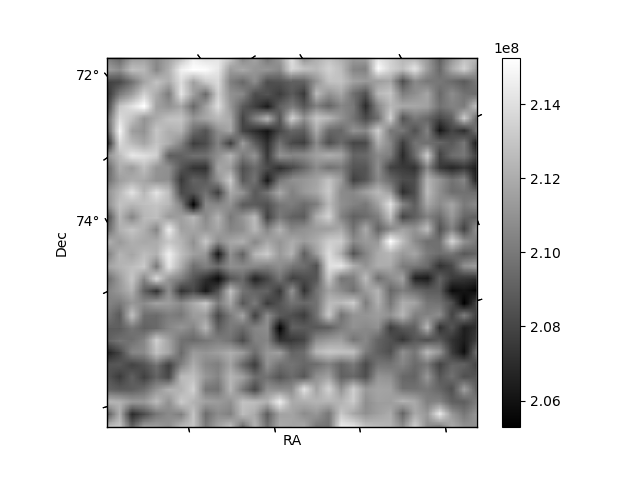
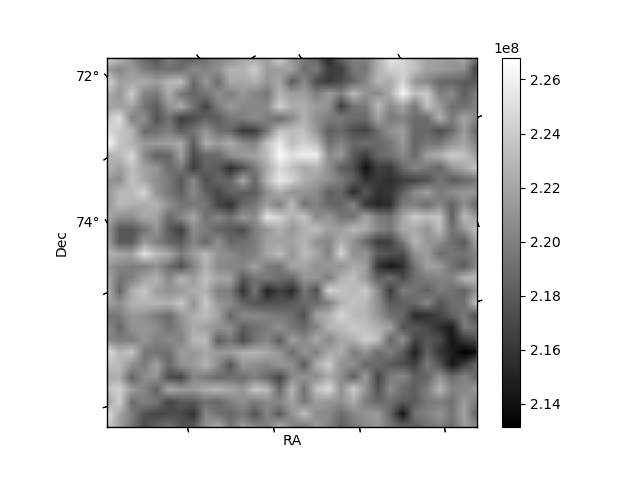
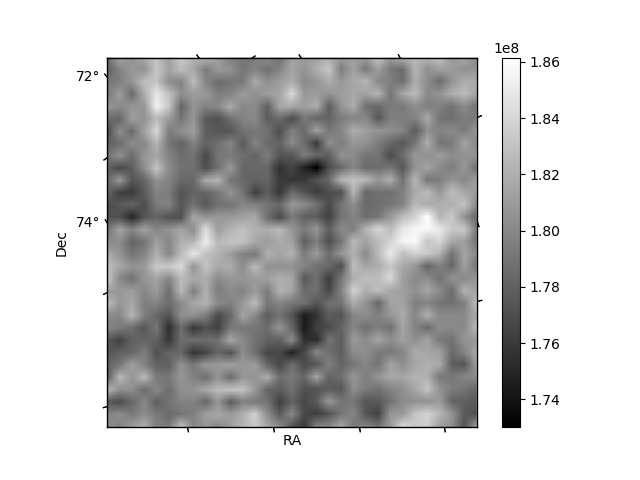
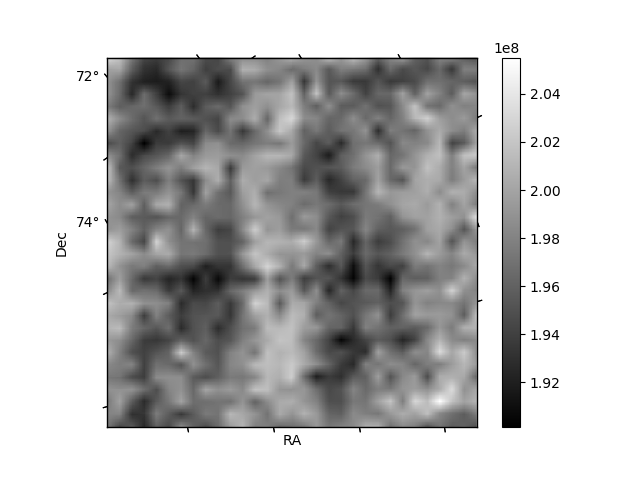
Histogram calculated using DETX and DETY for each event in the final _common_clean file
| Quadrant A | 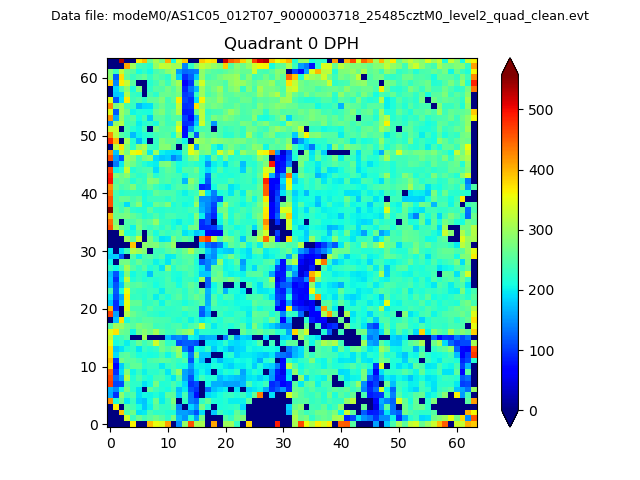 |
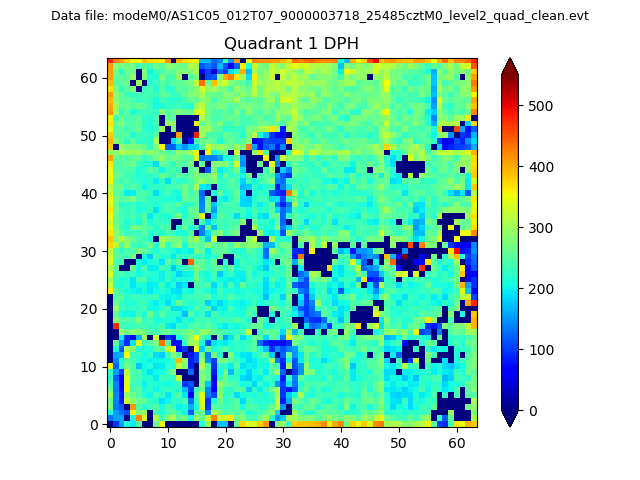 |
Quadrant B |
|---|---|---|---|
| Quadrant D | 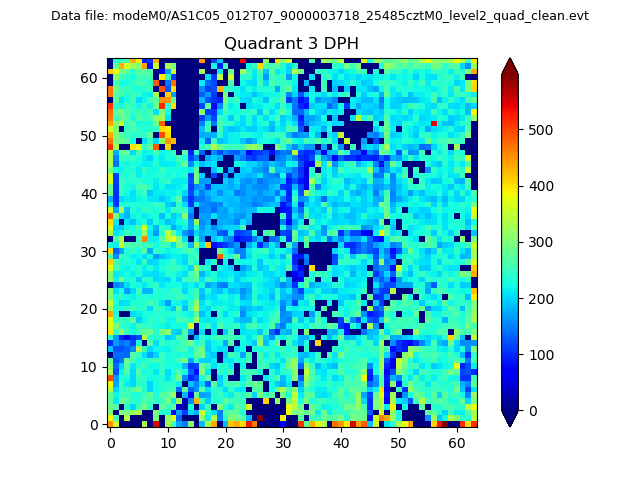 |
 |
Quadrant C |
| Plot type | Count rate plots | Images |
|---|---|---|
| Comparison with Poisson distribution Blue bars denote a histogram of data divided into 1 sec bins. Red curve is a Poisson curve with rate = median count rate of data. |
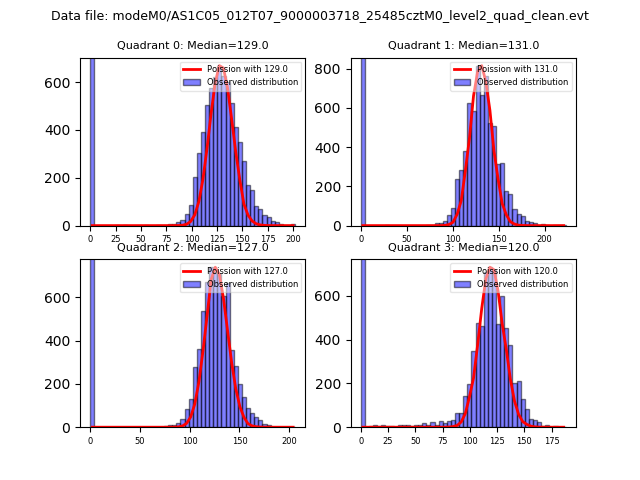 |
 |
| Quadrant-wise count rates Data is divided into 100 sec bins |
 |
|
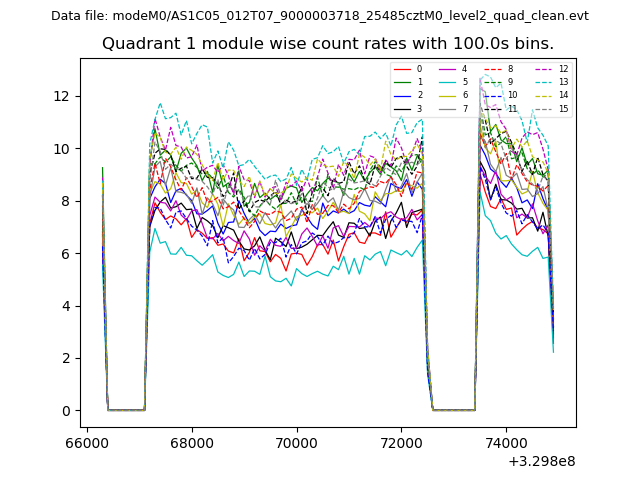
| Module-wise count rates for Quadrant A Data is divided into 100 sec bins |
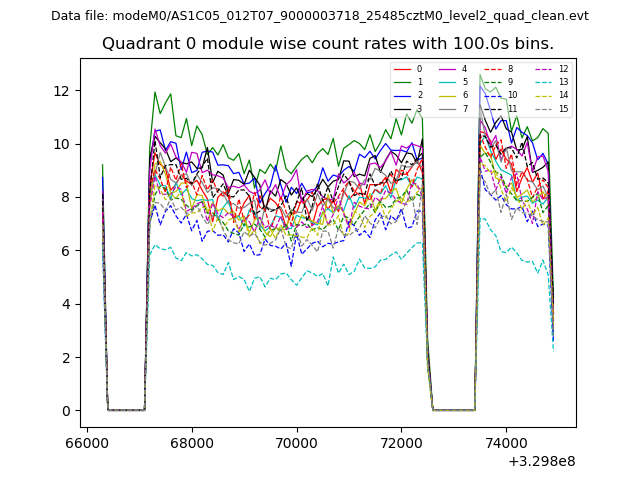 |
 |
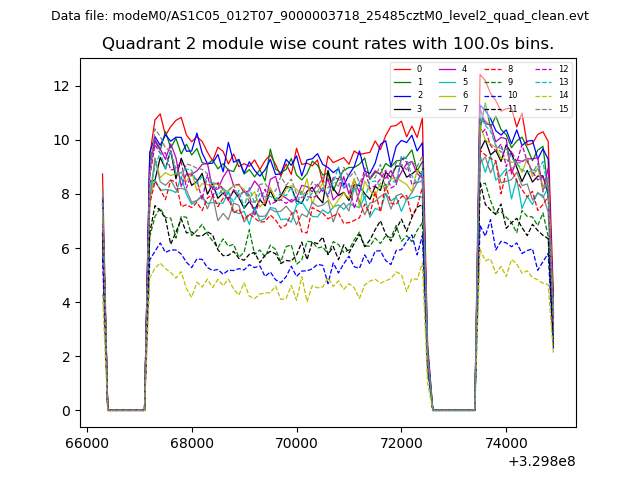
| Module-wise count rates for Quadrant B Data is divided into 100 sec bins |
 |
 |
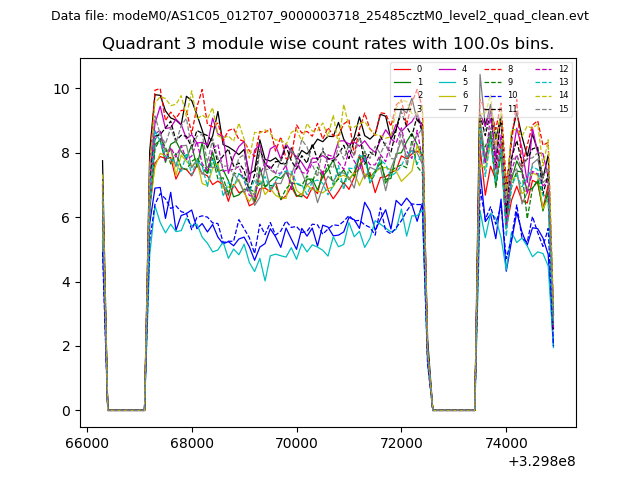
| Module-wise count rates for Quadrant C Data is divided into 100 sec bins |
 |
 |
| Module-wise count rates for Quadrant D Data is divided into 100 sec bins |
 |
 |
| Parameter | Plot |
|---|---|
| CZT HV Monitor | 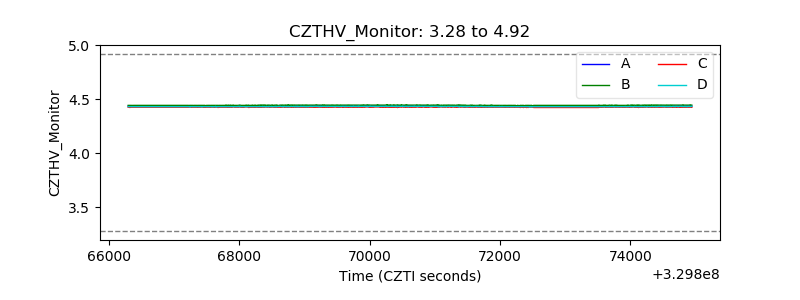 |
| D_VDD | 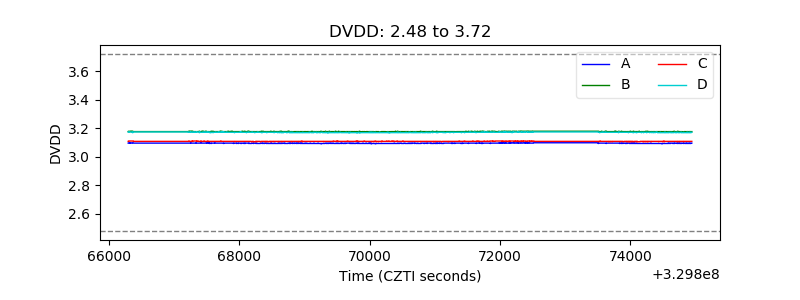 |
| Temperature 1 | 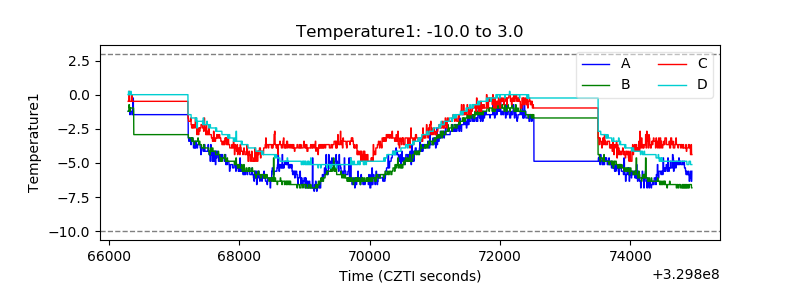 |
| Veto HV Monitor | 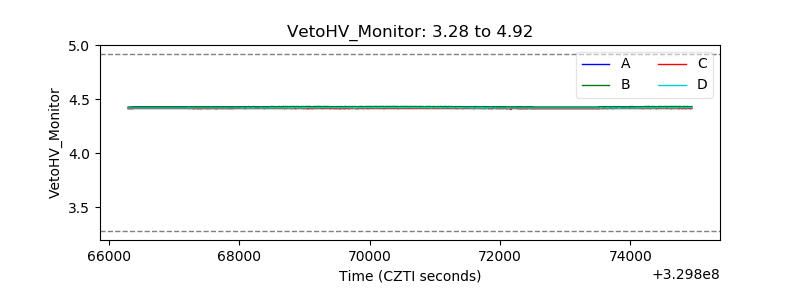 |
| Veto LLD | 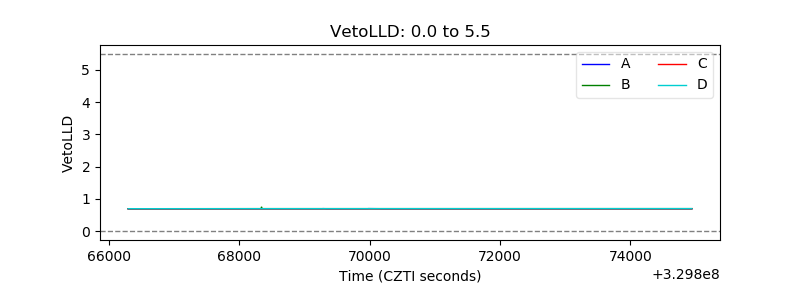 |
| Alpha Counter | 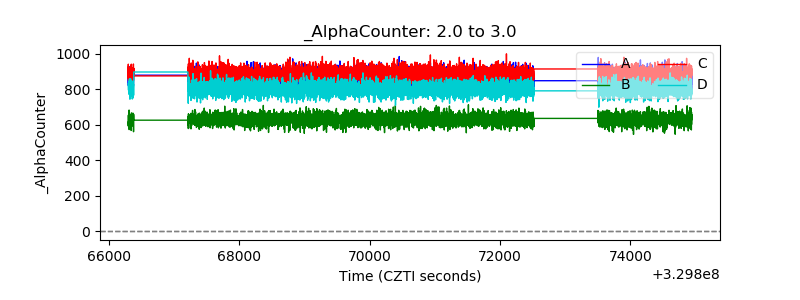 |
| _CPM_Rate | 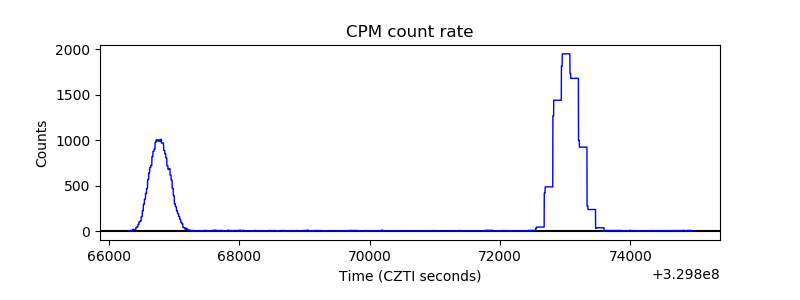 |
| CZT Counter | 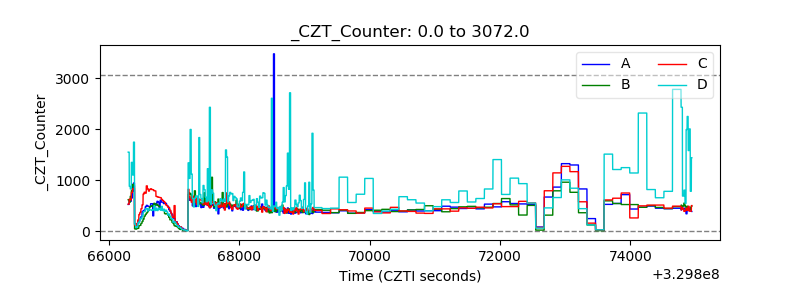 |
| +2.5 Volts monitor |  |
| +5 Volts monitor |  |
| _ROLL_ROT | 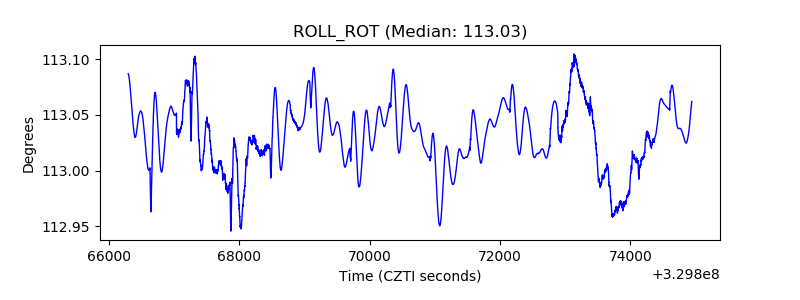 |
| _Roll_DEC | 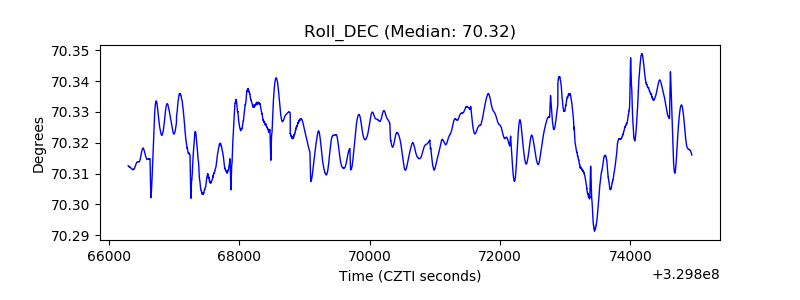 |
| _Roll_RA |  |
| Veto Counter | 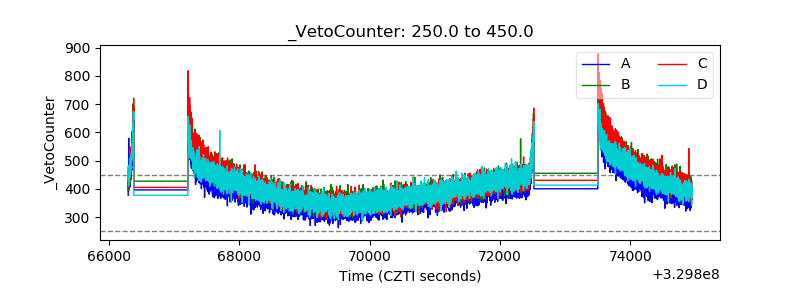 |