| Param | Original file | Final file |
|---|---|---|
| Filename | modeM0/AS1C05_012T07_9000003718_25487cztM0_level2.evt | modeM0/AS1C05_012T07_9000003718_25487cztM0_level2_quad_clean.evt |
| Size (bytes) | 504,132,480 | 128,062,080 |
| Size | 480.8 MB | 122.1 MB |
| Events in quadrant A | 3,023,860 | 881,204 |
| Events in quadrant B | 3,131,872 | 897,187 |
| Events in quadrant C | 3,088,303 | 855,774 |
| Events in quadrant D | 5,583,206 | 791,854 |
| Mode M9 | |||
|---|---|---|---|
| Quadrant | BADHDUFLAG | Total packets | Discarded packets |
| A | 0 | 17 | 0 |
| B | 0 | 18 | 0 |
| C | 0 | 18 | 0 |
| D | 0 | 18 | 0 |
| Mode M0 | |||
|---|---|---|---|
| Quadrant | BADHDUFLAG | Total packets | Discarded packets |
| A | 0 | 13256 | 0 |
| B | 0 | 13509 | 0 |
| C | 0 | 13413 | 0 |
| D | 0 | 21097 | 0 |
| Quadrant | Total seconds | Saturated seconds | Saturation percentage |
|---|---|---|---|
| A | 6488 | 23 | 0.354501% |
| B | 6488 | 42 | 0.647349% |
| C | 6488 | 68 | 1.048089% |
| D | 6488 | 556 | 8.569667% |
Noise dominated data is calculated using 1-second bins in cleaned event files. If a bin has >2000 counts, and if more than 50% of those come from <1% of pixels, then it is considered to be noise-dominated and hence unusable.
| Quadrant | # 1 sec bins | Bins with >0 counts | Bins with >2000 counts | High rate bins dominated by noise | Noise dominated (total time) | Noise dominated (detector-on time) | Marked lightcurve |
|---|---|---|---|---|---|---|---|
| A | 7598 | 6489 | 0 | 0 | 0.00% | 0.00% | 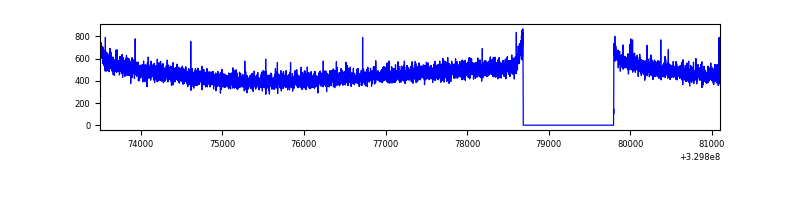 |
| B | 7598 | 6489 | 0 | 0 | 0.00% | 0.00% | 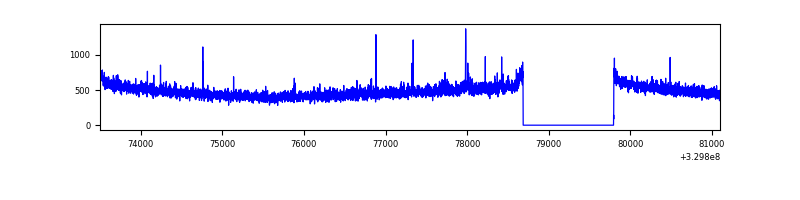 |
| C | 7598 | 6489 | 0 | 0 | 0.00% | 0.00% | 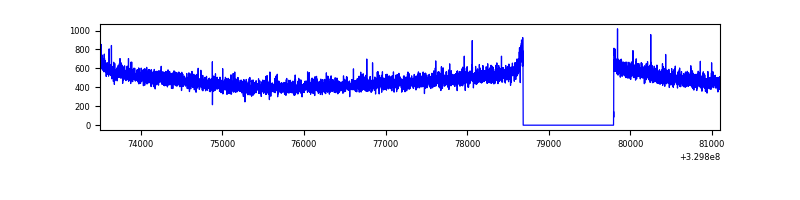 |
| D | 7598 | 6489 | 481 | 481 | 6.33% | 7.41% | 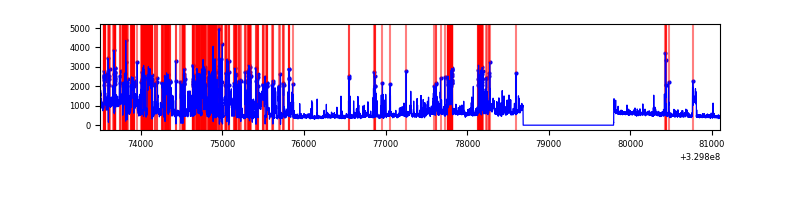 |
Top three noisy pixels from each quadrant. If the there are fewer than three noisy pixels in the level2.evt file, extra rows are filled as -1
| Pixel properties | Quadrant properties | ||||||
|---|---|---|---|---|---|---|---|
| Quadrant | DetID | PixID | Counts | Sigma | Mean | Median | Sigma |
| A | 13 | 254 | 9761 | 57.71 | 783 | 767 | 155.8 |
| A | 3 | 137 | 6885 | 39.26 | 783 | 767 | 155.8 |
| A | 0 | 226 | 6641 | 37.69 | 783 | 767 | 155.8 |
| B | 12 | 111 | 17782 | 114.96 | 788 | 769 | 148.0 |
| B | 0 | 245 | 16293 | 104.9 | 788 | 769 | 148.0 |
| B | 11 | 111 | 15470 | 99.34 | 788 | 769 | 148.0 |
| C | 14 | 238 | 121774 | 684.79 | 758 | 763 | 176.7 |
| C | 3 | 233 | 7045 | 35.55 | 758 | 763 | 176.7 |
| C | 13 | 61 | 5258 | 25.44 | 758 | 763 | 176.7 |
| D | 1 | 52 | 2381157 | 13308.05 | 733 | 711 | 178.9 |
| D | 8 | 195 | 198521 | 1105.87 | 733 | 711 | 178.9 |
| D | 12 | 233 | 127818 | 710.6 | 733 | 711 | 178.9 |
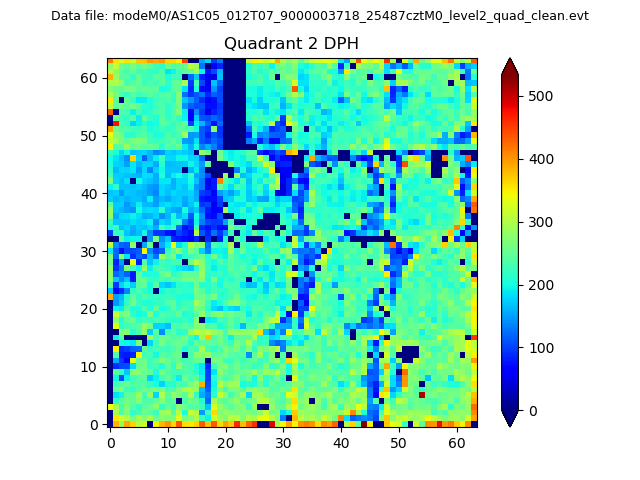
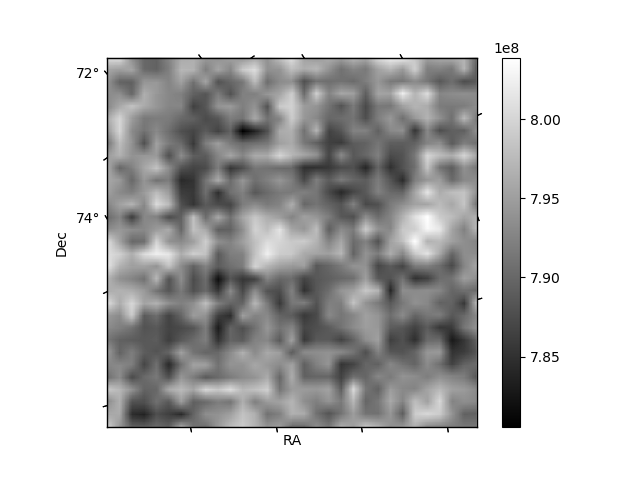
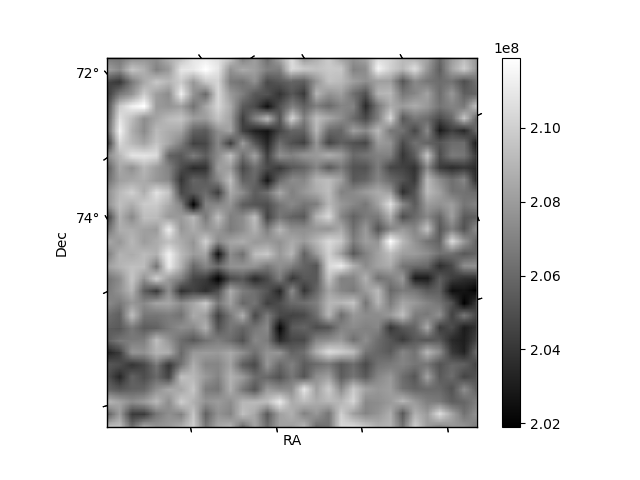
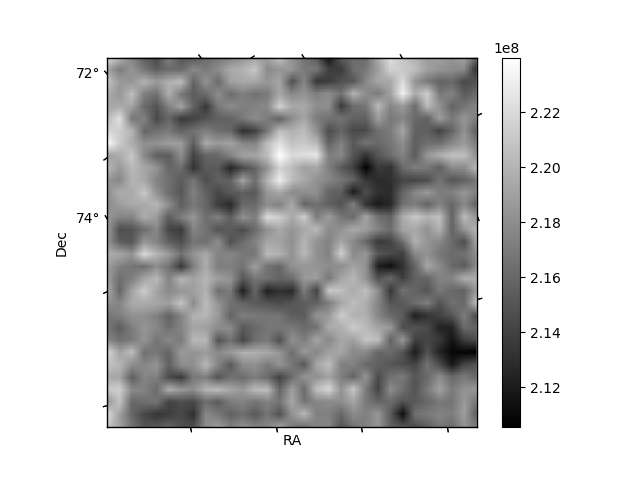
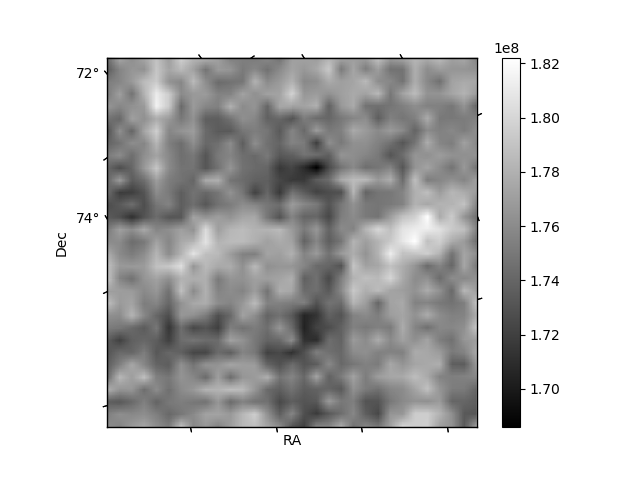
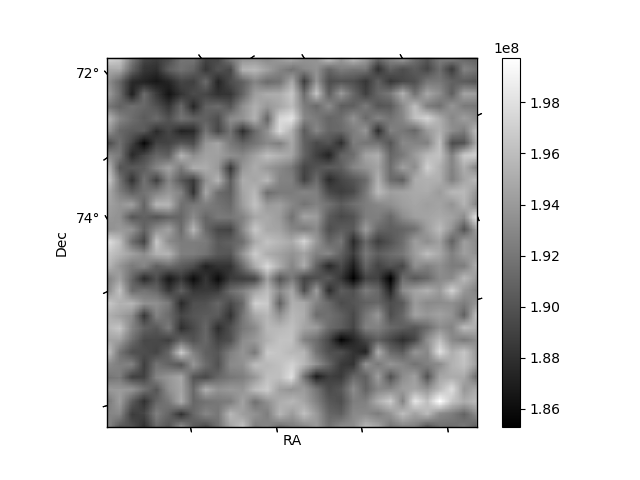
Histogram calculated using DETX and DETY for each event in the final _common_clean file
| Quadrant A | 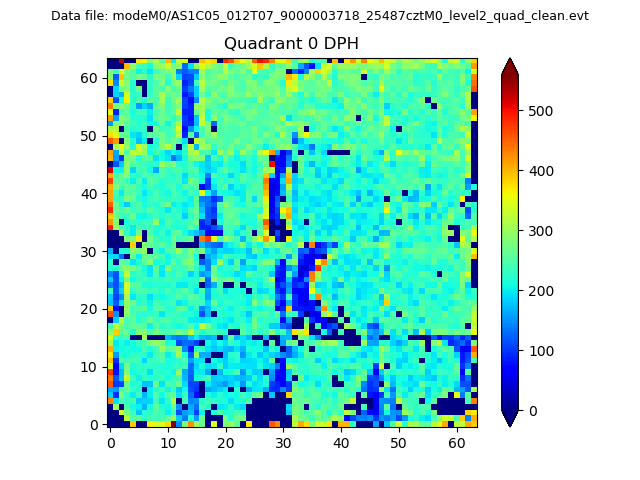 |
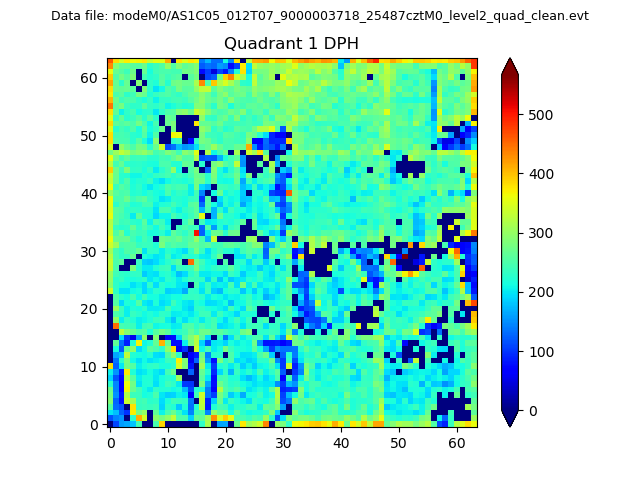 |
Quadrant B |
|---|---|---|---|
| Quadrant D | 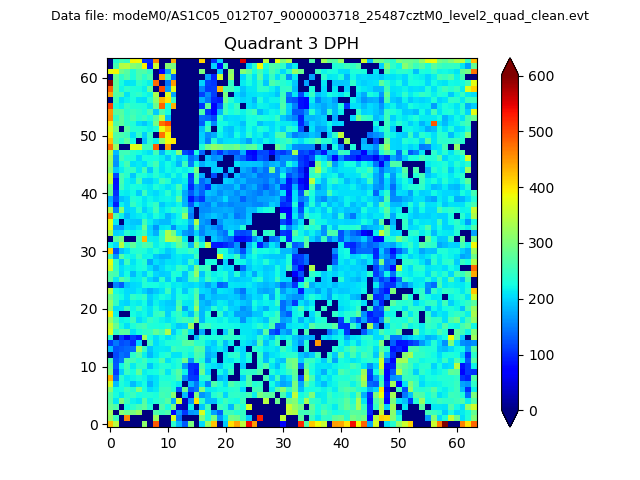 |
 |
Quadrant C |
| Plot type | Count rate plots | Images |
|---|---|---|
| Comparison with Poisson distribution Blue bars denote a histogram of data divided into 1 sec bins. Red curve is a Poisson curve with rate = median count rate of data. |
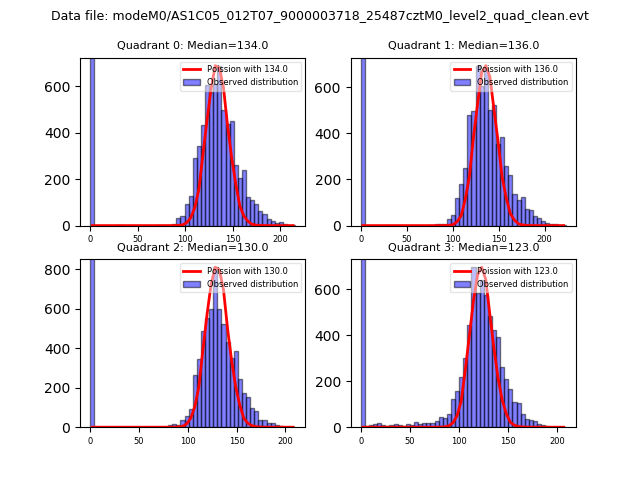 |
 |
| Quadrant-wise count rates Data is divided into 100 sec bins |
 |
|
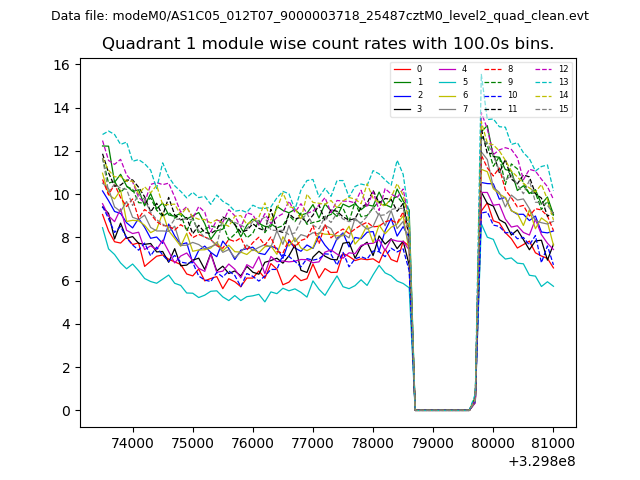
| Module-wise count rates for Quadrant A Data is divided into 100 sec bins |
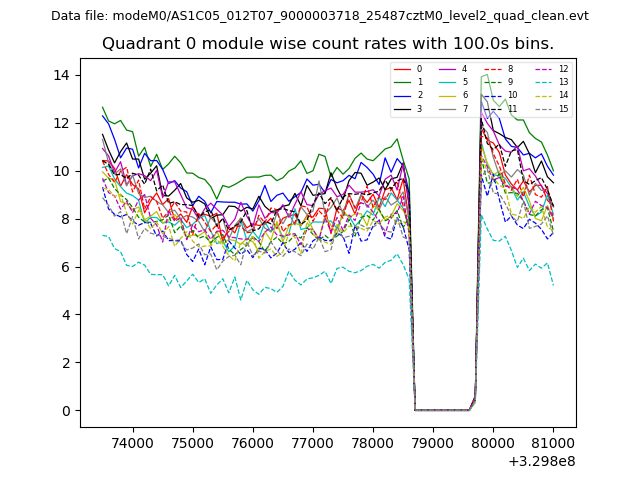 |
 |
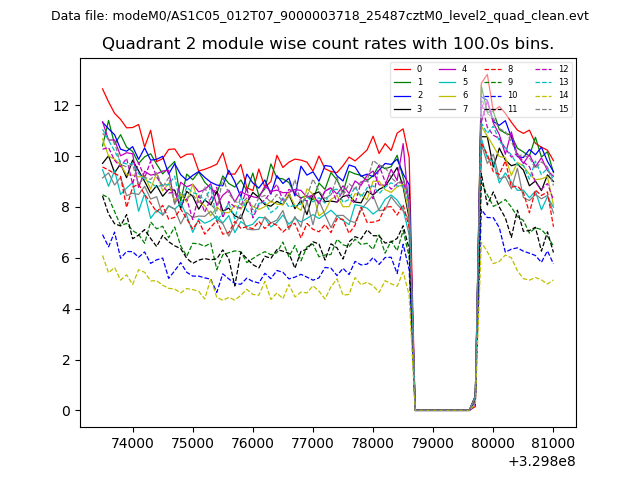
| Module-wise count rates for Quadrant B Data is divided into 100 sec bins |
 |
 |
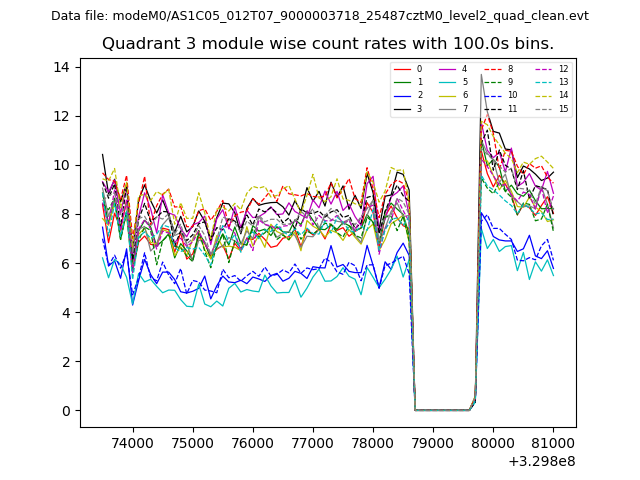
| Module-wise count rates for Quadrant C Data is divided into 100 sec bins |
 |
 |
| Module-wise count rates for Quadrant D Data is divided into 100 sec bins |
 |
 |
| Parameter | Plot |
|---|---|
| CZT HV Monitor | 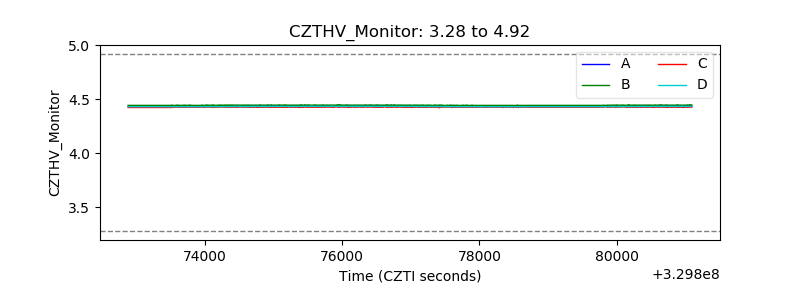 |
| D_VDD | 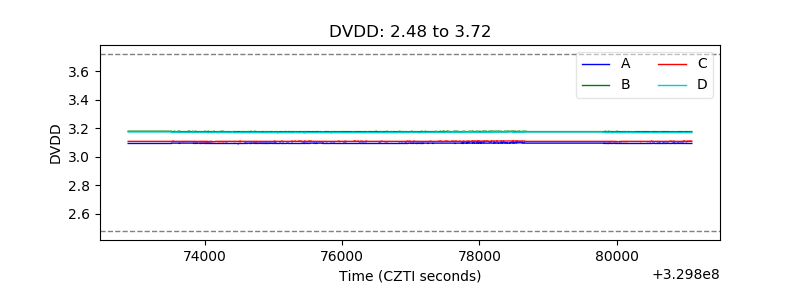 |
| Temperature 1 | 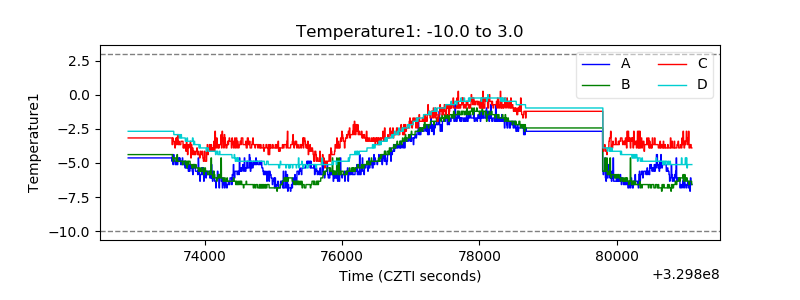 |
| Veto HV Monitor | 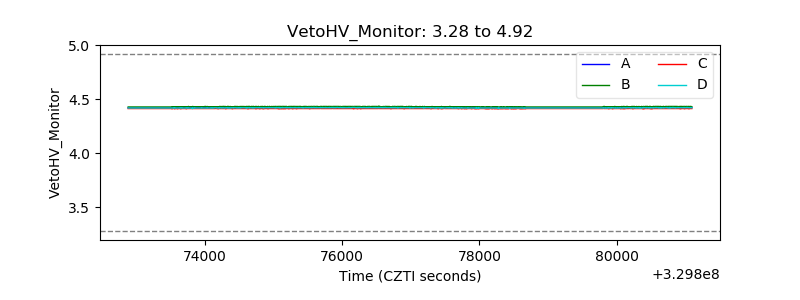 |
| Veto LLD | 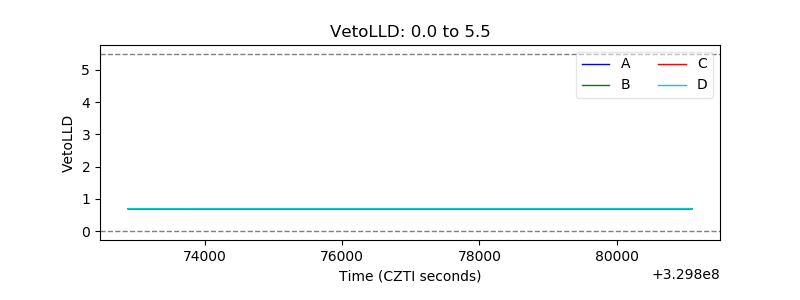 |
| Alpha Counter |  |
| _CPM_Rate | 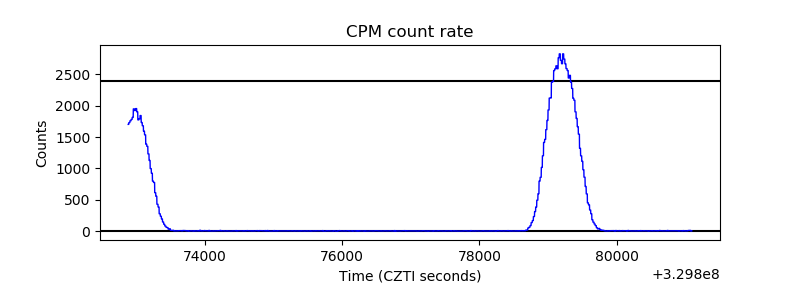 |
| CZT Counter | 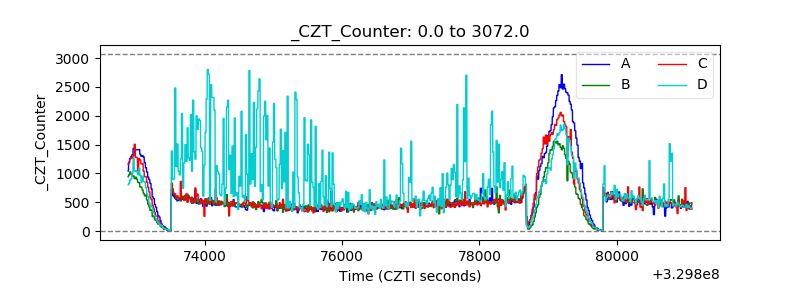 |
| +2.5 Volts monitor | 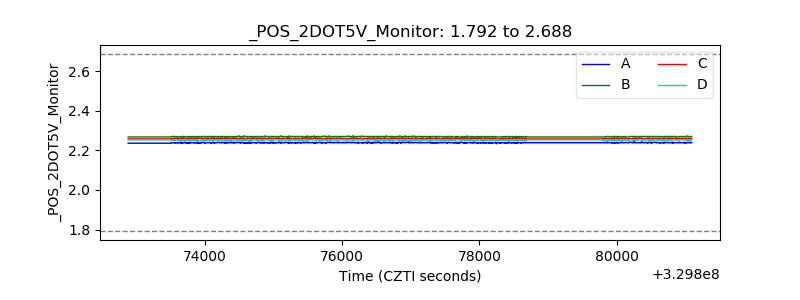 |
| +5 Volts monitor |  |
| _ROLL_ROT | 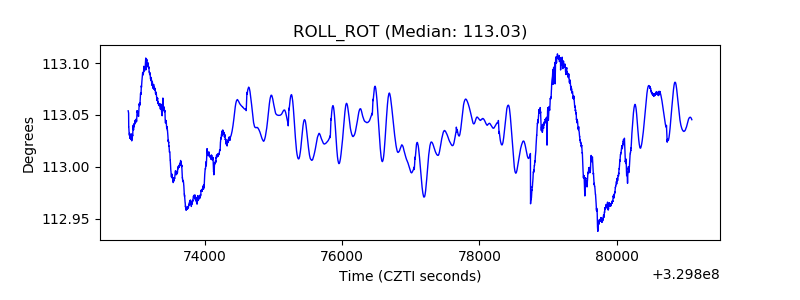 |
| _Roll_DEC | 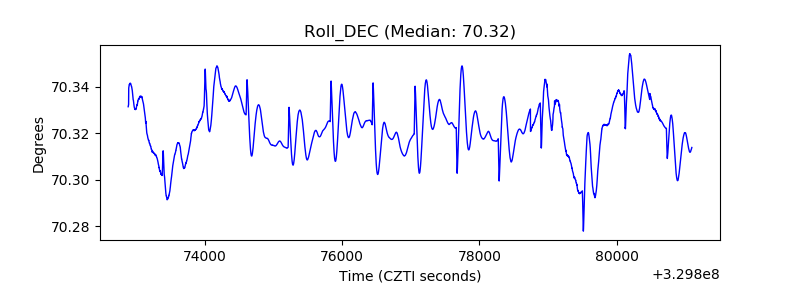 |
| _Roll_RA | 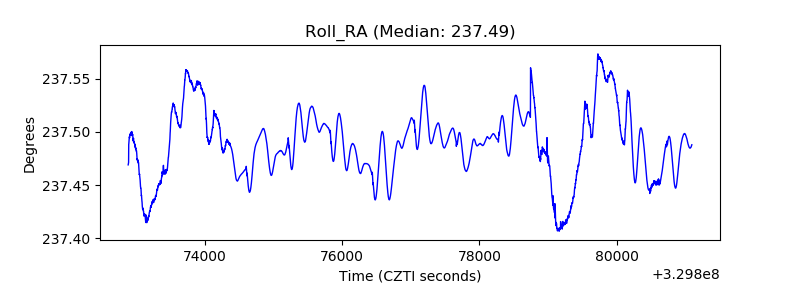 |
| Veto Counter | 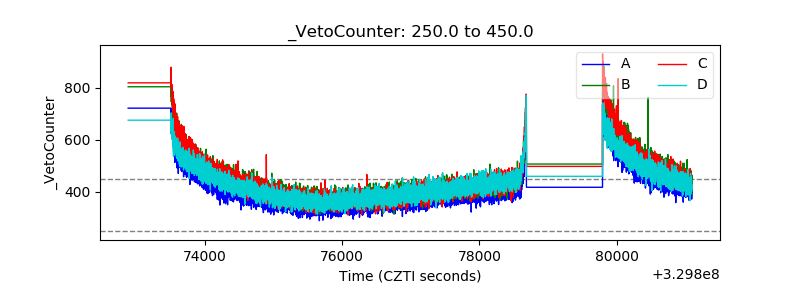 |