| Param | Original file | Final file |
|---|---|---|
| Filename | modeM0/AS1C05_012T07_9000003718_25488cztM0_level2.evt | modeM0/AS1C05_012T07_9000003718_25488cztM0_level2_quad_clean.evt |
| Size (bytes) | 473,664,960 | 135,221,760 |
| Size | 451.7 MB | 129.0 MB |
| Events in quadrant A | 3,128,242 | 933,023 |
| Events in quadrant B | 3,338,444 | 950,917 |
| Events in quadrant C | 3,159,973 | 896,640 |
| Events in quadrant D | 4,275,238 | 860,450 |
| Mode M9 | |||
|---|---|---|---|
| Quadrant | BADHDUFLAG | Total packets | Discarded packets |
| A | 0 | 18 | 0 |
| B | 0 | 19 | 0 |
| C | 0 | 19 | 0 |
| D | 0 | 19 | 0 |
| Mode M0 | |||
|---|---|---|---|
| Quadrant | BADHDUFLAG | Total packets | Discarded packets |
| A | 0 | 13439 | 0 |
| B | 0 | 14184 | 0 |
| C | 0 | 13554 | 0 |
| D | 0 | 17069 | 0 |
| Quadrant | Total seconds | Saturated seconds | Saturation percentage |
|---|---|---|---|
| A | 6530 | 26 | 0.398162% |
| B | 6530 | 40 | 0.612557% |
| C | 6530 | 65 | 0.995406% |
| D | 6530 | 242 | 3.705972% |
Noise dominated data is calculated using 1-second bins in cleaned event files. If a bin has >2000 counts, and if more than 50% of those come from <1% of pixels, then it is considered to be noise-dominated and hence unusable.
| Quadrant | # 1 sec bins | Bins with >0 counts | Bins with >2000 counts | High rate bins dominated by noise | Noise dominated (total time) | Noise dominated (detector-on time) | Marked lightcurve |
|---|---|---|---|---|---|---|---|
| A | 7770 | 6531 | 0 | 0 | 0.00% | 0.00% | 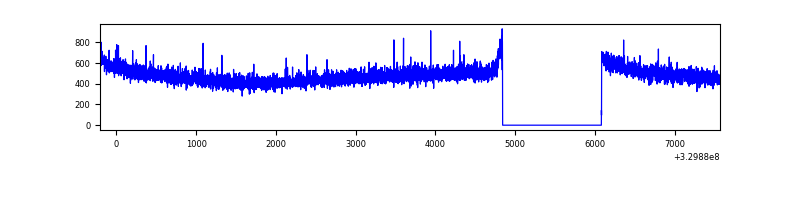 |
| B | 7770 | 6531 | 0 | 0 | 0.00% | 0.00% | 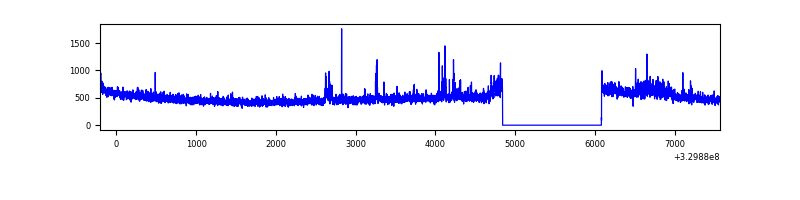 |
| C | 7770 | 6531 | 0 | 0 | 0.00% | 0.00% | 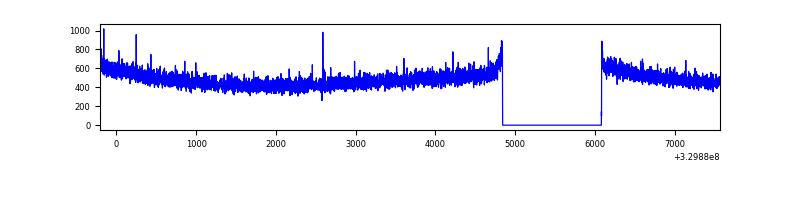 |
| D | 7770 | 6531 | 198 | 198 | 2.55% | 3.03% | 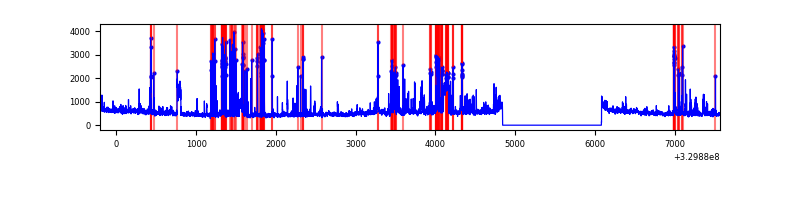 |
Top three noisy pixels from each quadrant. If the there are fewer than three noisy pixels in the level2.evt file, extra rows are filled as -1
| Pixel properties | Quadrant properties | ||||||
|---|---|---|---|---|---|---|---|
| Quadrant | DetID | PixID | Counts | Sigma | Mean | Median | Sigma |
| A | 13 | 254 | 9457 | 53.4 | 811 | 794 | 162.2 |
| A | 3 | 137 | 7083 | 38.77 | 811 | 794 | 162.2 |
| A | 0 | 226 | 6898 | 37.63 | 811 | 794 | 162.2 |
| B | 3 | 112 | 105383 | 694.22 | 812 | 793 | 150.7 |
| B | 3 | 64 | 24610 | 158.09 | 812 | 793 | 150.7 |
| B | 0 | 190 | 23669 | 151.84 | 812 | 793 | 150.7 |
| C | 14 | 238 | 127312 | 707.0 | 775 | 778 | 179.0 |
| C | 3 | 233 | 7878 | 39.67 | 775 | 778 | 179.0 |
| C | 13 | 61 | 5331 | 25.44 | 775 | 778 | 179.0 |
| D | 1 | 52 | 996003 | 5404.1 | 767 | 745 | 184.2 |
| D | 8 | 195 | 170899 | 923.91 | 767 | 745 | 184.2 |
| D | 12 | 233 | 75865 | 407.89 | 767 | 745 | 184.2 |
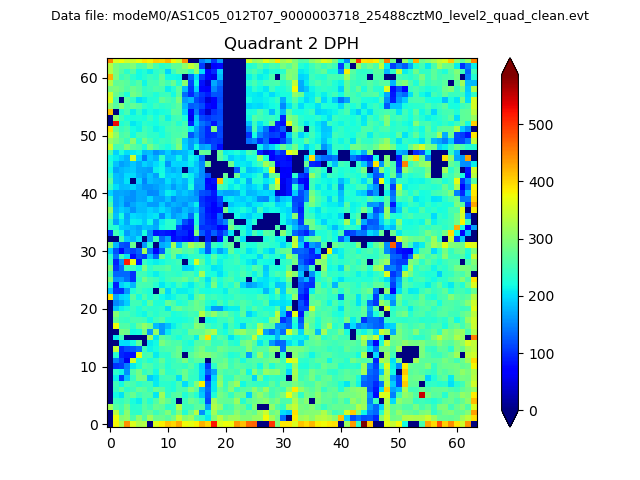
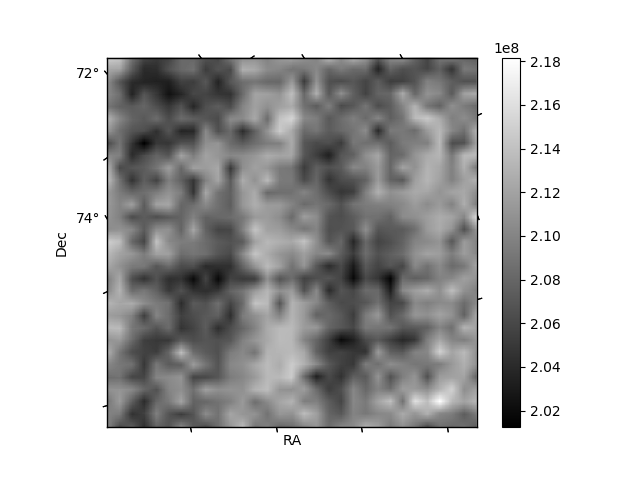
Histogram calculated using DETX and DETY for each event in the final _common_clean file
| Quadrant A | 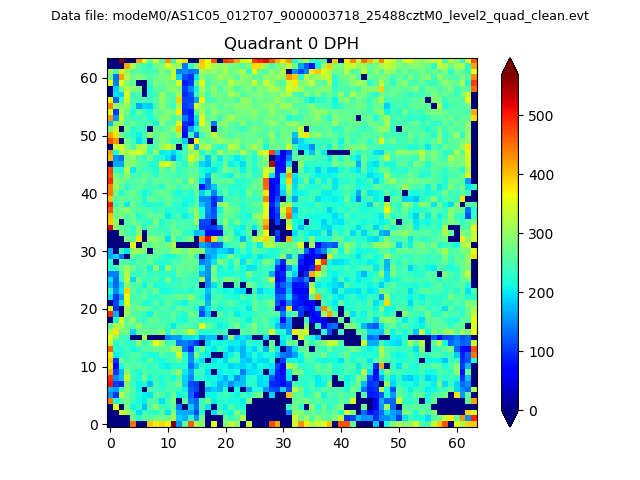 |
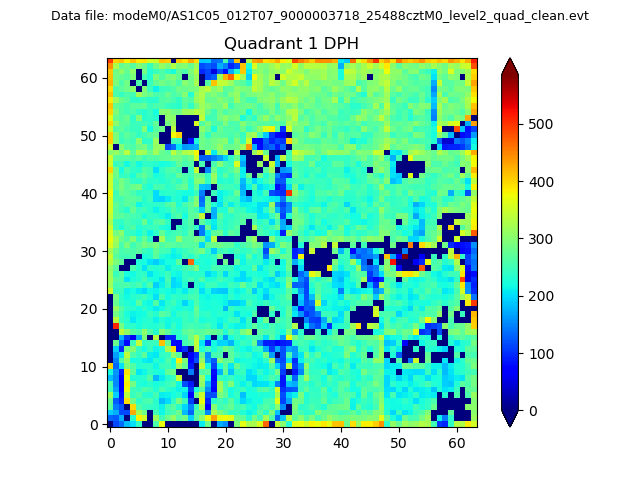 |
Quadrant B |
|---|---|---|---|
| Quadrant D | 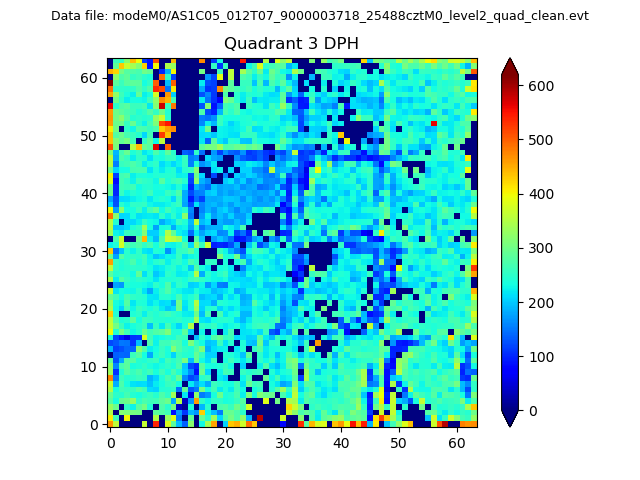 |
 |
Quadrant C |
| Plot type | Count rate plots | Images |
|---|---|---|
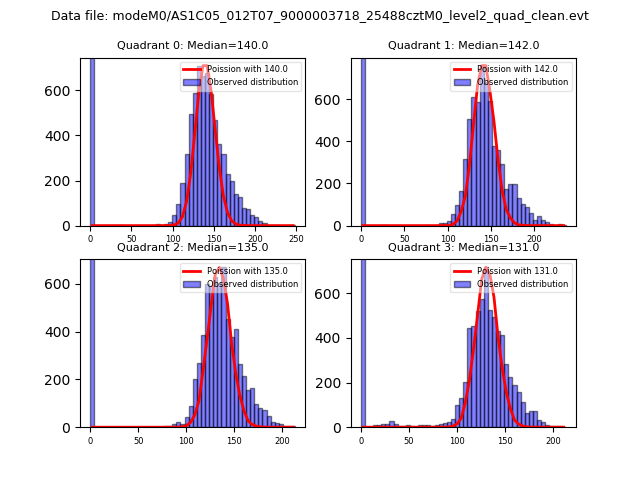
| Comparison with Poisson distribution Blue bars denote a histogram of data divided into 1 sec bins. Red curve is a Poisson curve with rate = median count rate of data. |
 |
 |
| Quadrant-wise count rates Data is divided into 100 sec bins |
 |
|
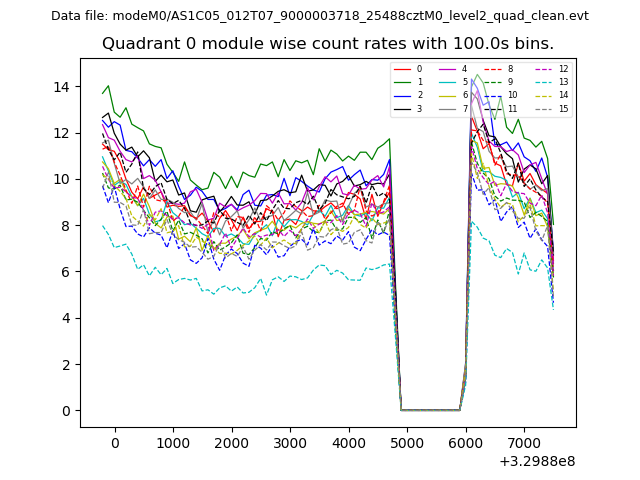
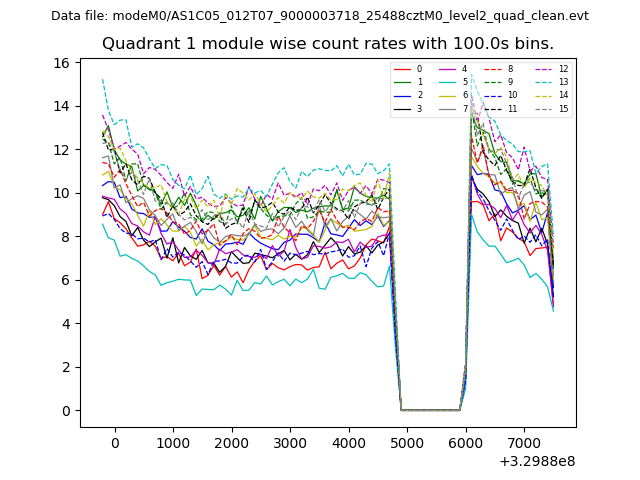
| Module-wise count rates for Quadrant A Data is divided into 100 sec bins |
 |
 |
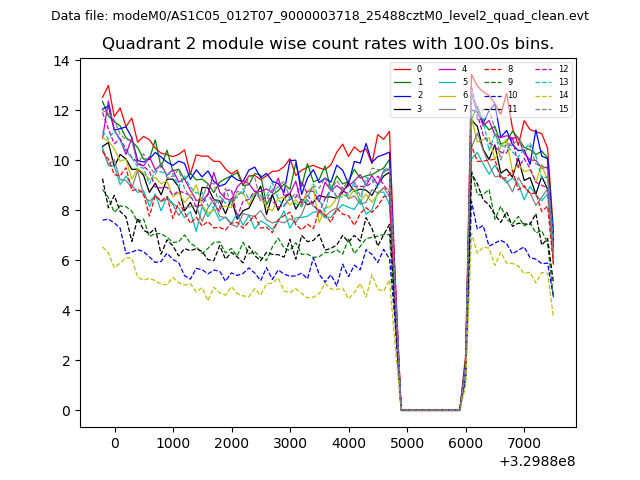
| Module-wise count rates for Quadrant B Data is divided into 100 sec bins |
 |
 |
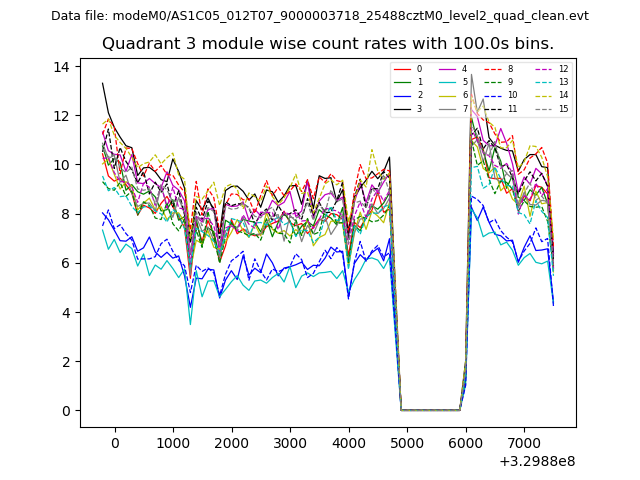
| Module-wise count rates for Quadrant C Data is divided into 100 sec bins |
 |
 |
| Module-wise count rates for Quadrant D Data is divided into 100 sec bins |
 |
 |
| Parameter | Plot |
|---|---|
| CZT HV Monitor | 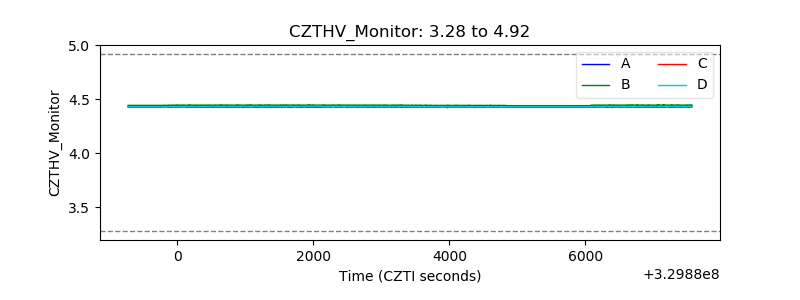 |
| D_VDD | 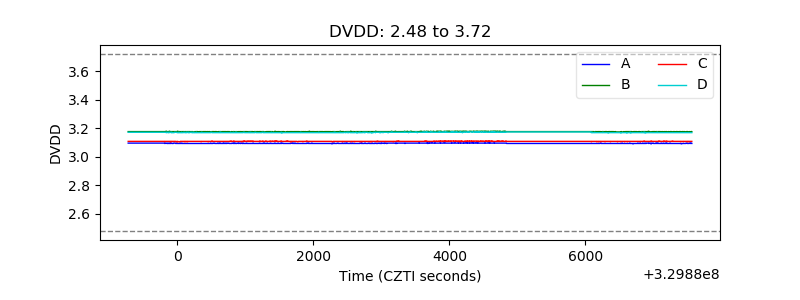 |
| Temperature 1 | 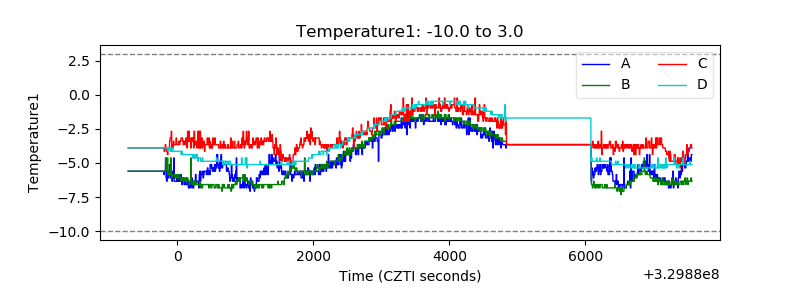 |
| Veto HV Monitor |  |
| Veto LLD |  |
| Alpha Counter |  |
| _CPM_Rate | 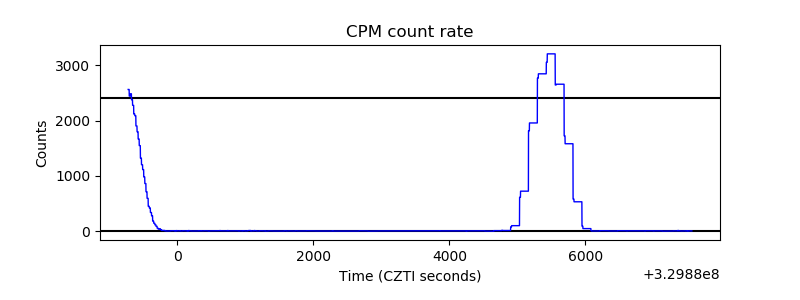 |
| CZT Counter | 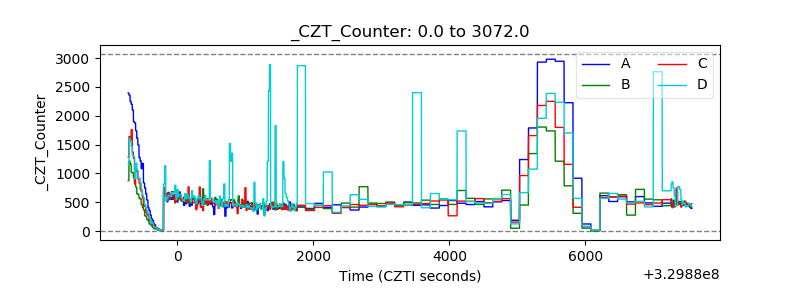 |
| +2.5 Volts monitor |  |
| +5 Volts monitor | 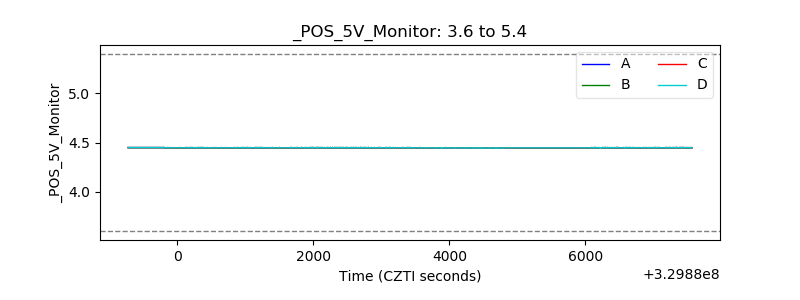 |
| _ROLL_ROT | 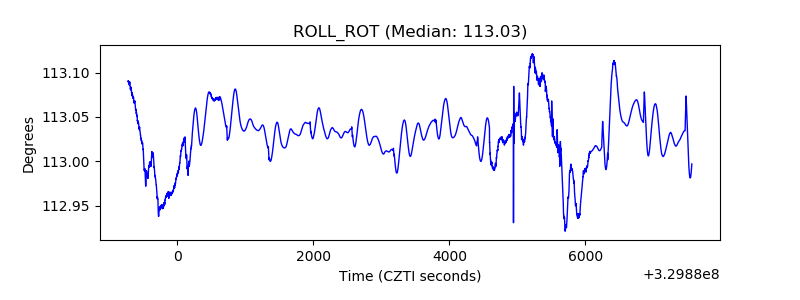 |
| _Roll_DEC | 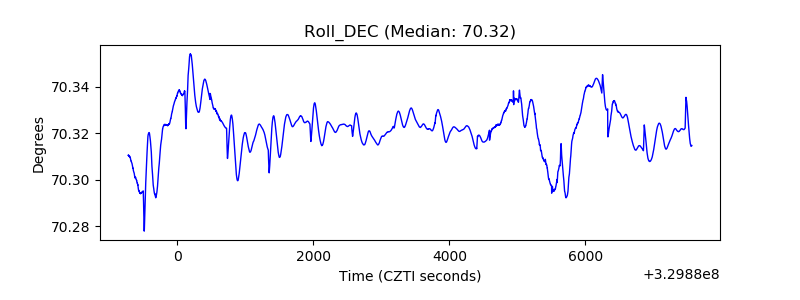 |
| _Roll_RA |  |
| Veto Counter | 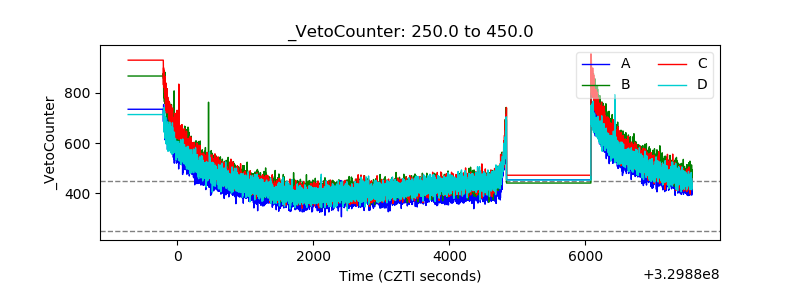 |