| Param | Original file | Final file |
|---|---|---|
| Filename | modeM0/AS1C05_012T07_9000003718_25489cztM0_level2.evt | modeM0/AS1C05_012T07_9000003718_25489cztM0_level2_quad_clean.evt |
| Size (bytes) | 458,337,600 | 137,747,520 |
| Size | 437.1 MB | 131.4 MB |
| Events in quadrant A | 3,162,749 | 956,395 |
| Events in quadrant B | 3,377,735 | 975,210 |
| Events in quadrant C | 3,151,606 | 908,823 |
| Events in quadrant D | 3,756,949 | 888,503 |
| Mode M9 | |||
|---|---|---|---|
| Quadrant | BADHDUFLAG | Total packets | Discarded packets |
| A | 0 | 15 | 0 |
| B | 0 | 16 | 0 |
| C | 0 | 16 | 0 |
| D | 0 | 16 | 0 |
| Mode M0 | |||
|---|---|---|---|
| Quadrant | BADHDUFLAG | Total packets | Discarded packets |
| A | 0 | 13247 | 0 |
| B | 0 | 14049 | 0 |
| C | 0 | 13273 | 0 |
| D | 0 | 15172 | 0 |
| Quadrant | Total seconds | Saturated seconds | Saturation percentage |
|---|---|---|---|
| A | 6360 | 17 | 0.267296% |
| B | 6359 | 29 | 0.456047% |
| C | 6359 | 56 | 0.880642% |
| D | 6359 | 63 | 0.990722% |
Noise dominated data is calculated using 1-second bins in cleaned event files. If a bin has >2000 counts, and if more than 50% of those come from <1% of pixels, then it is considered to be noise-dominated and hence unusable.
| Quadrant | # 1 sec bins | Bins with >0 counts | Bins with >2000 counts | High rate bins dominated by noise | Noise dominated (total time) | Noise dominated (detector-on time) | Marked lightcurve |
|---|---|---|---|---|---|---|---|
| A | 7690 | 6361 | 0 | 0 | 0.00% | 0.00% | 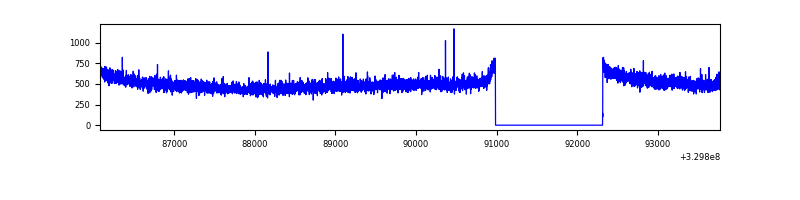 |
| B | 7689 | 6360 | 0 | 0 | 0.00% | 0.00% | 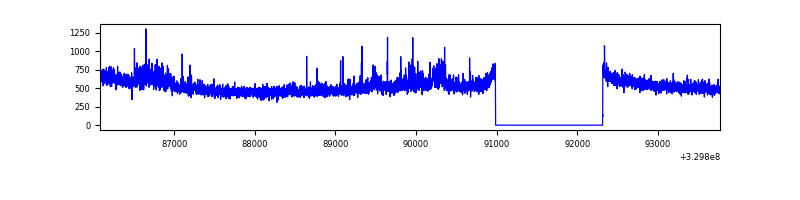 |
| C | 7689 | 6360 | 0 | 0 | 0.00% | 0.00% | 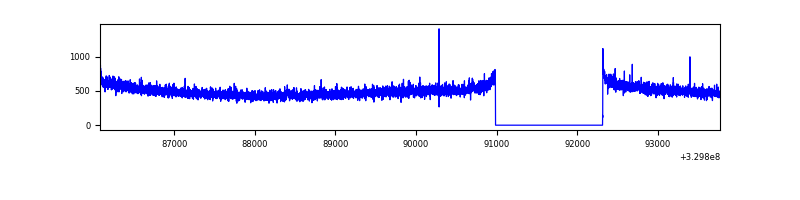 |
| D | 7689 | 6360 | 44 | 44 | 0.57% | 0.69% | 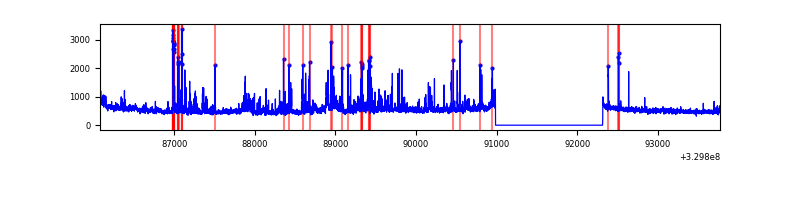 |
Top three noisy pixels from each quadrant. If the there are fewer than three noisy pixels in the level2.evt file, extra rows are filled as -1
| Pixel properties | Quadrant properties | ||||||
|---|---|---|---|---|---|---|---|
| Quadrant | DetID | PixID | Counts | Sigma | Mean | Median | Sigma |
| A | 13 | 254 | 9346 | 53.28 | 819 | 807 | 160.3 |
| A | 0 | 226 | 7276 | 40.36 | 819 | 807 | 160.3 |
| A | 3 | 137 | 6853 | 37.72 | 819 | 807 | 160.3 |
| B | 3 | 112 | 164475 | 1090.82 | 813 | 794 | 150.1 |
| B | 12 | 111 | 17556 | 111.71 | 813 | 794 | 150.1 |
| B | 11 | 111 | 15616 | 98.78 | 813 | 794 | 150.1 |
| C | 14 | 238 | 128779 | 721.71 | 772 | 778 | 177.4 |
| C | 3 | 233 | 7604 | 38.49 | 772 | 778 | 177.4 |
| C | 13 | 61 | 5453 | 26.36 | 772 | 778 | 177.4 |
| D | 1 | 52 | 469098 | 2534.27 | 778 | 757 | 184.8 |
| D | 8 | 195 | 203982 | 1099.68 | 778 | 757 | 184.8 |
| D | 7 | 238 | 62747 | 335.44 | 778 | 757 | 184.8 |
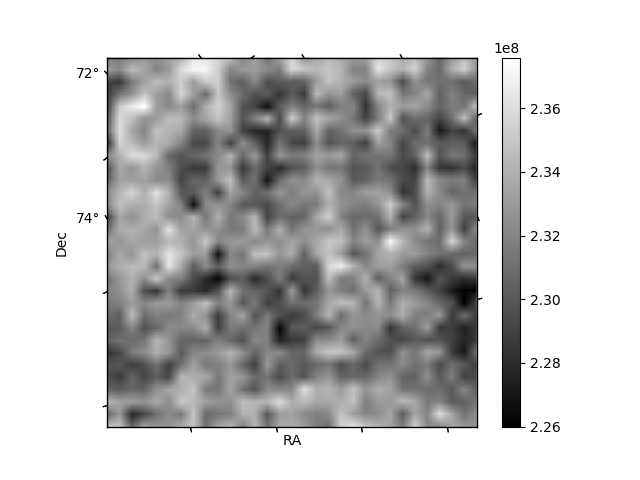
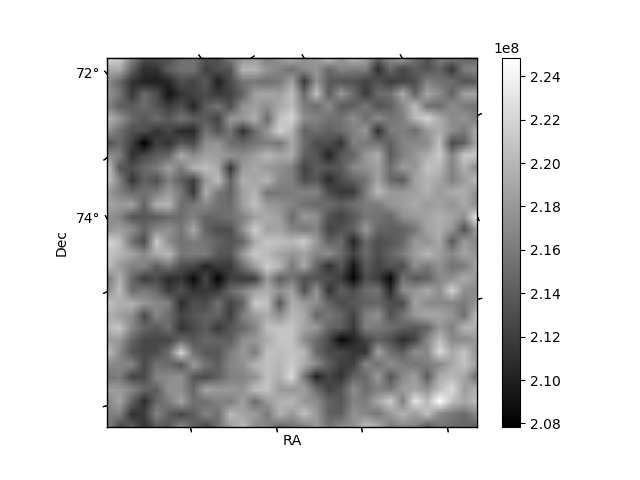
Histogram calculated using DETX and DETY for each event in the final _common_clean file
| Quadrant A | 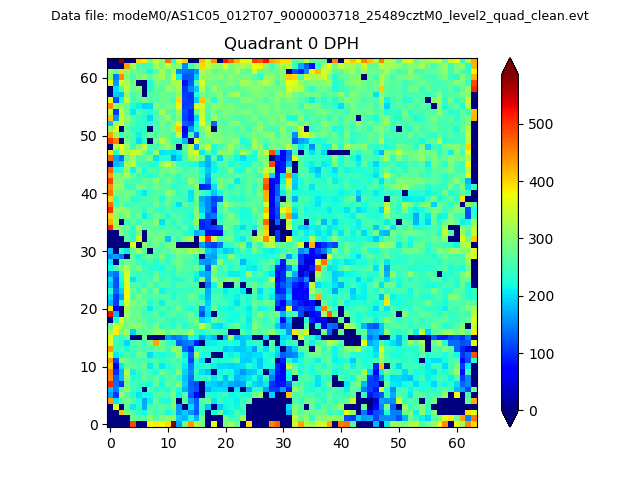 |
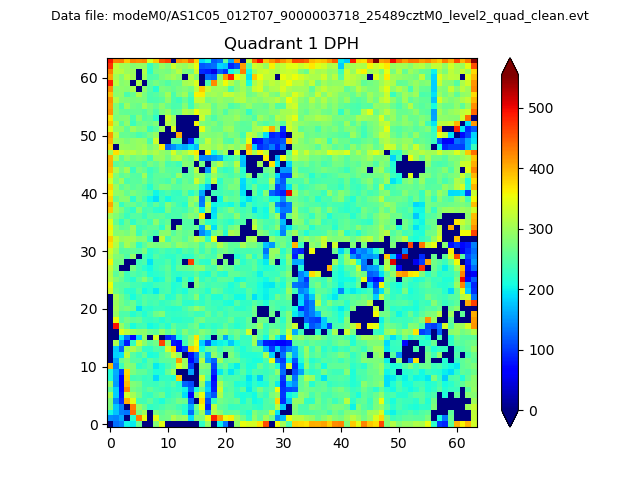 |
Quadrant B |
|---|---|---|---|
| Quadrant D | 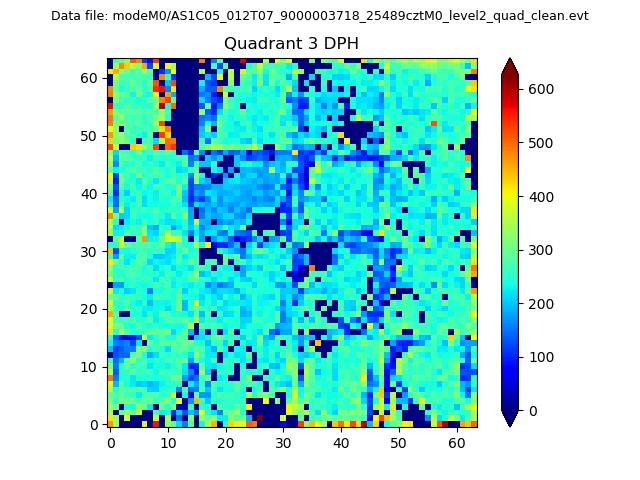 |
 |
Quadrant C |
| Plot type | Count rate plots | Images |
|---|---|---|
| Comparison with Poisson distribution Blue bars denote a histogram of data divided into 1 sec bins. Red curve is a Poisson curve with rate = median count rate of data. |
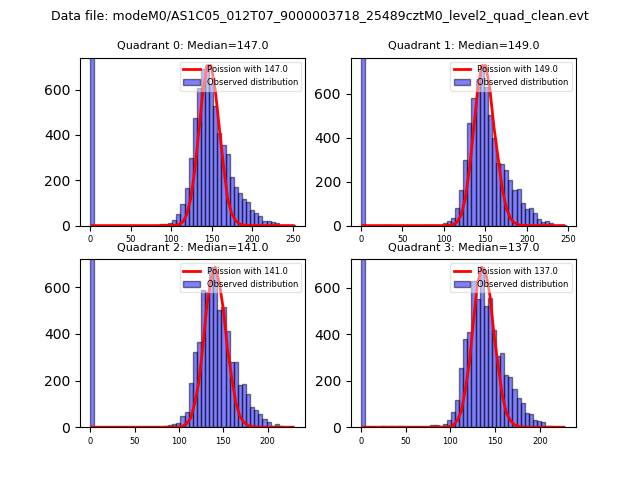 |
 |
| Quadrant-wise count rates Data is divided into 100 sec bins |
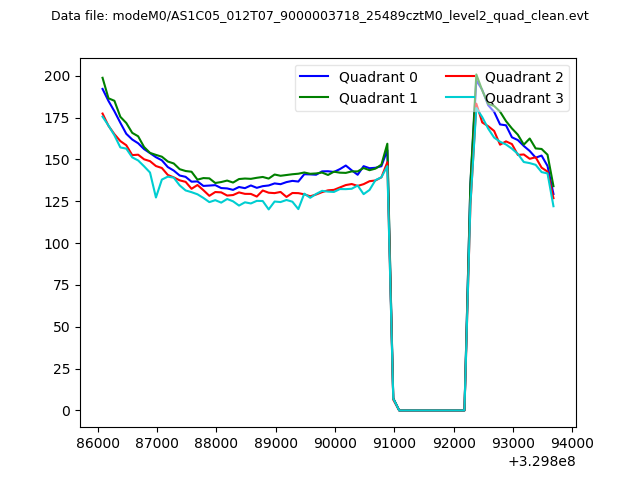 |
|
| Module-wise count rates for Quadrant A Data is divided into 100 sec bins |
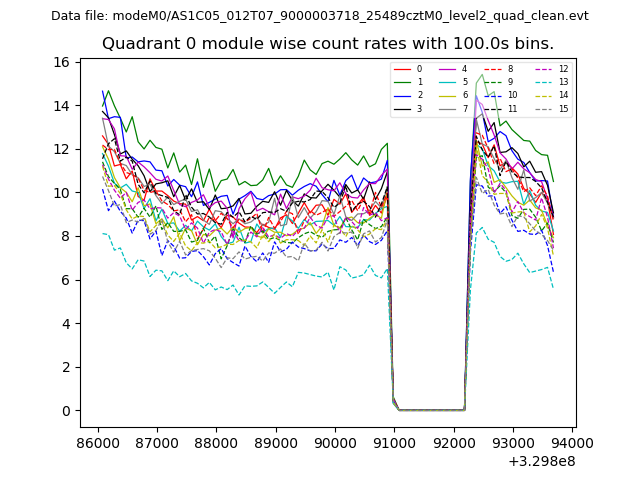 |
 |
| Module-wise count rates for Quadrant B Data is divided into 100 sec bins |
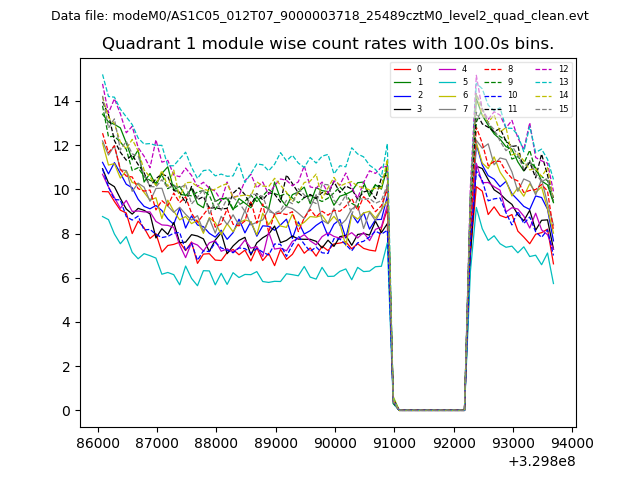 |
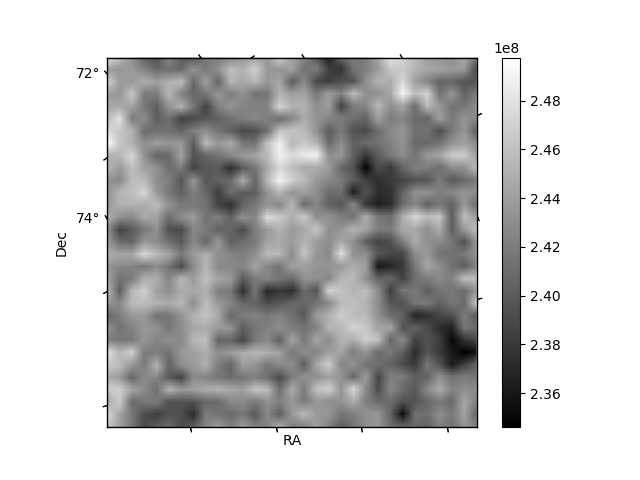 |
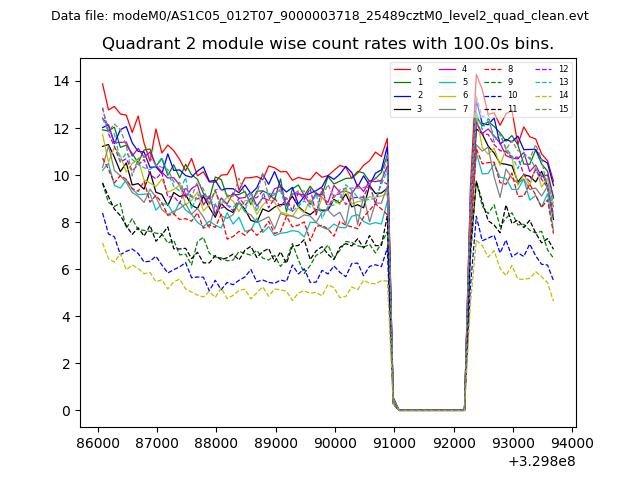
| Module-wise count rates for Quadrant C Data is divided into 100 sec bins |
 |
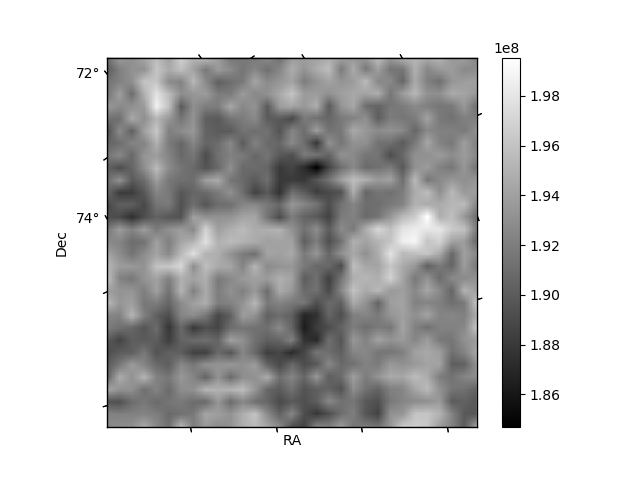 |
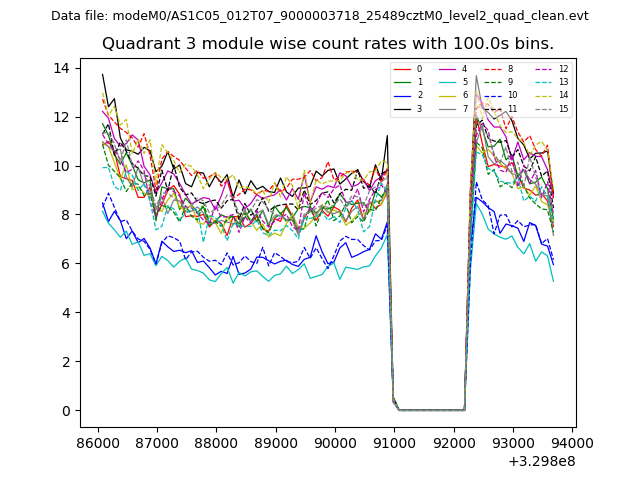
| Module-wise count rates for Quadrant D Data is divided into 100 sec bins |
 |
 |
| Parameter | Plot |
|---|---|
| CZT HV Monitor | 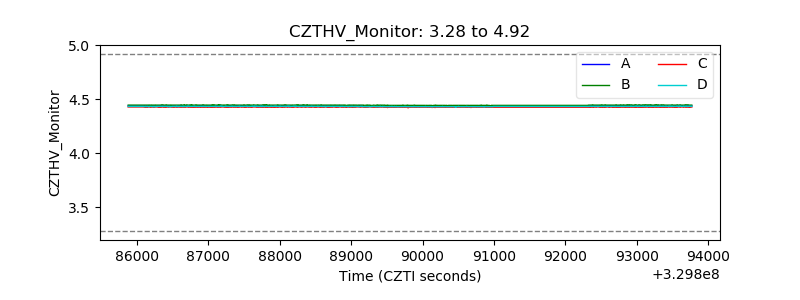 |
| D_VDD | 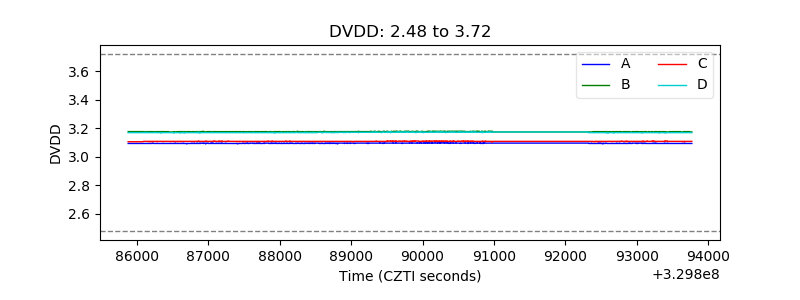 |
| Temperature 1 |  |
| Veto HV Monitor | 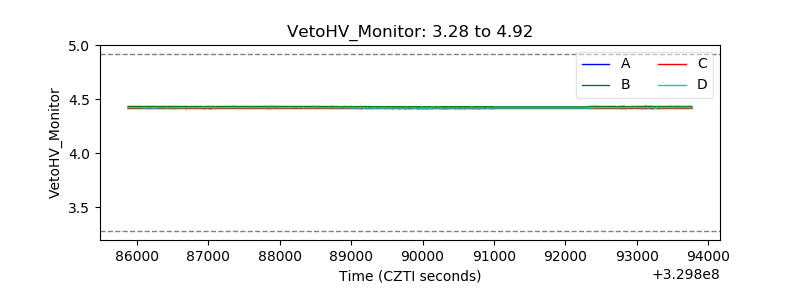 |
| Veto LLD | 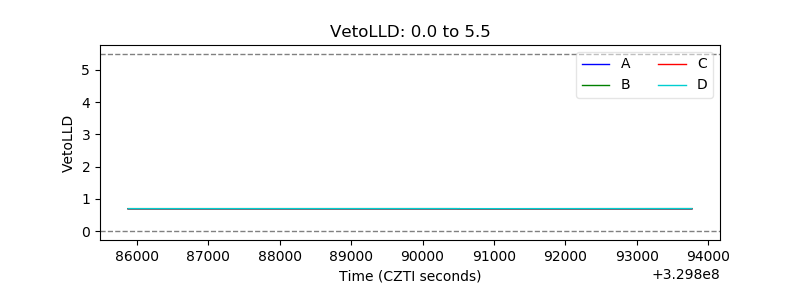 |
| Alpha Counter | 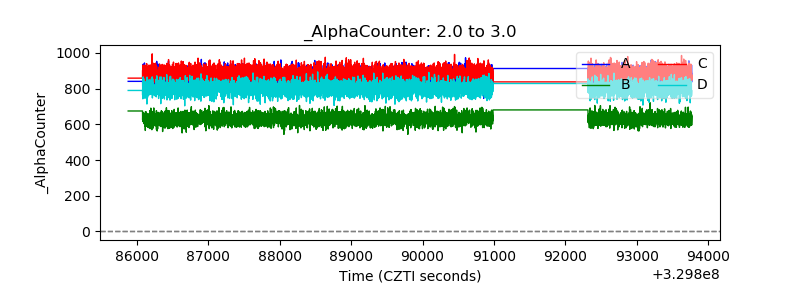 |
| _CPM_Rate | 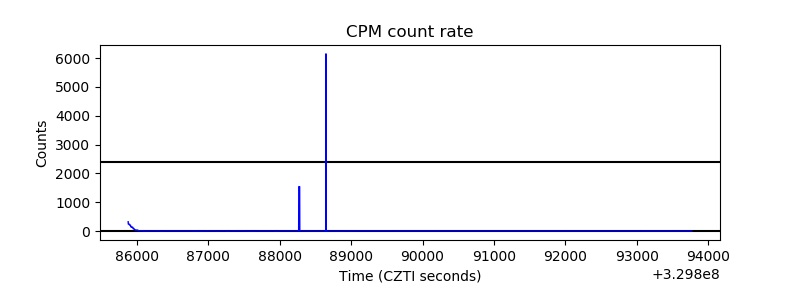 |
| CZT Counter |  |
| +2.5 Volts monitor |  |
| +5 Volts monitor |  |
| _ROLL_ROT | 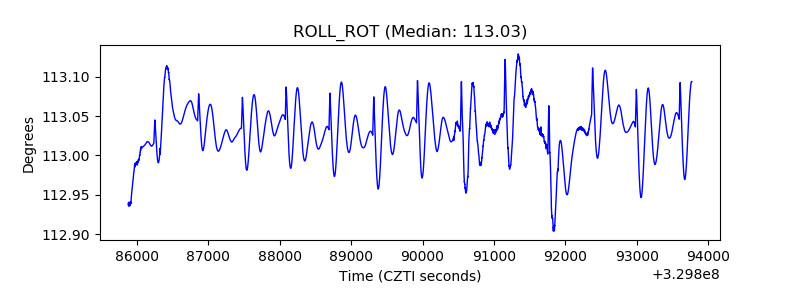 |
| _Roll_DEC | 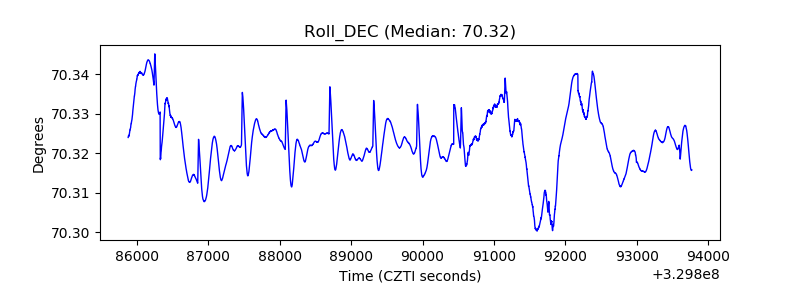 |
| _Roll_RA | 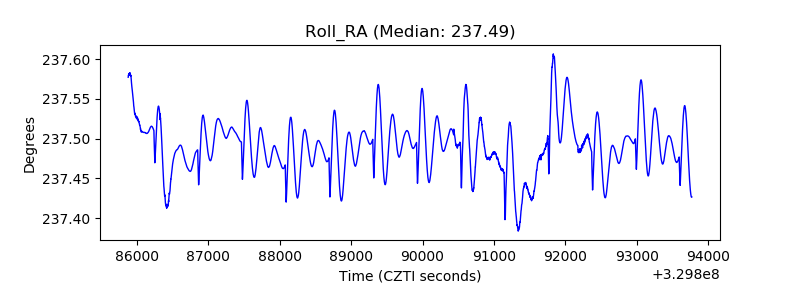 |
| Veto Counter | 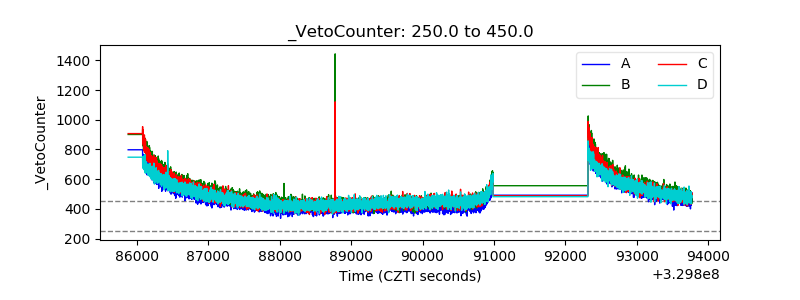 |