| Param | Original file | Final file |
|---|---|---|
| Filename | modeM0/AS1C05_012T07_9000003718_25490cztM0_level2.evt | modeM0/AS1C05_012T07_9000003718_25490cztM0_level2_quad_clean.evt |
| Size (bytes) | 434,306,880 | 133,257,600 |
| Size | 414.2 MB | 127.1 MB |
| Events in quadrant A | 3,079,958 | 928,956 |
| Events in quadrant B | 3,107,943 | 942,911 |
| Events in quadrant C | 3,054,507 | 877,045 |
| Events in quadrant D | 3,498,910 | 864,334 |
| Mode M9 | |||
|---|---|---|---|
| Quadrant | BADHDUFLAG | Total packets | Discarded packets |
| A | 0 | 13 | 0 |
| B | 0 | 13 | 0 |
| C | 0 | 13 | 0 |
| D | 0 | 13 | 0 |
| Mode M0 | |||
|---|---|---|---|
| Quadrant | BADHDUFLAG | Total packets | Discarded packets |
| A | 0 | 12681 | 0 |
| B | 0 | 12757 | 0 |
| C | 0 | 12682 | 0 |
| D | 0 | 14027 | 0 |
| Quadrant | Total seconds | Saturated seconds | Saturation percentage |
|---|---|---|---|
| A | 6054 | 75 | 1.238850% |
| B | 6055 | 87 | 1.436829% |
| C | 6054 | 106 | 1.750908% |
| D | 6054 | 135 | 2.229931% |
Noise dominated data is calculated using 1-second bins in cleaned event files. If a bin has >2000 counts, and if more than 50% of those come from <1% of pixels, then it is considered to be noise-dominated and hence unusable.
| Quadrant | # 1 sec bins | Bins with >0 counts | Bins with >2000 counts | High rate bins dominated by noise | Noise dominated (total time) | Noise dominated (detector-on time) | Marked lightcurve |
|---|---|---|---|---|---|---|---|
| A | 7369 | 6055 | 0 | 0 | 0.00% | 0.00% | 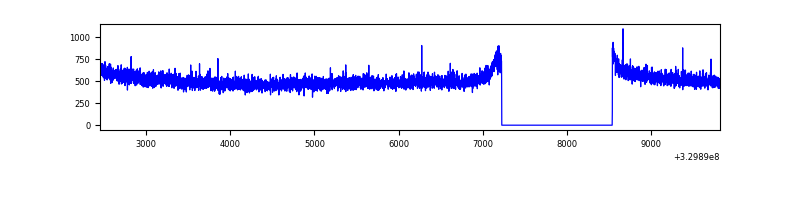 |
| B | 7370 | 6056 | 0 | 0 | 0.00% | 0.00% | 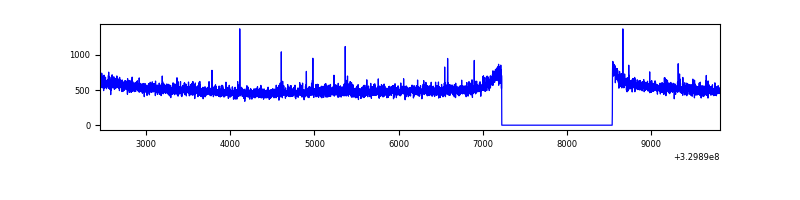 |
| C | 7369 | 6055 | 0 | 0 | 0.00% | 0.00% | 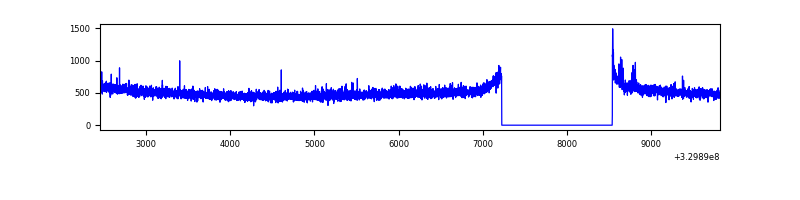 |
| D | 7369 | 6055 | 71 | 71 | 0.96% | 1.17% | 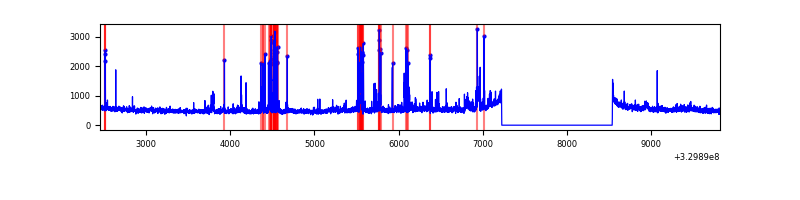 |
Top three noisy pixels from each quadrant. If the there are fewer than three noisy pixels in the level2.evt file, extra rows are filled as -1
| Pixel properties | Quadrant properties | ||||||
|---|---|---|---|---|---|---|---|
| Quadrant | DetID | PixID | Counts | Sigma | Mean | Median | Sigma |
| A | 13 | 254 | 8966 | 51.94 | 799 | 786 | 157.5 |
| A | 0 | 226 | 7013 | 39.54 | 799 | 786 | 157.5 |
| A | 3 | 137 | 6617 | 37.02 | 799 | 786 | 157.5 |
| B | 0 | 229 | 19286 | 128.35 | 788 | 771 | 144.3 |
| B | 12 | 111 | 16968 | 112.28 | 788 | 771 | 144.3 |
| B | 11 | 111 | 15160 | 99.75 | 788 | 771 | 144.3 |
| C | 14 | 238 | 123455 | 719.43 | 745 | 750 | 170.6 |
| C | 0 | 239 | 14269 | 79.26 | 745 | 750 | 170.6 |
| C | 0 | 10 | 8233 | 43.87 | 745 | 750 | 170.6 |
| D | 2 | 244 | 261622 | 1435.94 | 759 | 736 | 181.7 |
| D | 8 | 195 | 215665 | 1182.99 | 759 | 736 | 181.7 |
| D | 1 | 52 | 67275 | 366.24 | 759 | 736 | 181.7 |
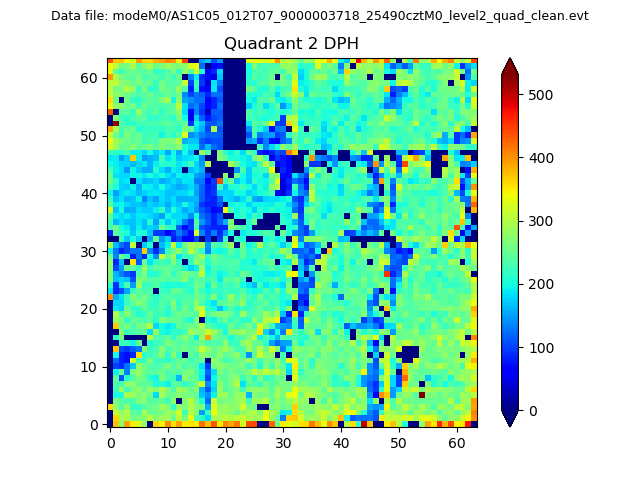
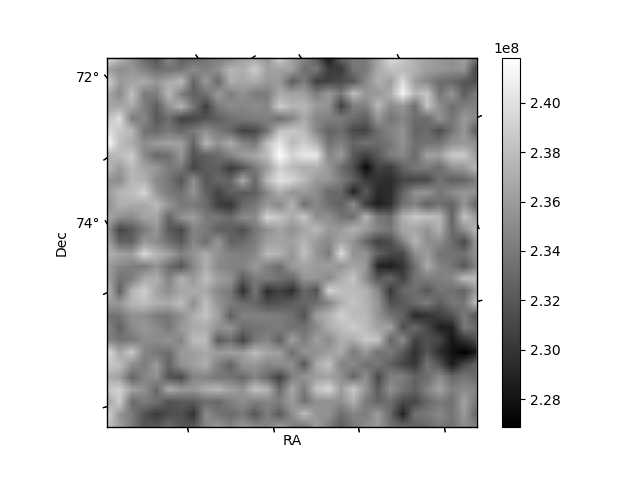
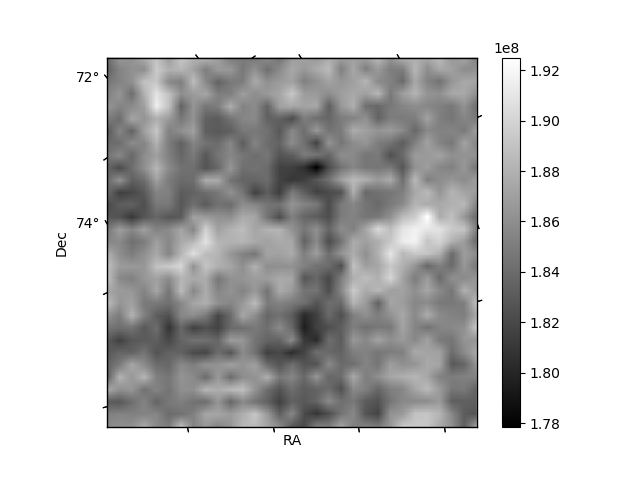
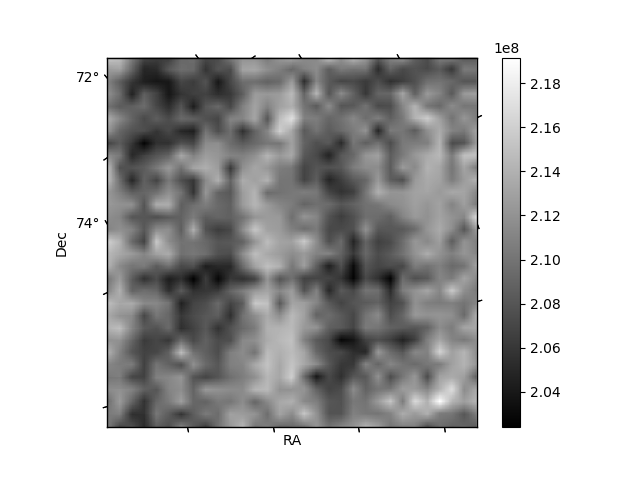
Histogram calculated using DETX and DETY for each event in the final _common_clean file
| Quadrant A | 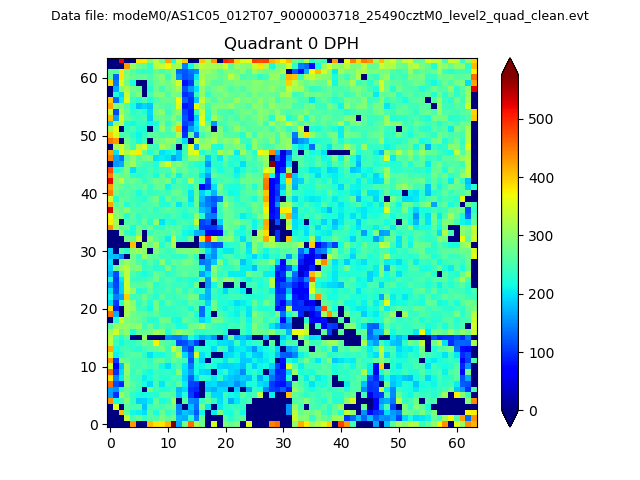 |
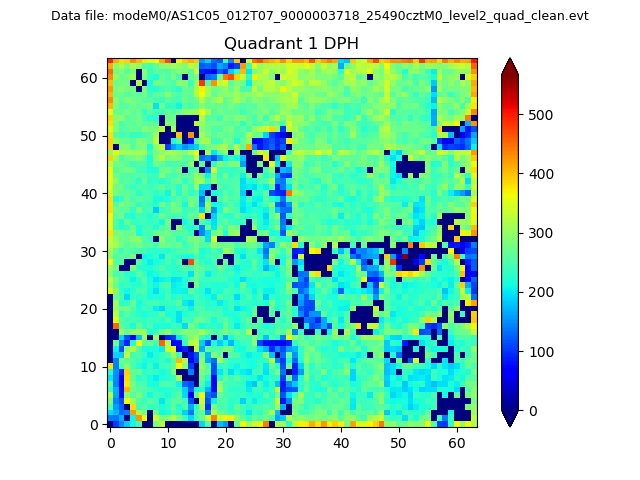 |
Quadrant B |
|---|---|---|---|
| Quadrant D | 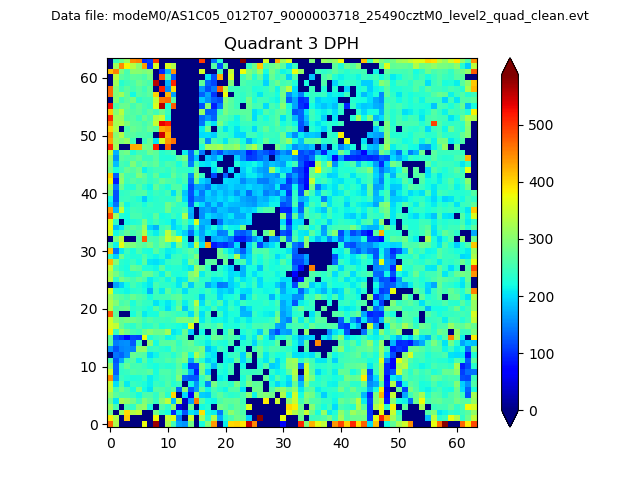 |
 |
Quadrant C |
| Plot type | Count rate plots | Images |
|---|---|---|
| Comparison with Poisson distribution Blue bars denote a histogram of data divided into 1 sec bins. Red curve is a Poisson curve with rate = median count rate of data. |
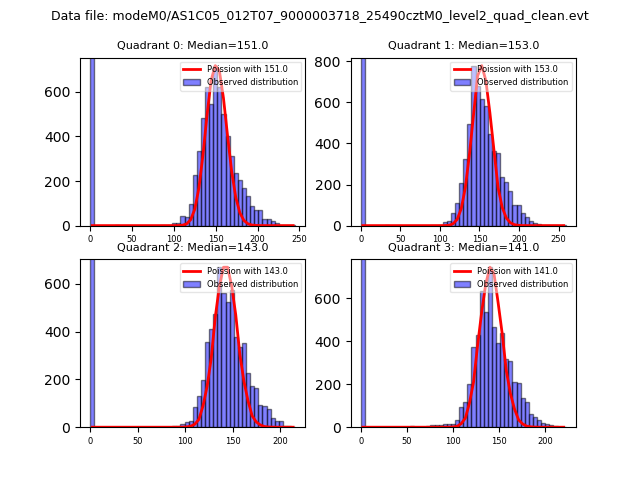 |
 |
| Quadrant-wise count rates Data is divided into 100 sec bins |
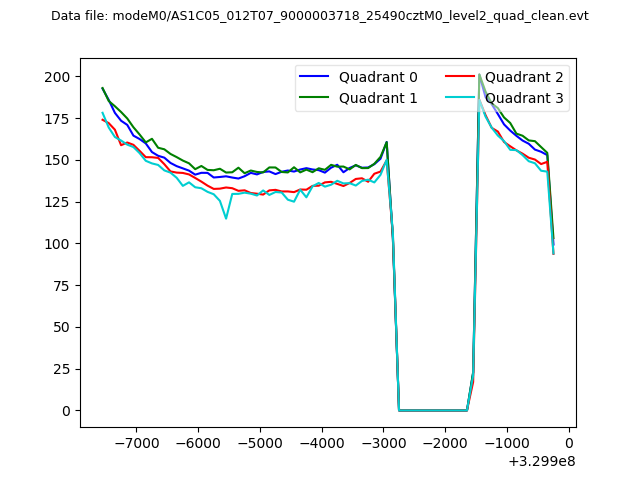 |
|
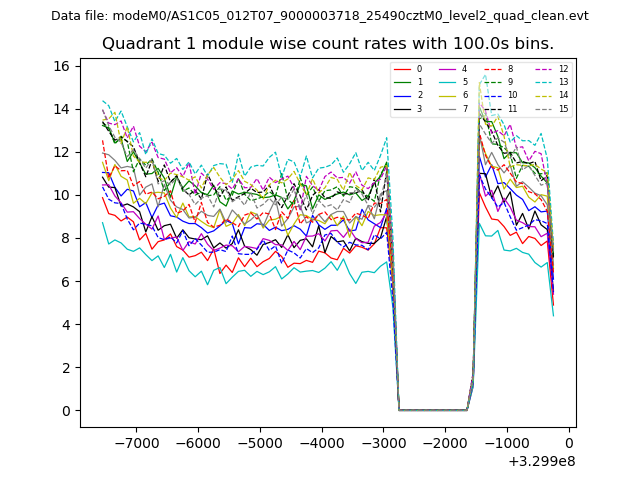
| Module-wise count rates for Quadrant A Data is divided into 100 sec bins |
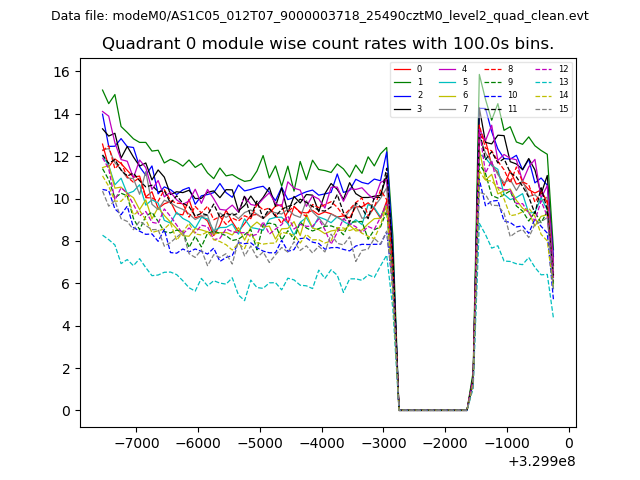 |
 |
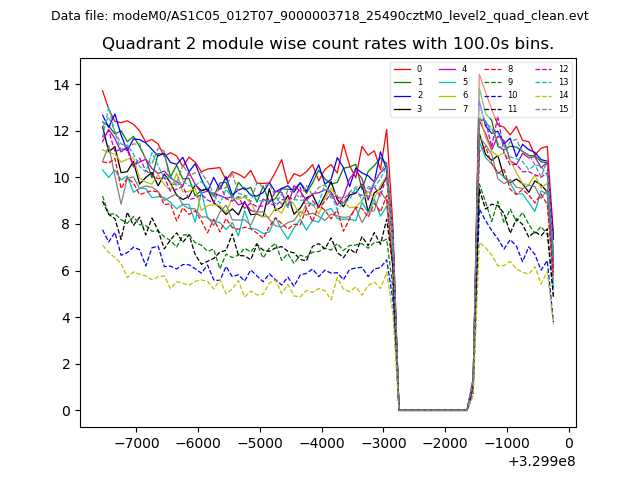
| Module-wise count rates for Quadrant B Data is divided into 100 sec bins |
 |
 |
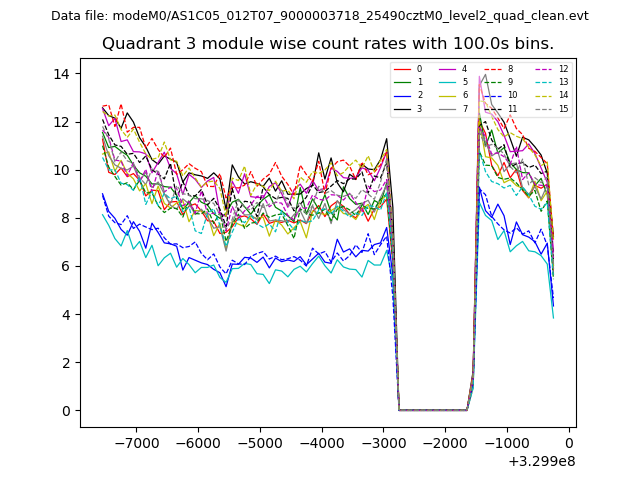
| Module-wise count rates for Quadrant C Data is divided into 100 sec bins |
 |
 |
| Module-wise count rates for Quadrant D Data is divided into 100 sec bins |
 |
 |
| Parameter | Plot |
|---|---|
| CZT HV Monitor | 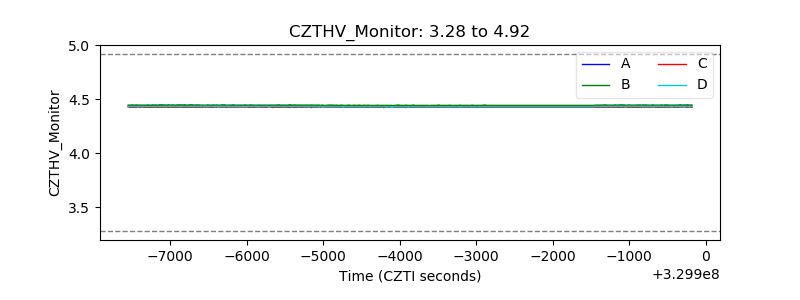 |
| D_VDD | 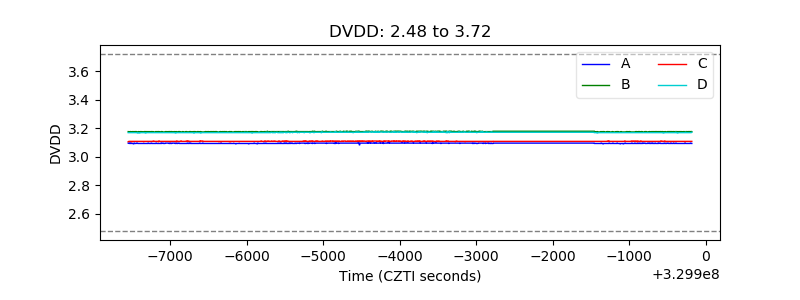 |
| Temperature 1 |  |
| Veto HV Monitor | 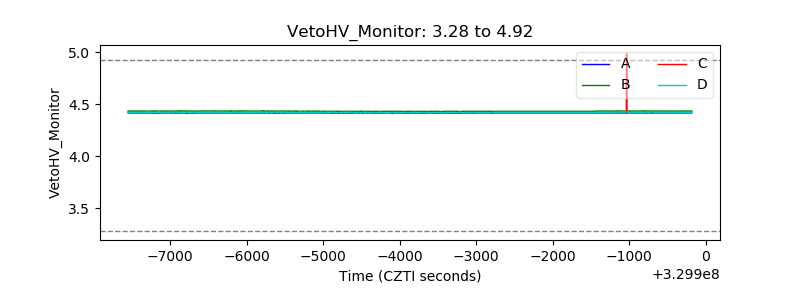 |
| Veto LLD | 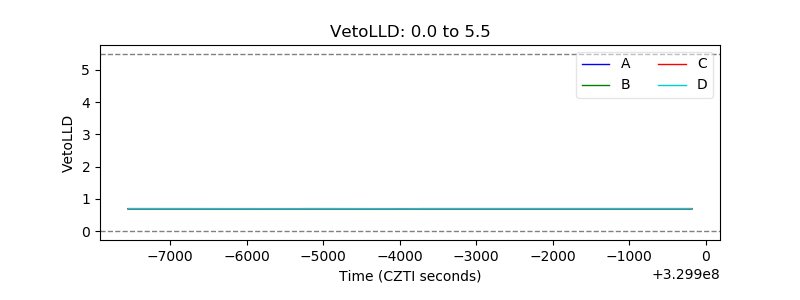 |
| Alpha Counter | 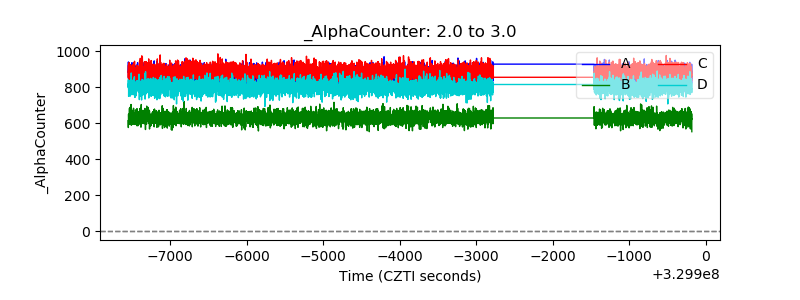 |
| _CPM_Rate | 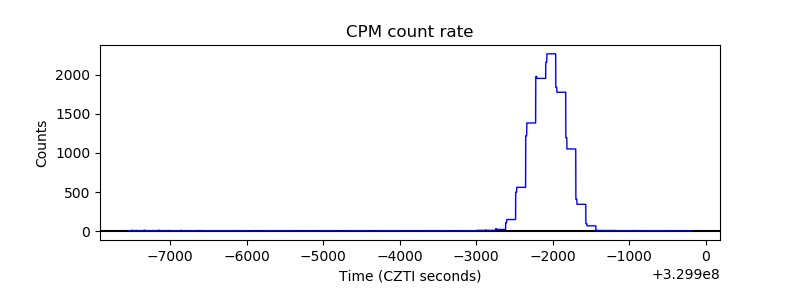 |
| CZT Counter |  |
| +2.5 Volts monitor |  |
| +5 Volts monitor |  |
| _ROLL_ROT | 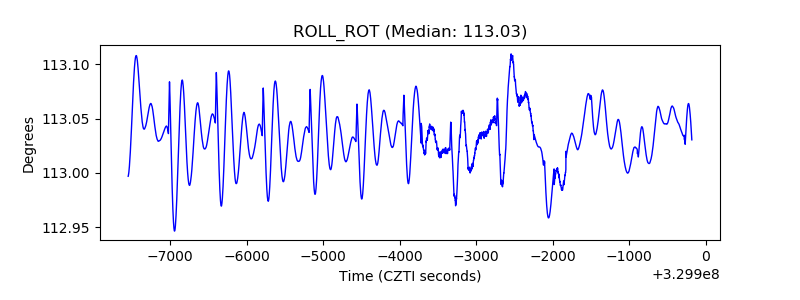 |
| _Roll_DEC | 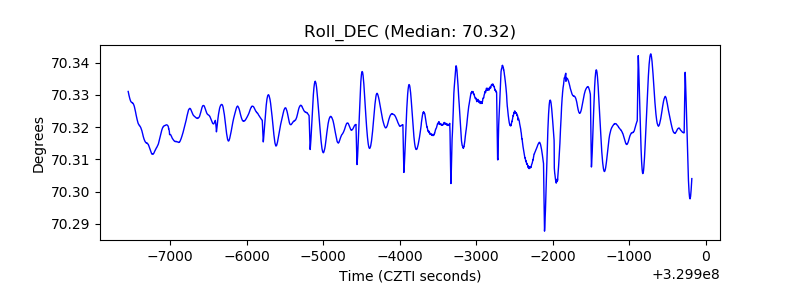 |
| _Roll_RA |  |
| Veto Counter | 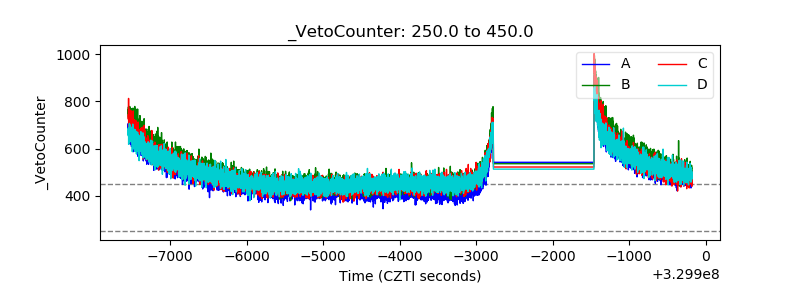 |