| Param | Original file | Final file |
|---|---|---|
| Filename | modeM0/AS1C05_012T07_9000003718_25491cztM0_level2.evt | modeM0/AS1C05_012T07_9000003718_25491cztM0_level2_quad_clean.evt |
| Size (bytes) | 461,347,200 | 135,169,920 |
| Size | 440.0 MB | 128.9 MB |
| Events in quadrant A | 3,165,108 | 943,466 |
| Events in quadrant B | 3,278,195 | 950,121 |
| Events in quadrant C | 3,128,172 | 888,477 |
| Events in quadrant D | 3,977,076 | 876,924 |
| Mode M9 | |||
|---|---|---|---|
| Quadrant | BADHDUFLAG | Total packets | Discarded packets |
| A | 0 | 13 | 0 |
| B | 0 | 13 | 0 |
| C | 0 | 13 | 0 |
| D | 0 | 13 | 0 |
| Mode M0 | |||
|---|---|---|---|
| Quadrant | BADHDUFLAG | Total packets | Discarded packets |
| A | 0 | 13010 | 0 |
| B | 0 | 13392 | 0 |
| C | 0 | 13024 | 0 |
| D | 0 | 15874 | 0 |
| Quadrant | Total seconds | Saturated seconds | Saturation percentage |
|---|---|---|---|
| A | 6238 | 77 | 1.234370% |
| B | 6239 | 130 | 2.083667% |
| C | 6239 | 109 | 1.747075% |
| D | 6239 | 89 | 1.426511% |
Noise dominated data is calculated using 1-second bins in cleaned event files. If a bin has >2000 counts, and if more than 50% of those come from <1% of pixels, then it is considered to be noise-dominated and hence unusable.
| Quadrant | # 1 sec bins | Bins with >0 counts | Bins with >2000 counts | High rate bins dominated by noise | Noise dominated (total time) | Noise dominated (detector-on time) | Marked lightcurve |
|---|---|---|---|---|---|---|---|
| A | 7533 | 6239 | 0 | 0 | 0.00% | 0.00% | 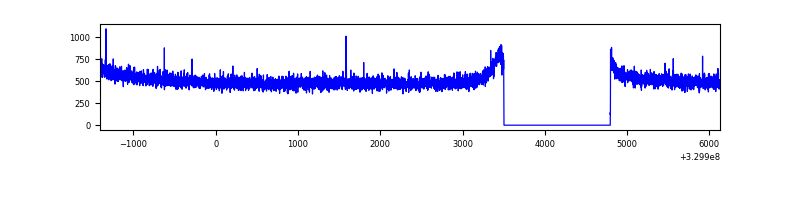 |
| B | 7534 | 6240 | 11 | 11 | 0.15% | 0.18% | 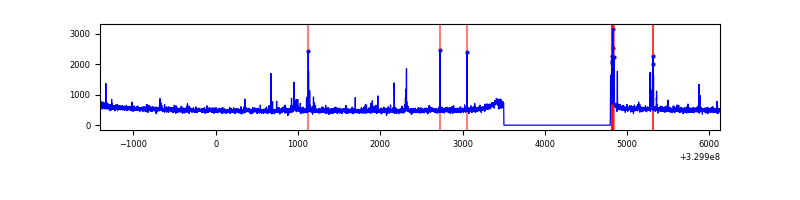 |
| C | 7534 | 6240 | 0 | 0 | 0.00% | 0.00% | 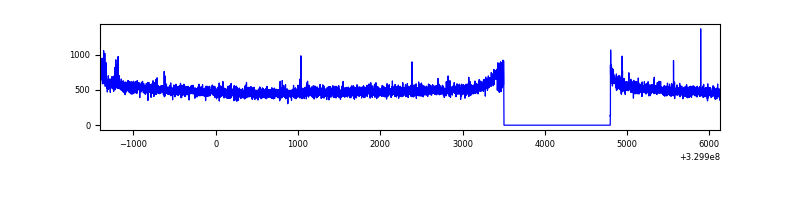 |
| D | 7534 | 6240 | 33 | 33 | 0.44% | 0.53% | 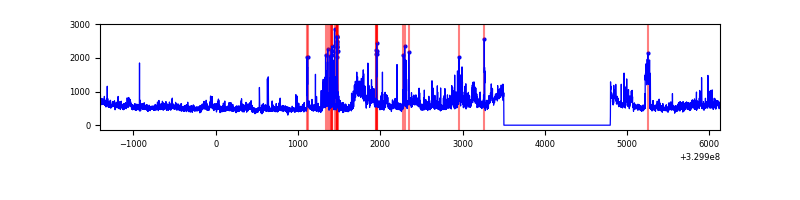 |
Top three noisy pixels from each quadrant. If the there are fewer than three noisy pixels in the level2.evt file, extra rows are filled as -1
| Pixel properties | Quadrant properties | ||||||
|---|---|---|---|---|---|---|---|
| Quadrant | DetID | PixID | Counts | Sigma | Mean | Median | Sigma |
| A | 13 | 254 | 9580 | 54.26 | 819 | 805 | 161.7 |
| A | 0 | 226 | 7182 | 39.43 | 819 | 805 | 161.7 |
| A | 3 | 137 | 6732 | 36.65 | 819 | 805 | 161.7 |
| B | 0 | 229 | 73549 | 486.46 | 803 | 783 | 149.6 |
| B | 3 | 64 | 47579 | 312.84 | 803 | 783 | 149.6 |
| B | 0 | 190 | 19192 | 123.07 | 803 | 783 | 149.6 |
| C | 14 | 238 | 125375 | 714.86 | 764 | 769 | 174.3 |
| C | 0 | 239 | 13569 | 73.43 | 764 | 769 | 174.3 |
| C | 3 | 233 | 8022 | 41.61 | 764 | 769 | 174.3 |
| D | 1 | 52 | 545174 | 2905.25 | 781 | 759 | 187.4 |
| D | 8 | 195 | 335814 | 1788.01 | 781 | 759 | 187.4 |
| D | 2 | 244 | 72181 | 381.14 | 781 | 759 | 187.4 |
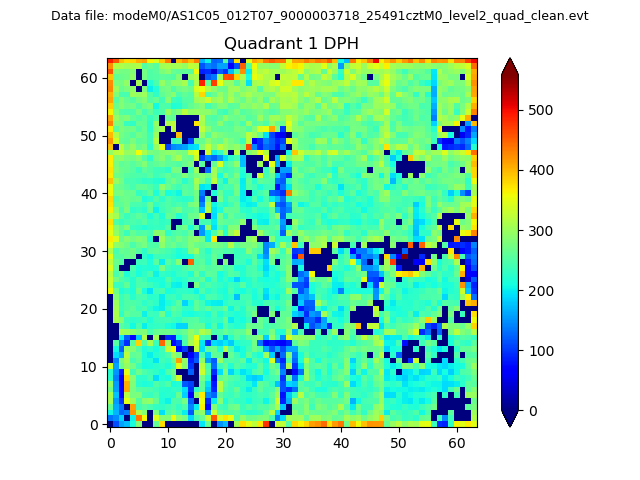
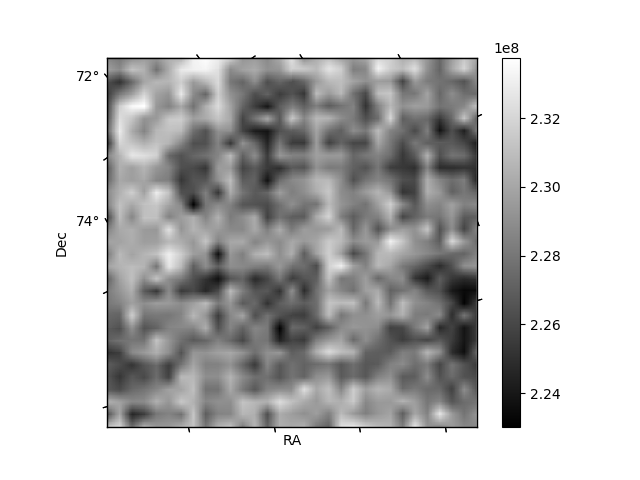
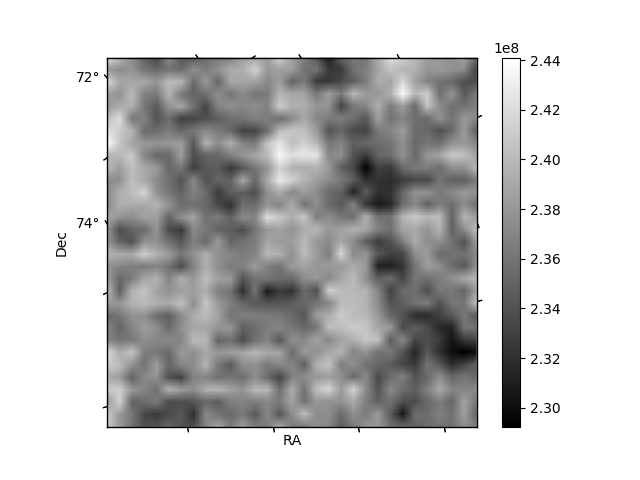
Histogram calculated using DETX and DETY for each event in the final _common_clean file
| Quadrant A |  |
 |
Quadrant B |
|---|---|---|---|
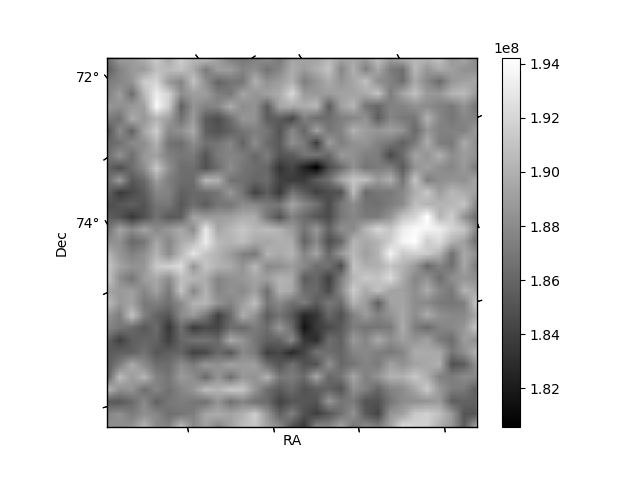
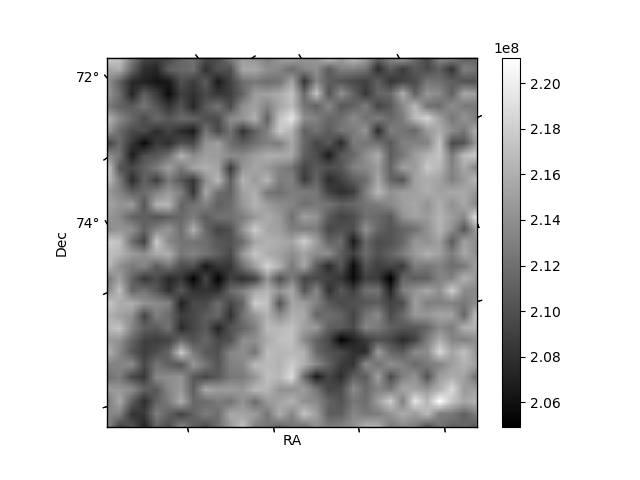
| Quadrant D | 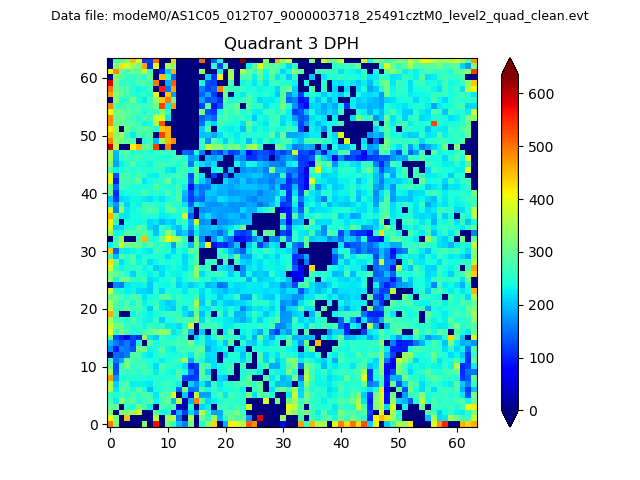 |
 |
Quadrant C |
| Plot type | Count rate plots | Images |
|---|---|---|
| Comparison with Poisson distribution Blue bars denote a histogram of data divided into 1 sec bins. Red curve is a Poisson curve with rate = median count rate of data. |
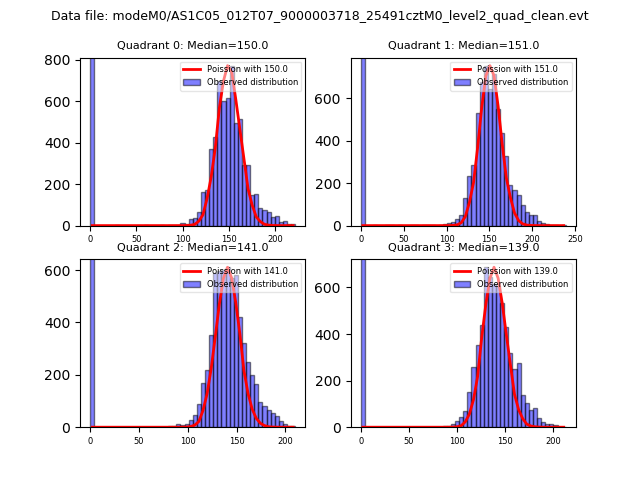 |
 |
| Quadrant-wise count rates Data is divided into 100 sec bins |
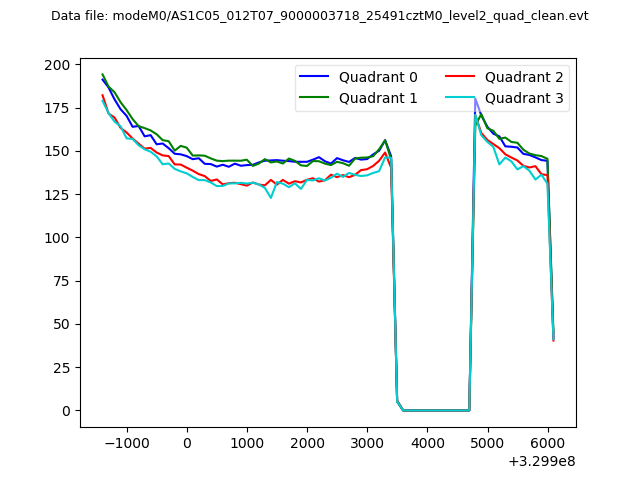 |
|
| Module-wise count rates for Quadrant A Data is divided into 100 sec bins |
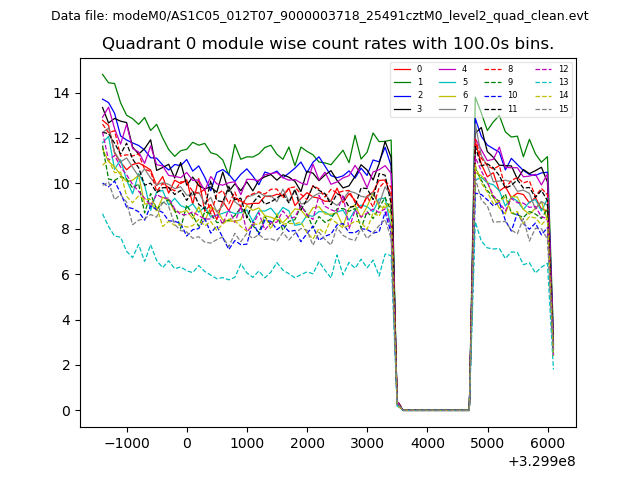 |
 |
| Module-wise count rates for Quadrant B Data is divided into 100 sec bins |
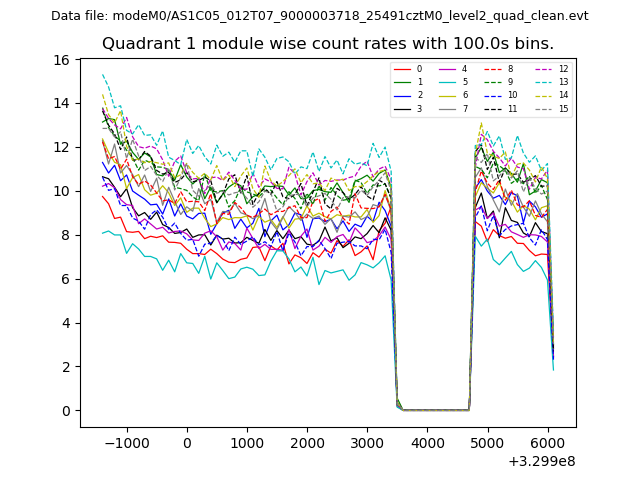 |
 |
| Module-wise count rates for Quadrant C Data is divided into 100 sec bins |
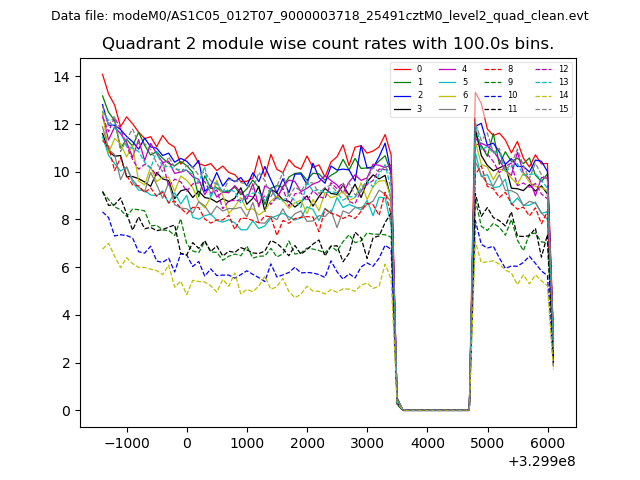 |
 |
| Module-wise count rates for Quadrant D Data is divided into 100 sec bins |
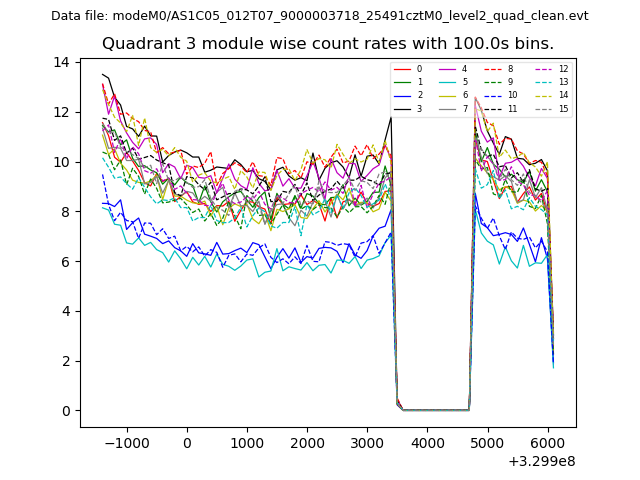 |
 |
| Parameter | Plot |
|---|---|
| CZT HV Monitor | 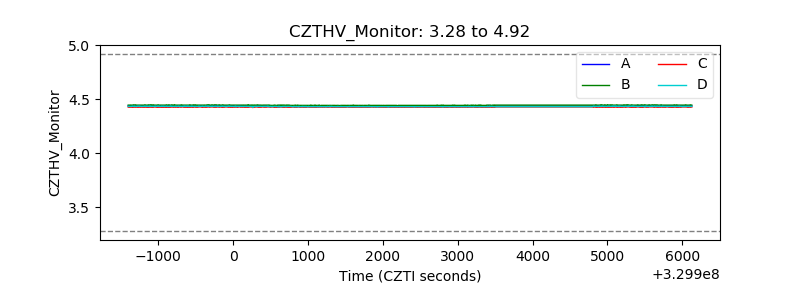 |
| D_VDD | 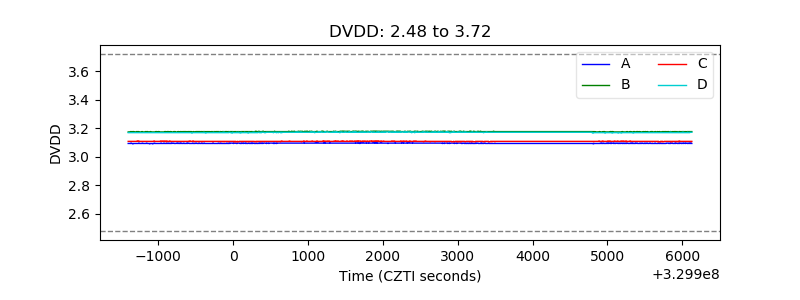 |
| Temperature 1 | 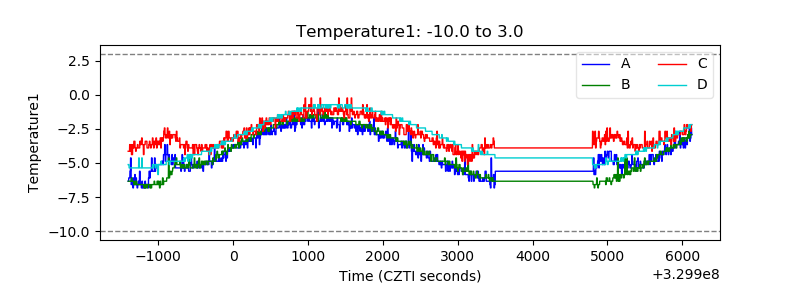 |
| Veto HV Monitor | 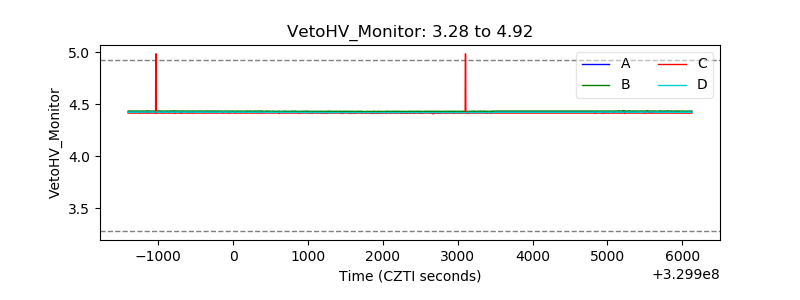 |
| Veto LLD | 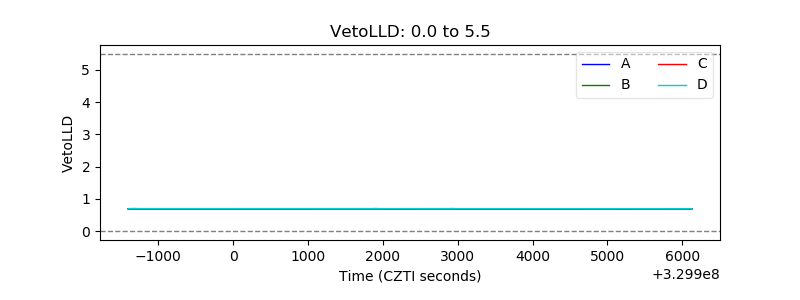 |
| Alpha Counter | 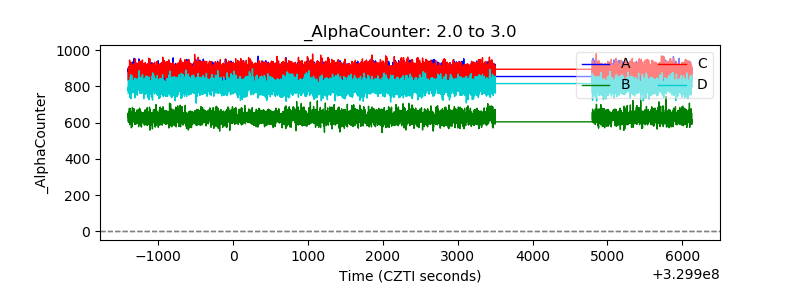 |
| _CPM_Rate | 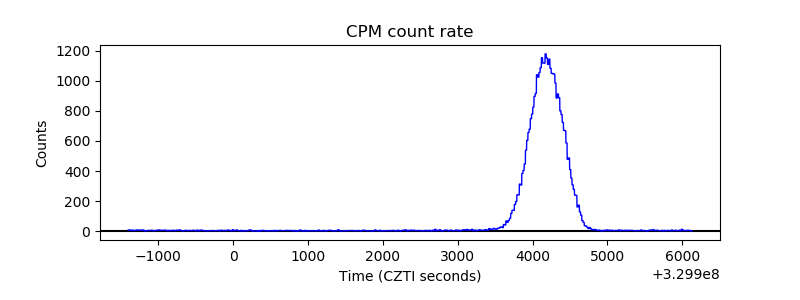 |
| CZT Counter |  |
| +2.5 Volts monitor |  |
| +5 Volts monitor | 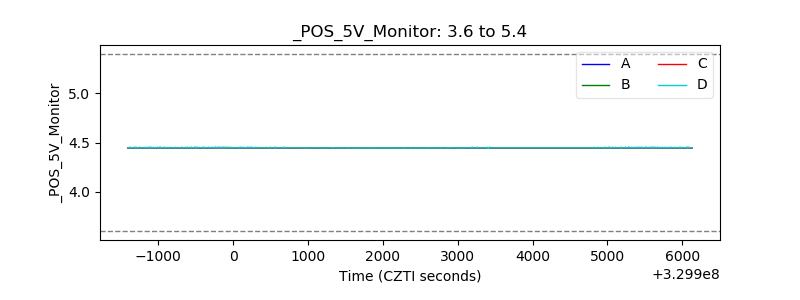 |
| _ROLL_ROT | 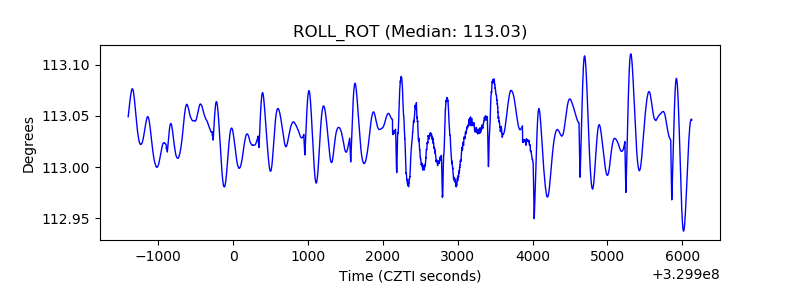 |
| _Roll_DEC | 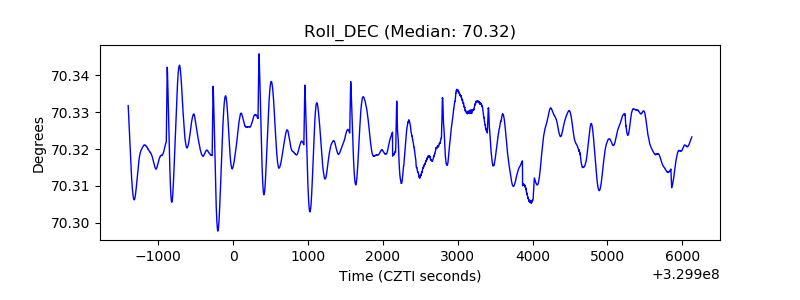 |
| _Roll_RA |  |
| Veto Counter | 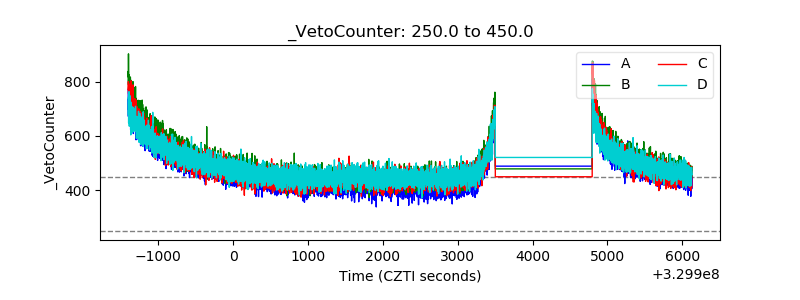 |