| Param | Original file | Final file |
|---|---|---|
| Filename | modeM0/AS1C05_012T07_9000003718_25492cztM0_level2.evt | modeM0/AS1C05_012T07_9000003718_25492cztM0_level2_quad_clean.evt |
| Size (bytes) | 498,231,360 | 129,528,000 |
| Size | 475.2 MB | 123.5 MB |
| Events in quadrant A | 3,100,815 | 902,294 |
| Events in quadrant B | 3,980,085 | 882,691 |
| Events in quadrant C | 3,080,545 | 855,633 |
| Events in quadrant D | 4,495,337 | 838,201 |
| Mode M9 | |||
|---|---|---|---|
| Quadrant | BADHDUFLAG | Total packets | Discarded packets |
| A | 0 | 11 | 0 |
| B | 0 | 11 | 0 |
| C | 0 | 11 | 0 |
| D | 0 | 11 | 0 |
| Mode M0 | |||
|---|---|---|---|
| Quadrant | BADHDUFLAG | Total packets | Discarded packets |
| A | 0 | 13024 | 0 |
| B | 0 | 15622 | 0 |
| C | 0 | 13046 | 0 |
| D | 0 | 17665 | 0 |
| Quadrant | Total seconds | Saturated seconds | Saturation percentage |
|---|---|---|---|
| A | 6362 | 98 | 1.540396% |
| B | 6363 | 409 | 6.427786% |
| C | 6363 | 119 | 1.870187% |
| D | 6363 | 161 | 2.530253% |
Noise dominated data is calculated using 1-second bins in cleaned event files. If a bin has >2000 counts, and if more than 50% of those come from <1% of pixels, then it is considered to be noise-dominated and hence unusable.
| Quadrant | # 1 sec bins | Bins with >0 counts | Bins with >2000 counts | High rate bins dominated by noise | Noise dominated (total time) | Noise dominated (detector-on time) | Marked lightcurve |
|---|---|---|---|---|---|---|---|
| A | 7442 | 6363 | 0 | 0 | 0.00% | 0.00% | 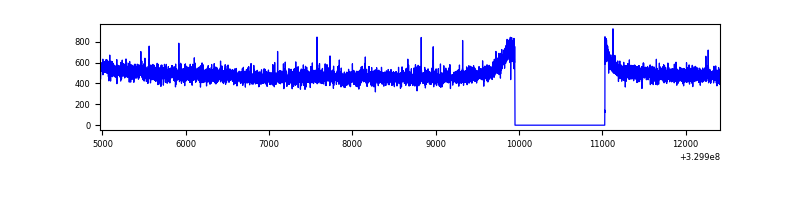 |
| B | 7443 | 6364 | 163 | 163 | 2.19% | 2.56% | 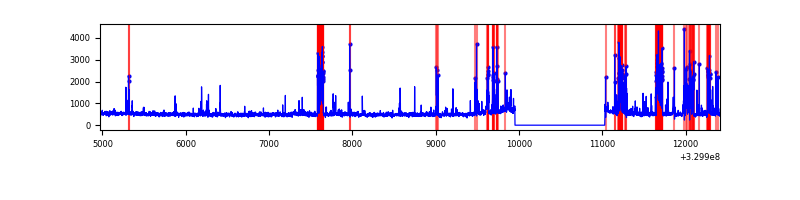 |
| C | 7443 | 6364 | 0 | 0 | 0.00% | 0.00% | 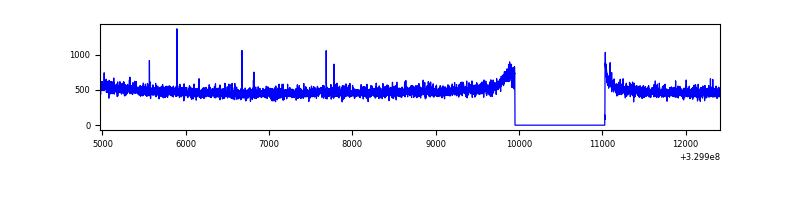 |
| D | 7443 | 6364 | 66 | 66 | 0.89% | 1.04% | 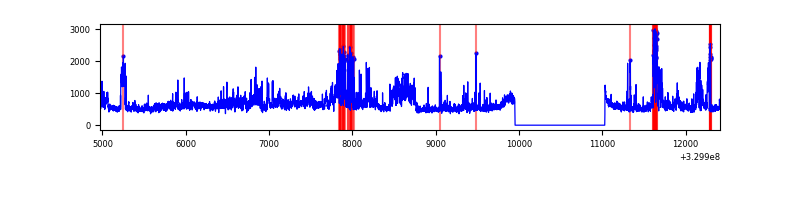 |
Top three noisy pixels from each quadrant. If the there are fewer than three noisy pixels in the level2.evt file, extra rows are filled as -1
| Pixel properties | Quadrant properties | ||||||
|---|---|---|---|---|---|---|---|
| Quadrant | DetID | PixID | Counts | Sigma | Mean | Median | Sigma |
| A | 13 | 254 | 10490 | 61.24 | 802 | 787 | 158.4 |
| A | 0 | 226 | 6933 | 38.79 | 802 | 787 | 158.4 |
| A | 3 | 137 | 6910 | 38.64 | 802 | 787 | 158.4 |
| B | 3 | 64 | 829424 | 5758.66 | 770 | 752 | 143.9 |
| B | 0 | 229 | 43033 | 293.82 | 770 | 752 | 143.9 |
| B | 0 | 219 | 37204 | 253.31 | 770 | 752 | 143.9 |
| C | 14 | 238 | 122688 | 699.66 | 755 | 759 | 174.3 |
| C | 3 | 233 | 6239 | 31.45 | 755 | 759 | 174.3 |
| C | 13 | 61 | 5222 | 25.61 | 755 | 759 | 174.3 |
| D | 1 | 52 | 1109110 | 6035.27 | 770 | 748 | 183.6 |
| D | 8 | 195 | 299572 | 1627.16 | 770 | 748 | 183.6 |
| D | 7 | 238 | 88973 | 480.4 | 770 | 748 | 183.6 |
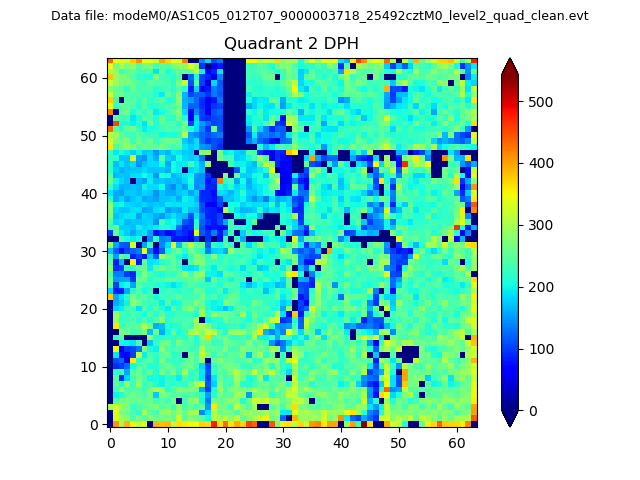
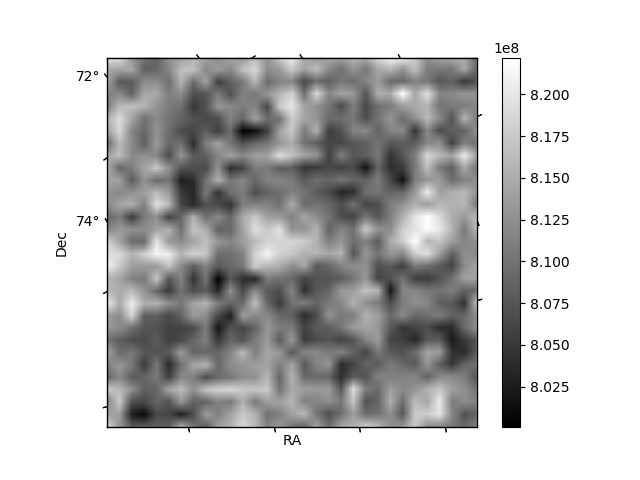
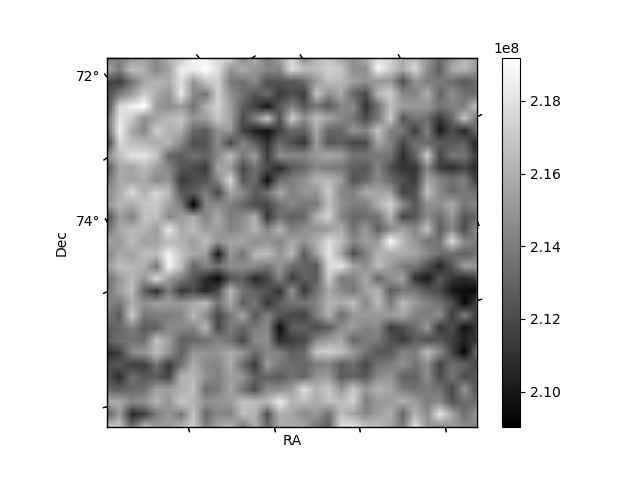
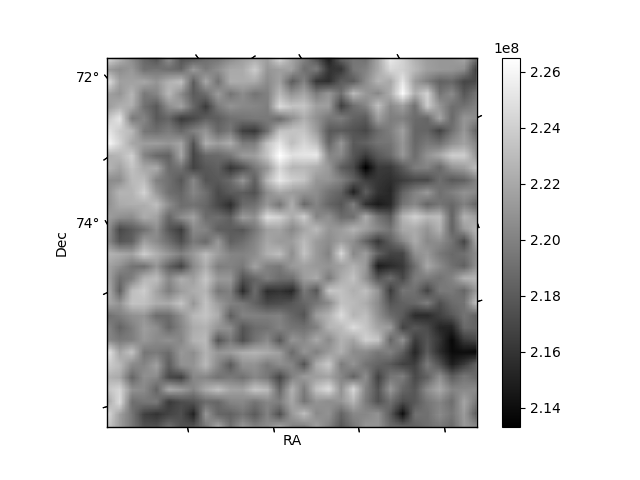
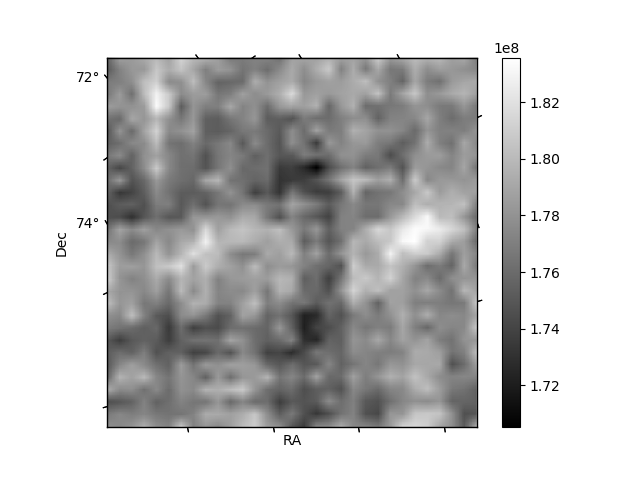
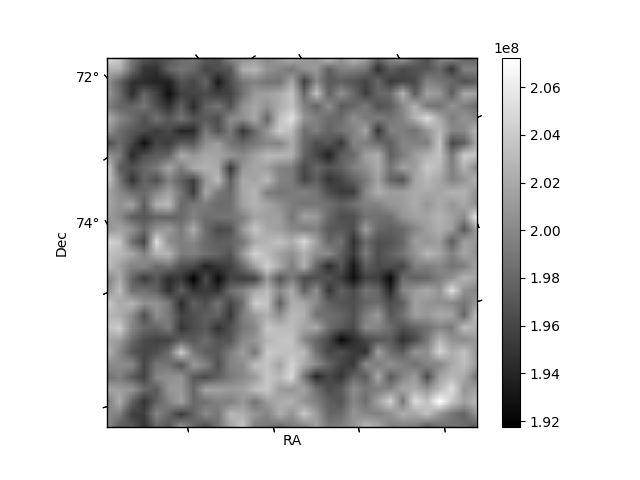
Histogram calculated using DETX and DETY for each event in the final _common_clean file
| Quadrant A | 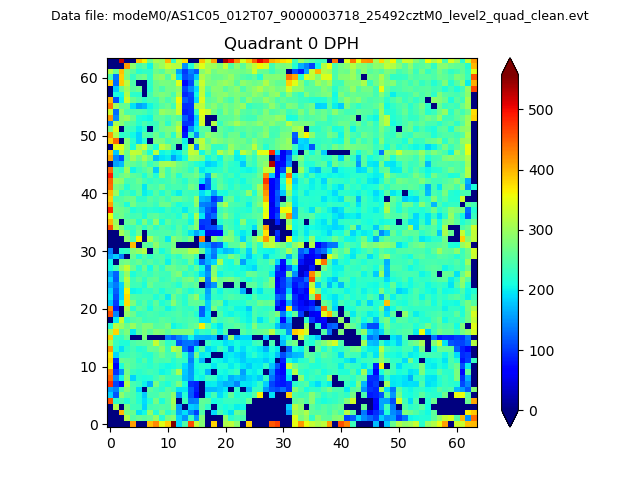 |
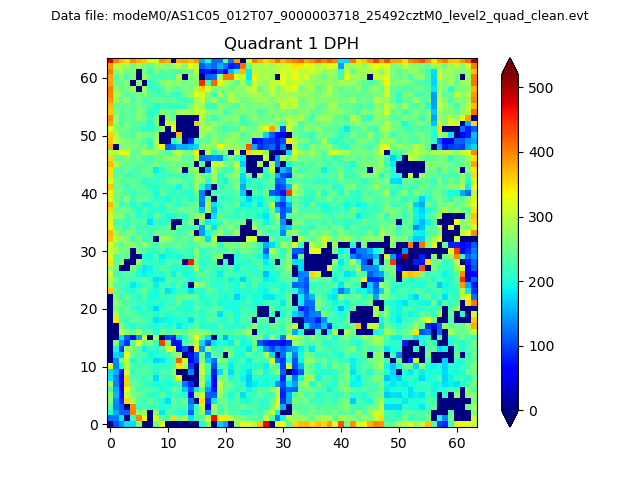 |
Quadrant B |
|---|---|---|---|
| Quadrant D | 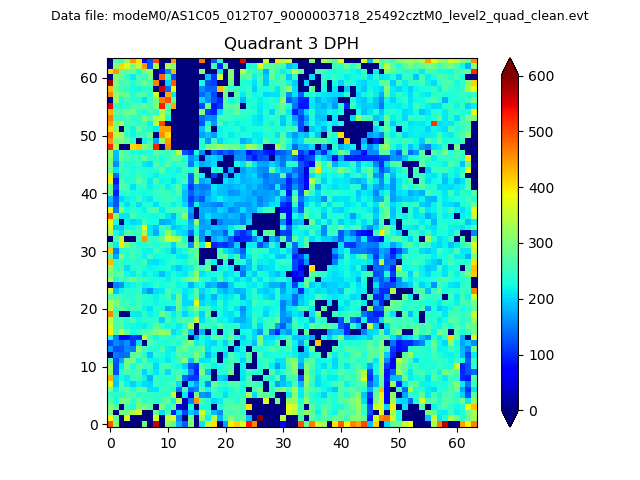 |
 |
Quadrant C |
| Plot type | Count rate plots | Images |
|---|---|---|
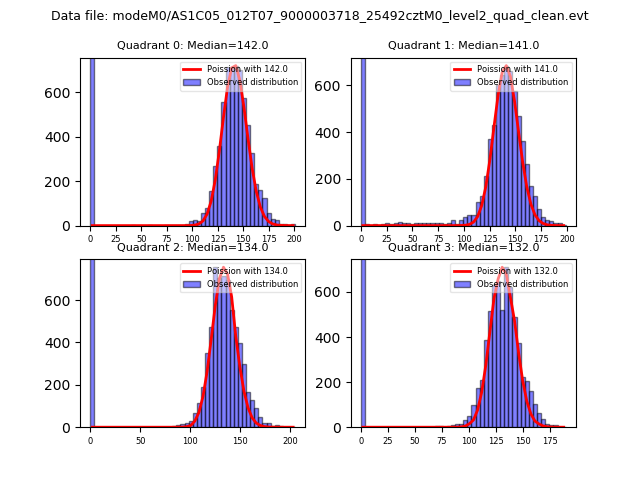
| Comparison with Poisson distribution Blue bars denote a histogram of data divided into 1 sec bins. Red curve is a Poisson curve with rate = median count rate of data. |
 |
 |
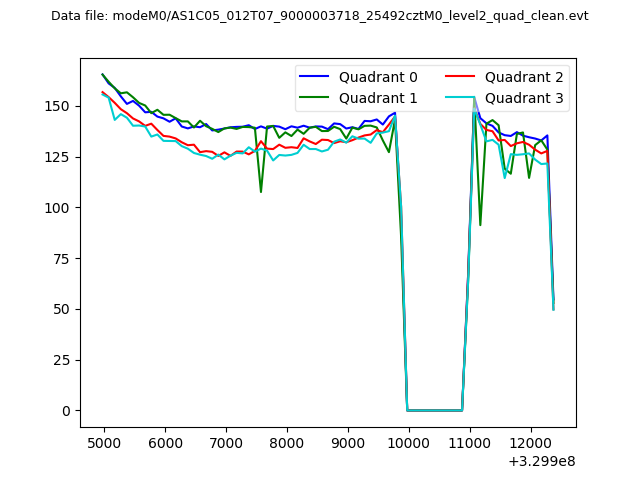
| Quadrant-wise count rates Data is divided into 100 sec bins |
 |
|
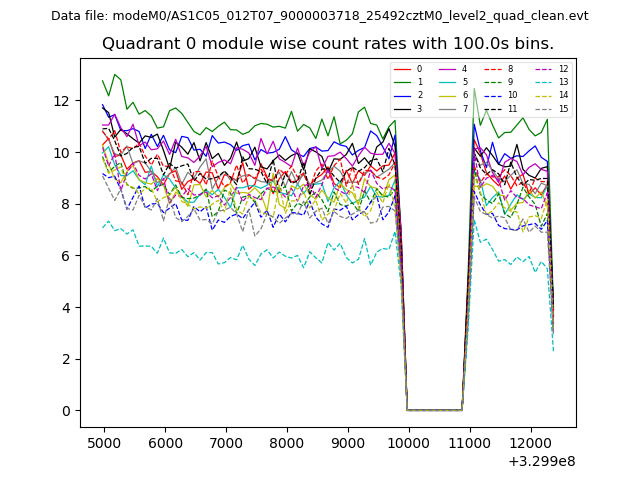
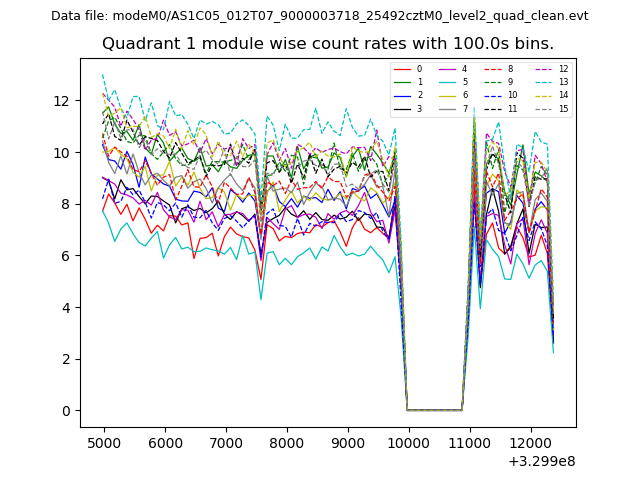
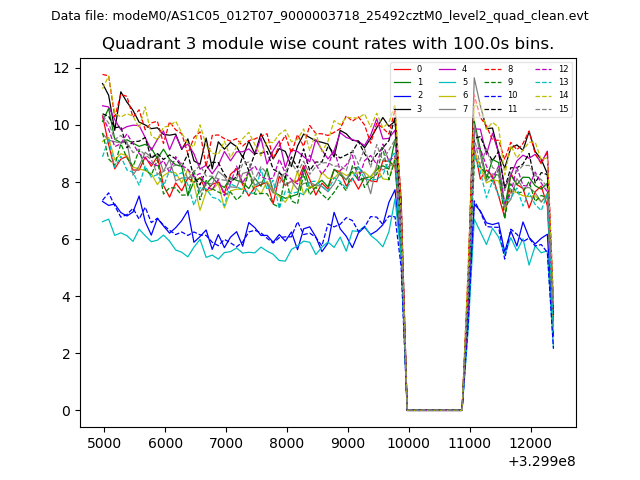
| Module-wise count rates for Quadrant A Data is divided into 100 sec bins |
 |
 |
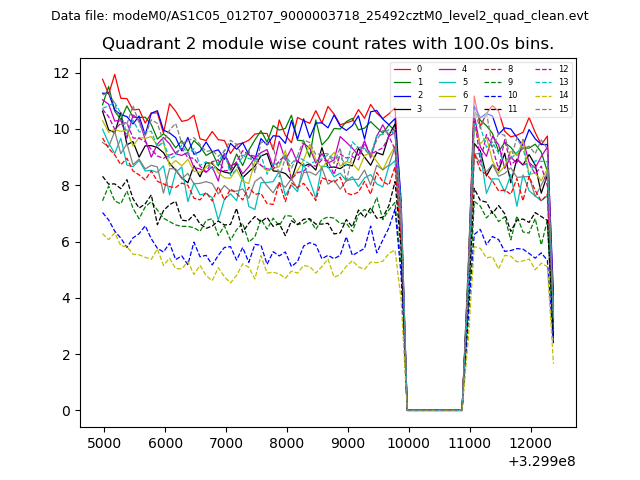
| Module-wise count rates for Quadrant B Data is divided into 100 sec bins |
 |
 |
| Module-wise count rates for Quadrant C Data is divided into 100 sec bins |
 |
 |
| Module-wise count rates for Quadrant D Data is divided into 100 sec bins |
 |
 |
| Parameter | Plot |
|---|---|
| CZT HV Monitor | 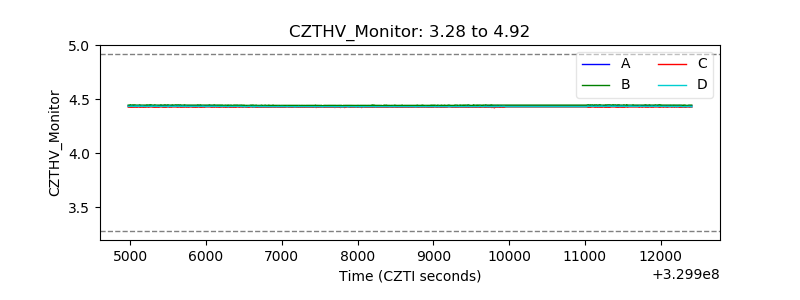 |
| D_VDD | 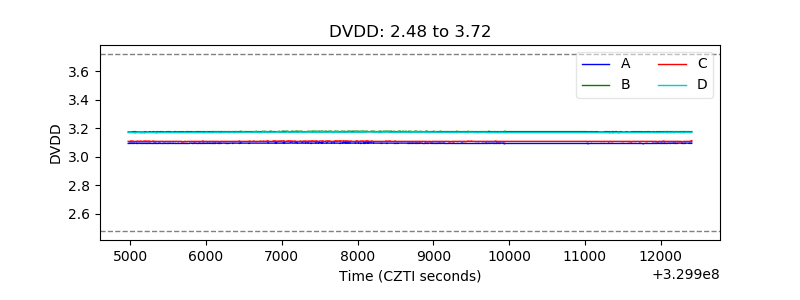 |
| Temperature 1 | 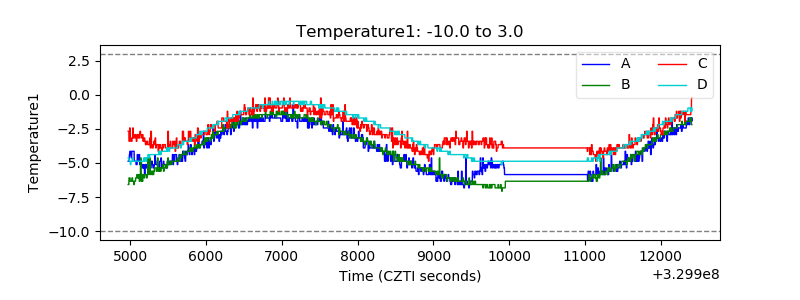 |
| Veto HV Monitor | 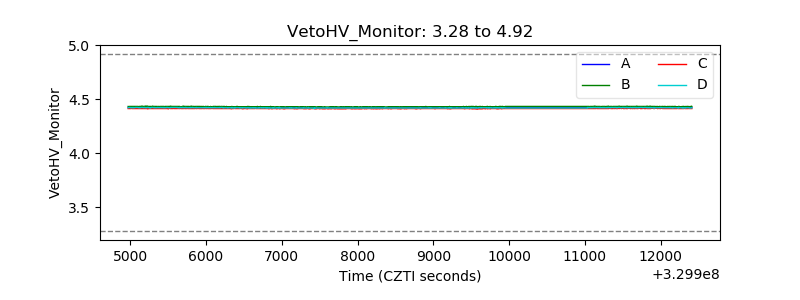 |
| Veto LLD | 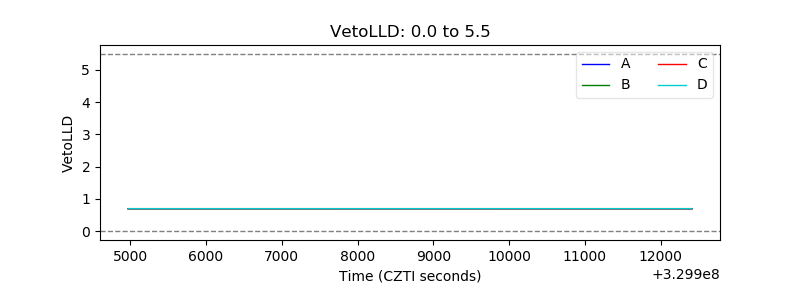 |
| Alpha Counter | 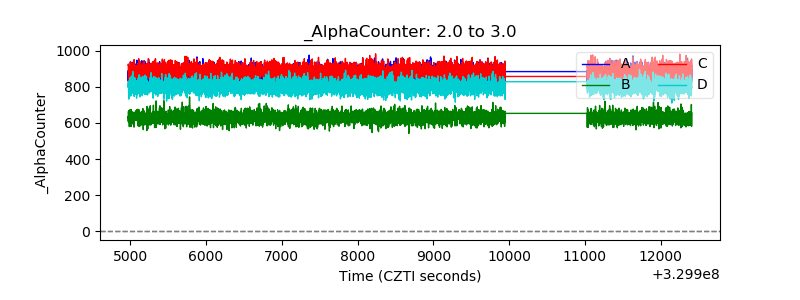 |
| _CPM_Rate | 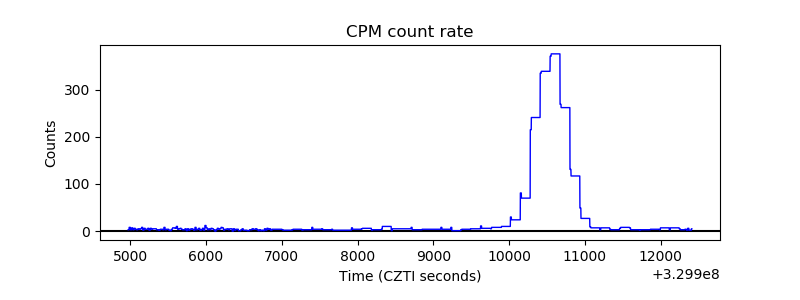 |
| CZT Counter | 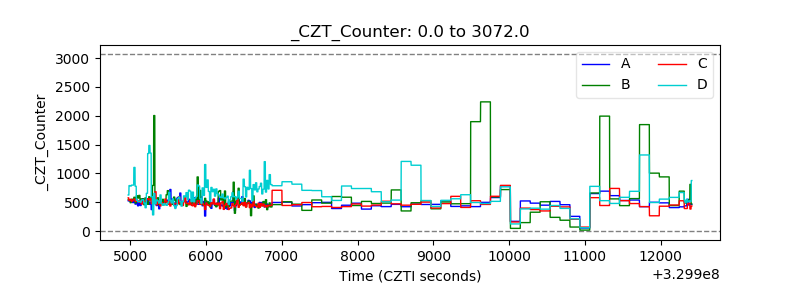 |
| +2.5 Volts monitor |  |
| +5 Volts monitor |  |
| _ROLL_ROT | 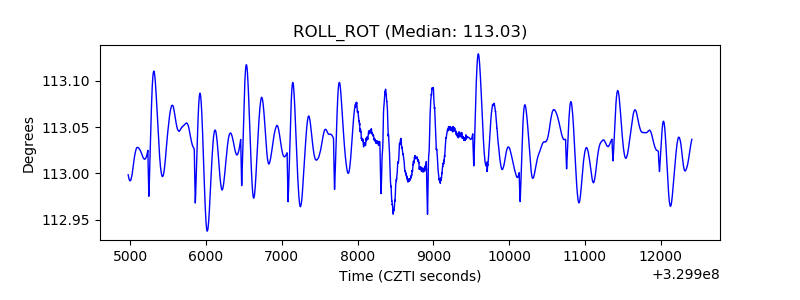 |
| _Roll_DEC | 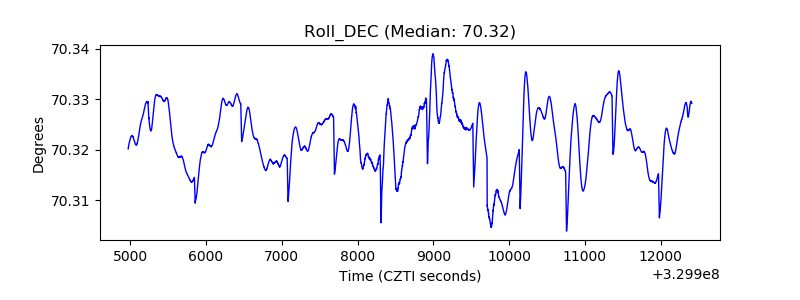 |
| _Roll_RA | 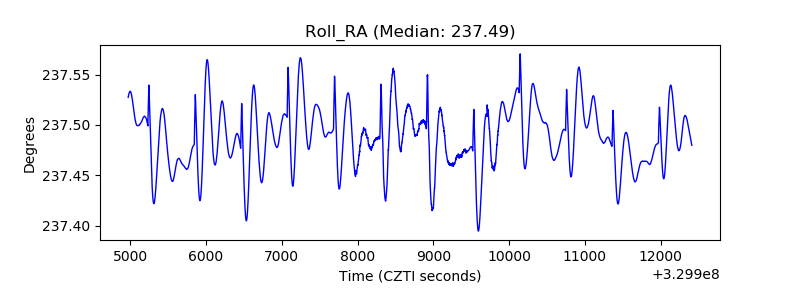 |
| Veto Counter | 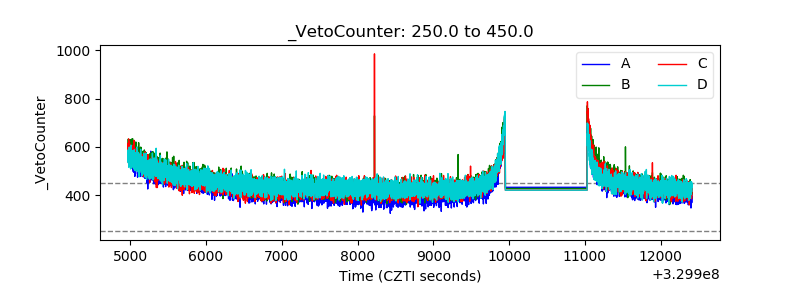 |