| Param | Original file | Final file |
|---|---|---|
| Filename | modeM0/AS1C05_012T07_9000003718_25493cztM0_level2.evt | modeM0/AS1C05_012T07_9000003718_25493cztM0_level2_quad_clean.evt |
| Size (bytes) | 526,512,960 | 125,697,600 |
| Size | 502.1 MB | 119.9 MB |
| Events in quadrant A | 3,062,612 | 872,443 |
| Events in quadrant B | 5,177,464 | 828,170 |
| Events in quadrant C | 3,068,520 | 832,015 |
| Events in quadrant D | 4,189,688 | 814,817 |
| Mode M9 | |||
|---|---|---|---|
| Quadrant | BADHDUFLAG | Total packets | Discarded packets |
| A | 0 | 8 | 0 |
| B | 0 | 8 | 0 |
| C | 0 | 8 | 0 |
| D | 0 | 8 | 0 |
| Mode M0 | |||
|---|---|---|---|
| Quadrant | BADHDUFLAG | Total packets | Discarded packets |
| A | 0 | 13332 | 0 |
| B | 0 | 19569 | 0 |
| C | 0 | 13361 | 0 |
| D | 0 | 16818 | 0 |
| Quadrant | Total seconds | Saturated seconds | Saturation percentage |
|---|---|---|---|
| A | 6586 | 73 | 1.108412% |
| B | 6586 | 765 | 11.615548% |
| C | 6586 | 91 | 1.381719% |
| D | 6587 | 141 | 2.140580% |
Noise dominated data is calculated using 1-second bins in cleaned event files. If a bin has >2000 counts, and if more than 50% of those come from <1% of pixels, then it is considered to be noise-dominated and hence unusable.
| Quadrant | # 1 sec bins | Bins with >0 counts | Bins with >2000 counts | High rate bins dominated by noise | Noise dominated (total time) | Noise dominated (detector-on time) | Marked lightcurve |
|---|---|---|---|---|---|---|---|
| A | 7351 | 6588 | 0 | 0 | 0.00% | 0.00% | 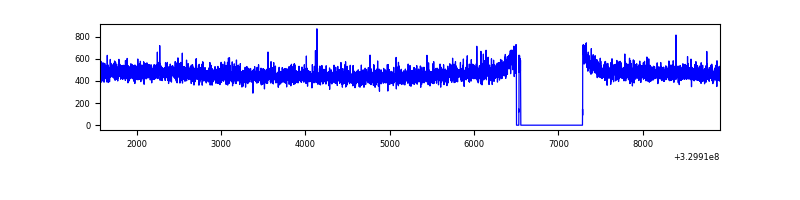 |
| B | 7351 | 6588 | 465 | 465 | 6.33% | 7.06% | 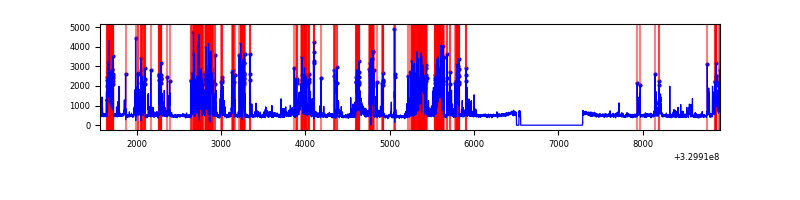 |
| C | 7351 | 6588 | 0 | 0 | 0.00% | 0.00% | 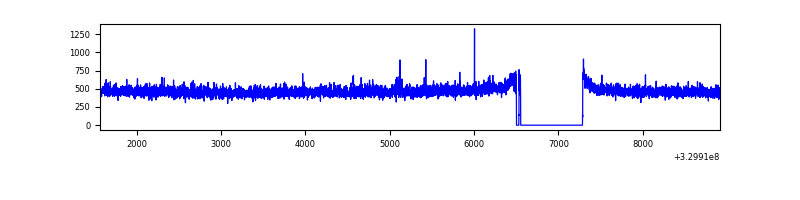 |
| D | 7352 | 6589 | 88 | 88 | 1.20% | 1.34% | 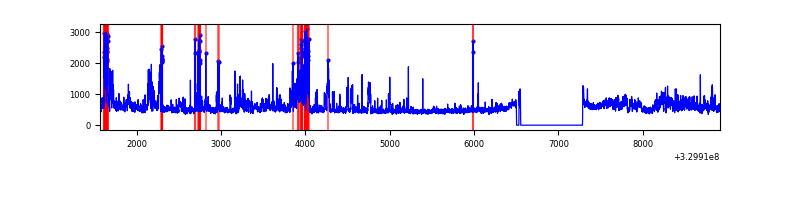 |
Top three noisy pixels from each quadrant. If the there are fewer than three noisy pixels in the level2.evt file, extra rows are filled as -1
| Pixel properties | Quadrant properties | ||||||
|---|---|---|---|---|---|---|---|
| Quadrant | DetID | PixID | Counts | Sigma | Mean | Median | Sigma |
| A | 13 | 254 | 10312 | 60.7 | 790 | 775 | 157.1 |
| A | 0 | 226 | 6935 | 39.21 | 790 | 775 | 157.1 |
| A | 3 | 137 | 6887 | 38.9 | 790 | 775 | 157.1 |
| B | 3 | 64 | 2164194 | 15378.55 | 746 | 728 | 140.7 |
| B | 0 | 190 | 34312 | 238.72 | 746 | 728 | 140.7 |
| B | 0 | 229 | 27409 | 189.66 | 746 | 728 | 140.7 |
| C | 14 | 238 | 121605 | 692.74 | 750 | 753 | 174.5 |
| C | 9 | 54 | 12218 | 65.72 | 750 | 753 | 174.5 |
| C | 2 | 16 | 5324 | 26.2 | 750 | 753 | 174.5 |
| D | 1 | 52 | 789351 | 4276.94 | 761 | 738 | 184.4 |
| D | 7 | 238 | 314573 | 1702.04 | 761 | 738 | 184.4 |
| D | 8 | 195 | 168318 | 908.85 | 761 | 738 | 184.4 |
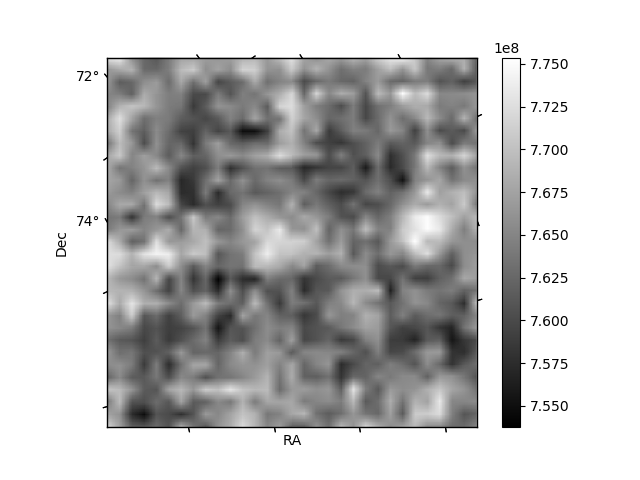
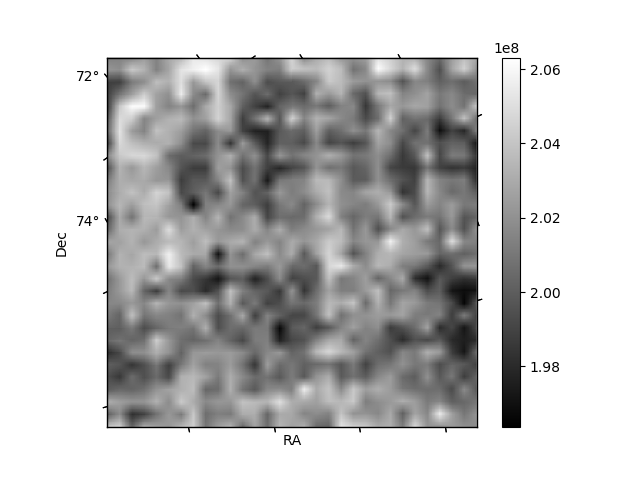
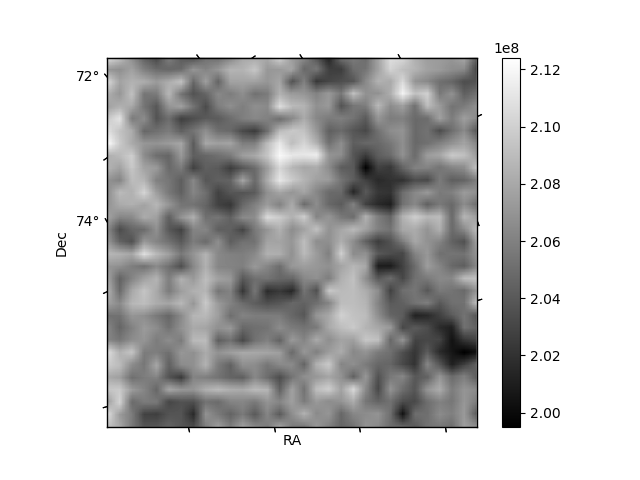
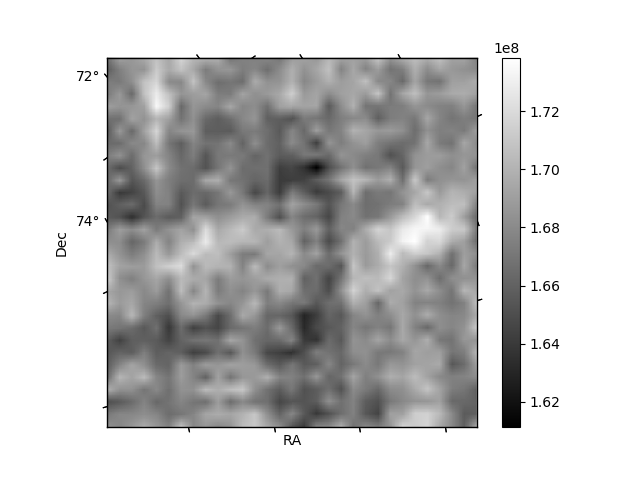
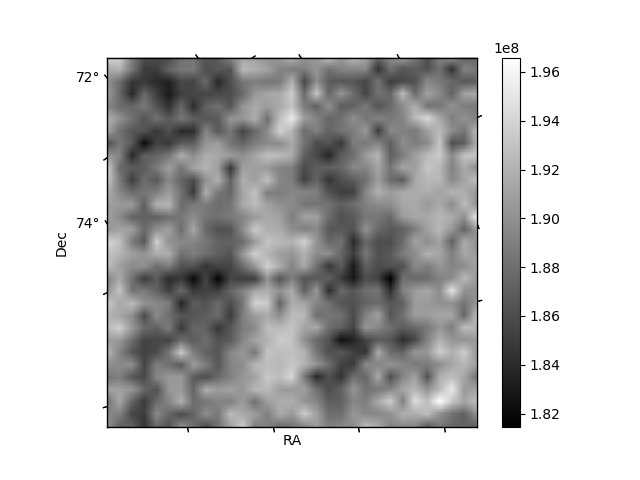
Histogram calculated using DETX and DETY for each event in the final _common_clean file
| Quadrant A | 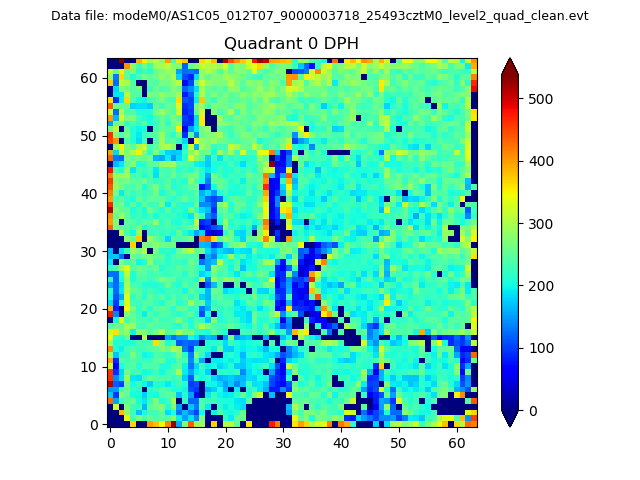 |
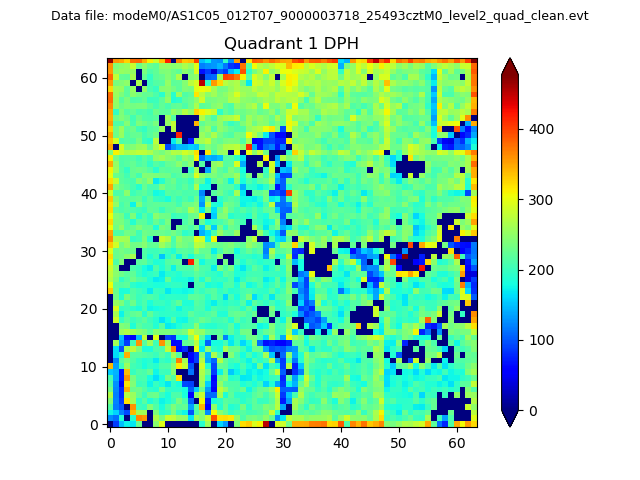 |
Quadrant B |
|---|---|---|---|
| Quadrant D | 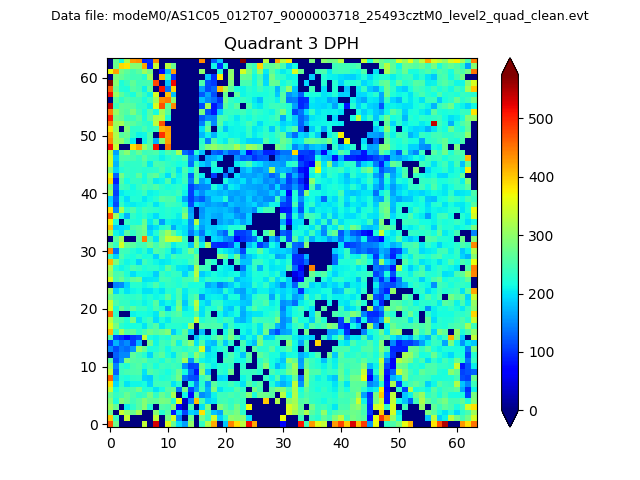 |
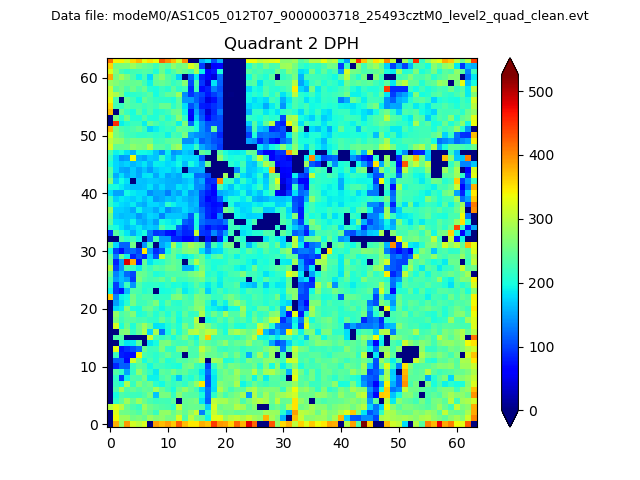 |
Quadrant C |
| Plot type | Count rate plots | Images |
|---|---|---|
| Comparison with Poisson distribution Blue bars denote a histogram of data divided into 1 sec bins. Red curve is a Poisson curve with rate = median count rate of data. |
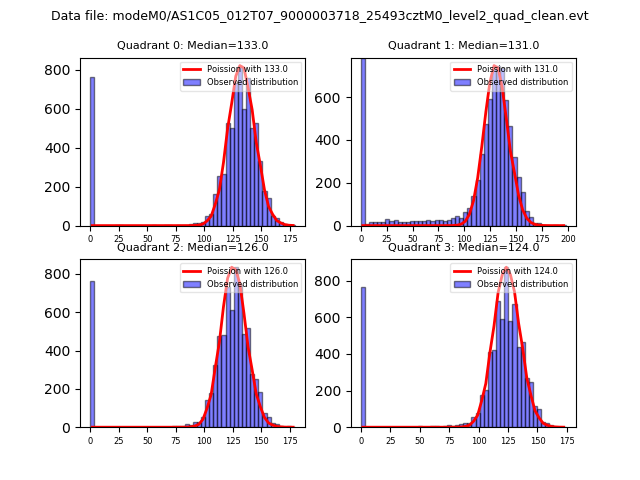 |
 |
| Quadrant-wise count rates Data is divided into 100 sec bins |
 |
|
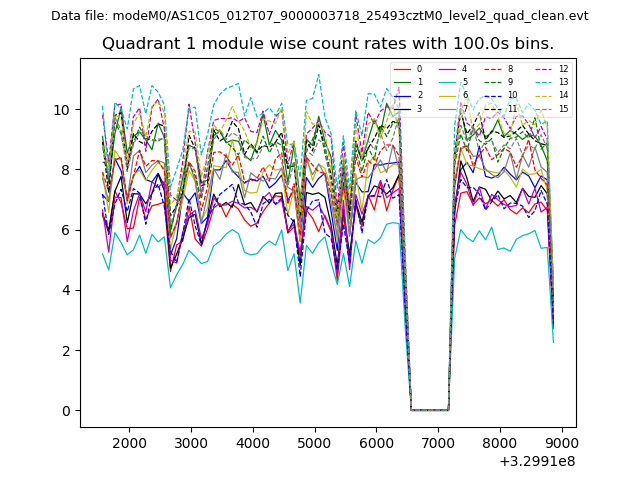
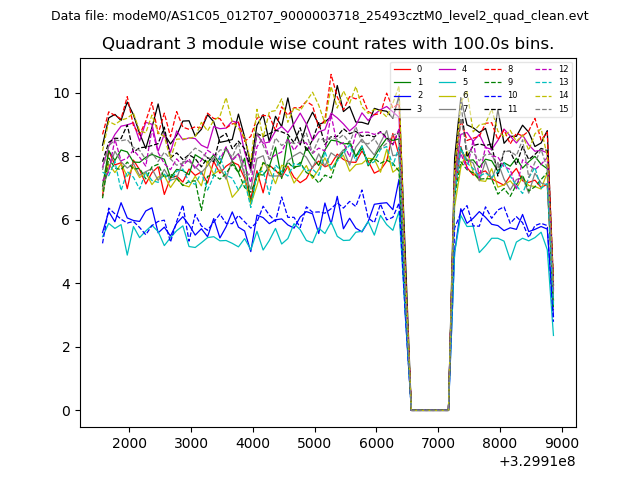
| Module-wise count rates for Quadrant A Data is divided into 100 sec bins |
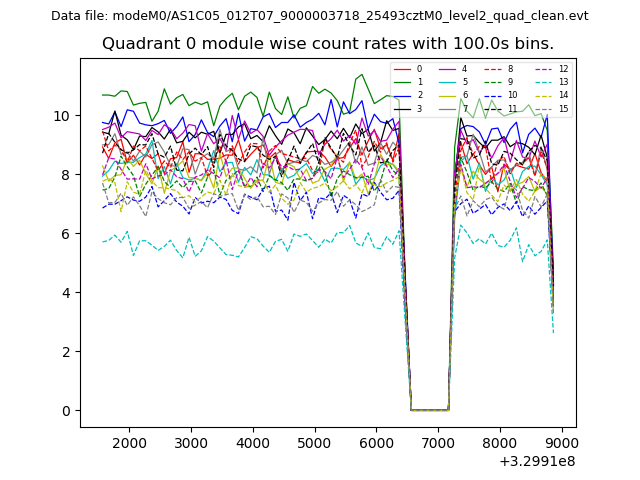 |
 |
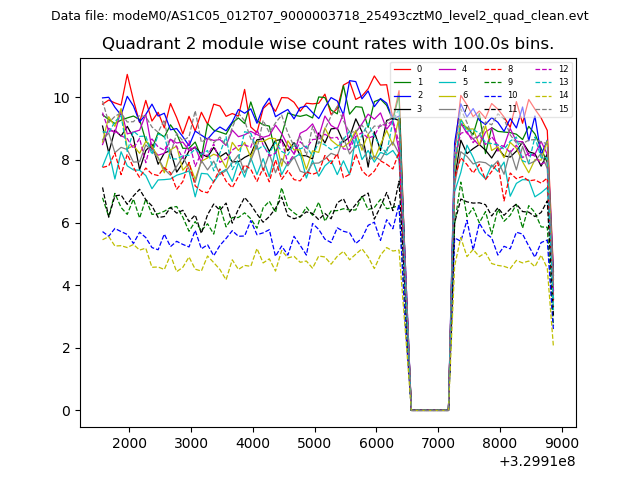
| Module-wise count rates for Quadrant B Data is divided into 100 sec bins |
 |
 |
| Module-wise count rates for Quadrant C Data is divided into 100 sec bins |
 |
 |
| Module-wise count rates for Quadrant D Data is divided into 100 sec bins |
 |
 |
| Parameter | Plot |
|---|---|
| CZT HV Monitor | 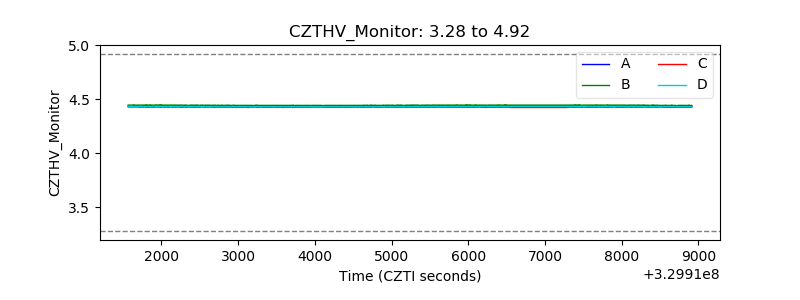 |
| D_VDD | 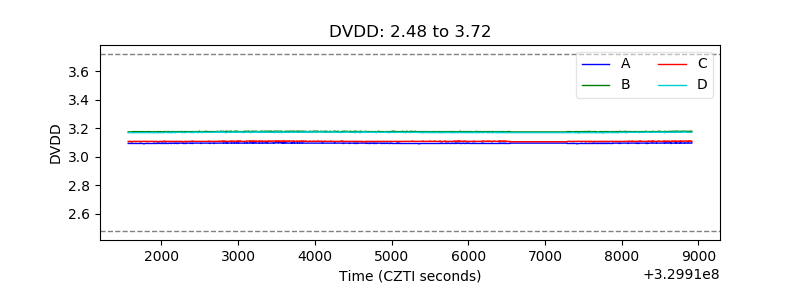 |
| Temperature 1 | 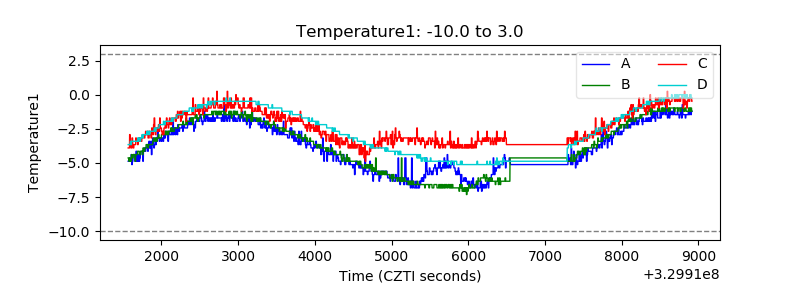 |
| Veto HV Monitor | 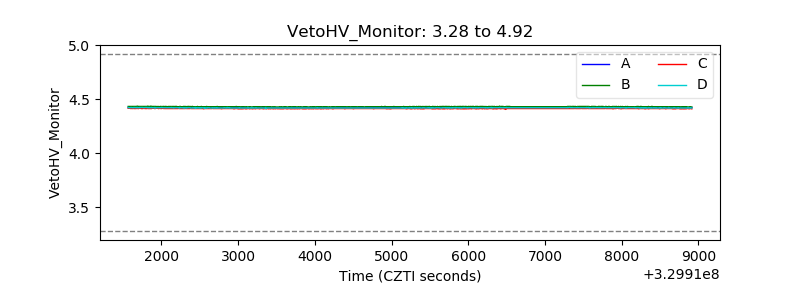 |
| Veto LLD | 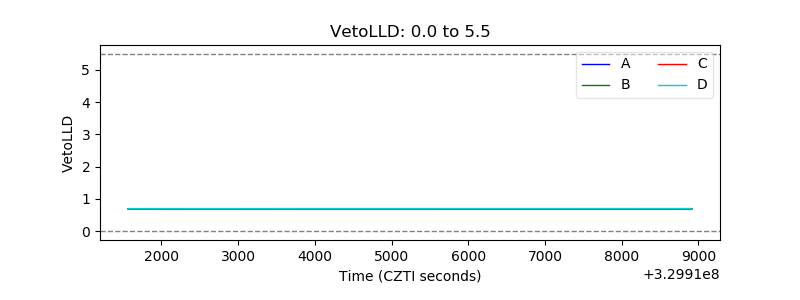 |
| Alpha Counter | 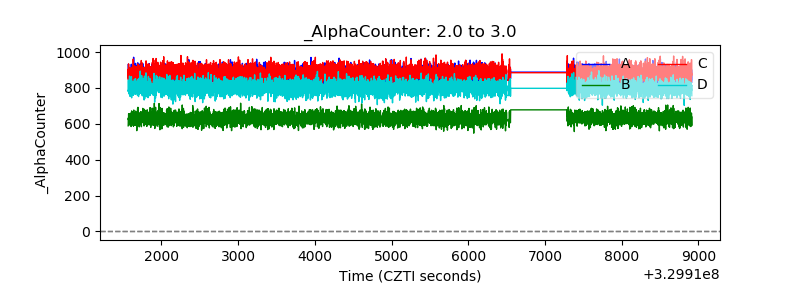 |
| _CPM_Rate | 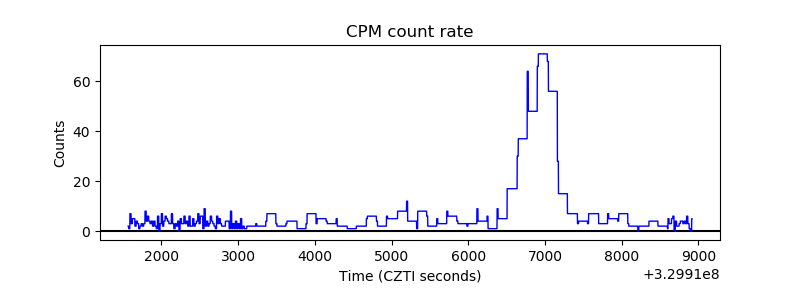 |
| CZT Counter | 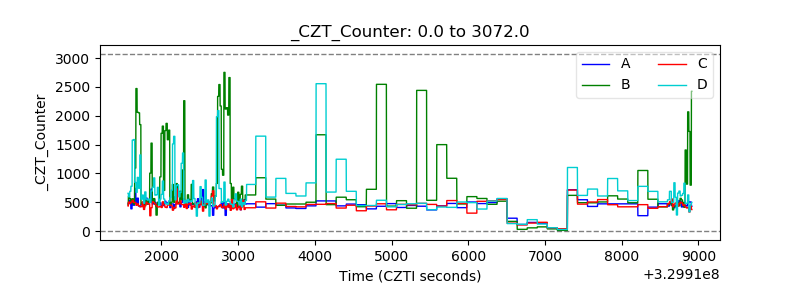 |
| +2.5 Volts monitor |  |
| +5 Volts monitor |  |
| _ROLL_ROT | 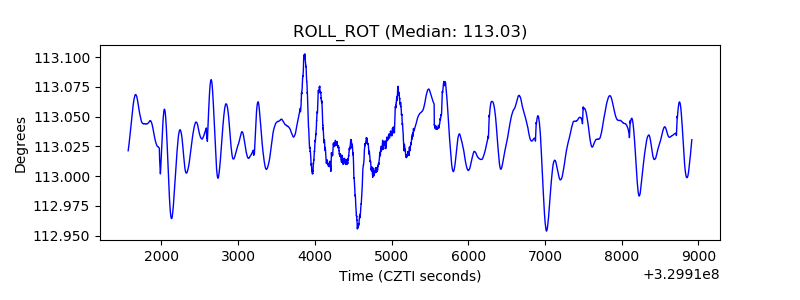 |
| _Roll_DEC | 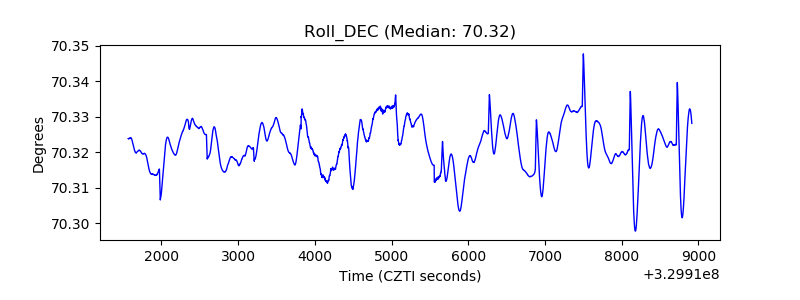 |
| _Roll_RA |  |
| Veto Counter | 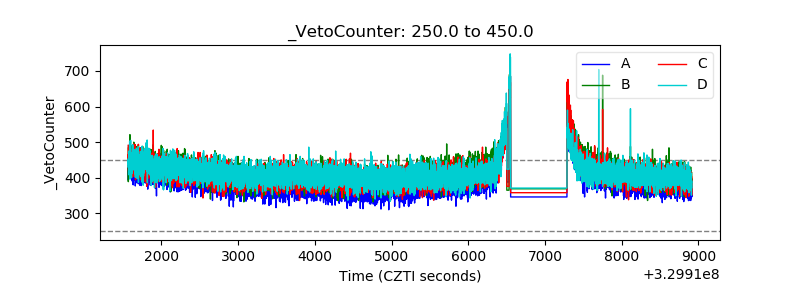 |