| Param | Original file | Final file |
|---|---|---|
| Filename | modeM0/AS1C05_012T07_9000003718_25494cztM0_level2.evt | modeM0/AS1C05_012T07_9000003718_25494cztM0_level2_quad_clean.evt |
| Size (bytes) | 109,203,840 | 26,965,440 |
| Size | 104.1 MB | 25.7 MB |
| Events in quadrant A | 663,367 | 184,553 |
| Events in quadrant B | 1,004,031 | 181,785 |
| Events in quadrant C | 644,901 | 173,129 |
| Events in quadrant D | 893,974 | 169,451 |
| Mode M0 | |||
|---|---|---|---|
| Quadrant | BADHDUFLAG | Total packets | Discarded packets |
| A | 0 | 2884 | 0 |
| B | 0 | 3892 | 0 |
| C | 0 | 2879 | 0 |
| D | 0 | 3598 | 0 |
| Quadrant | Total seconds | Saturated seconds | Saturation percentage |
|---|---|---|---|
| A | 1438 | 4 | 0.278164% |
| B | 1439 | 67 | 4.656011% |
| C | 1439 | 4 | 0.277971% |
| D | 1439 | 6 | 0.416956% |
Noise dominated data is calculated using 1-second bins in cleaned event files. If a bin has >2000 counts, and if more than 50% of those come from <1% of pixels, then it is considered to be noise-dominated and hence unusable.
| Quadrant | # 1 sec bins | Bins with >0 counts | Bins with >2000 counts | High rate bins dominated by noise | Noise dominated (total time) | Noise dominated (detector-on time) | Marked lightcurve |
|---|---|---|---|---|---|---|---|
| A | 1438 | 1438 | 0 | 0 | 0.00% | 0.00% | 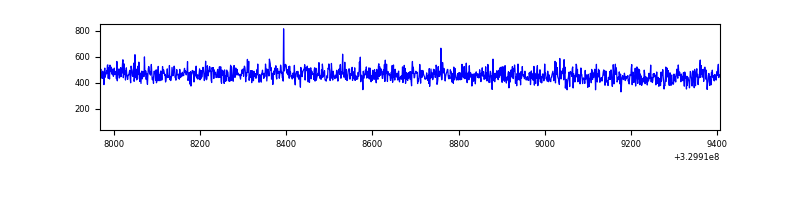 |
| B | 1439 | 1439 | 44 | 44 | 3.06% | 3.06% | 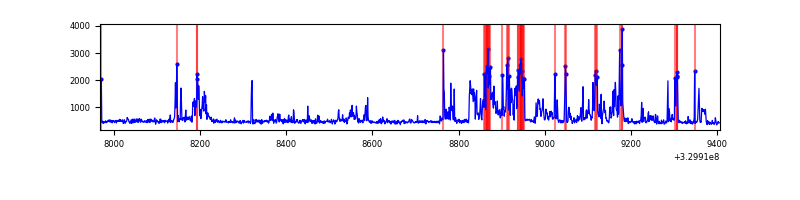 |
| C | 1439 | 1439 | 0 | 0 | 0.00% | 0.00% | 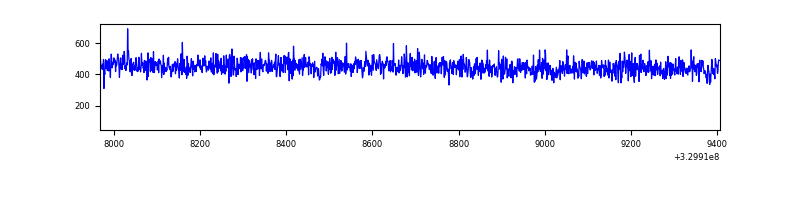 |
| D | 1439 | 1439 | 3 | 3 | 0.21% | 0.21% | 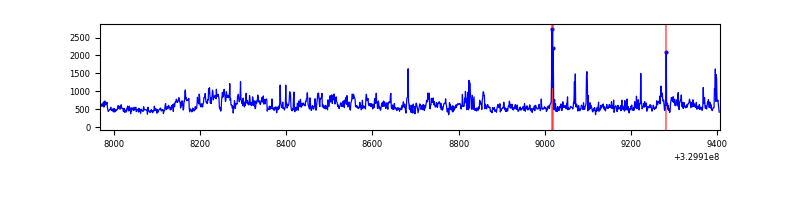 |
Top three noisy pixels from each quadrant. If the there are fewer than three noisy pixels in the level2.evt file, extra rows are filled as -1
| Pixel properties | Quadrant properties | ||||||
|---|---|---|---|---|---|---|---|
| Quadrant | DetID | PixID | Counts | Sigma | Mean | Median | Sigma |
| A | 11 | 208 | 5039 | 135.2 | 170 | 166 | 36.0 |
| A | 13 | 254 | 2221 | 57.01 | 170 | 166 | 36.0 |
| A | 0 | 226 | 1549 | 38.37 | 170 | 166 | 36.0 |
| B | 3 | 64 | 327210 | 9944.1 | 163 | 159 | 32.9 |
| B | 0 | 190 | 17169 | 517.19 | 163 | 159 | 32.9 |
| B | 0 | 229 | 10083 | 301.74 | 163 | 159 | 32.9 |
| C | 14 | 238 | 25004 | 649.29 | 158 | 158 | 38.3 |
| C | 3 | 233 | 1571 | 36.93 | 158 | 158 | 38.3 |
| C | 13 | 61 | 1121 | 25.17 | 158 | 158 | 38.3 |
| D | 7 | 238 | 116547 | 2789.0 | 164 | 158 | 41.7 |
| D | 1 | 52 | 91699 | 2193.58 | 164 | 158 | 41.7 |
| D | 8 | 195 | 46284 | 1105.31 | 164 | 158 | 41.7 |
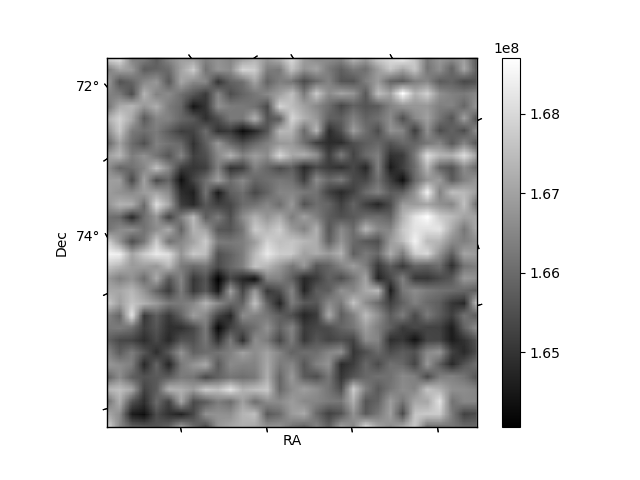
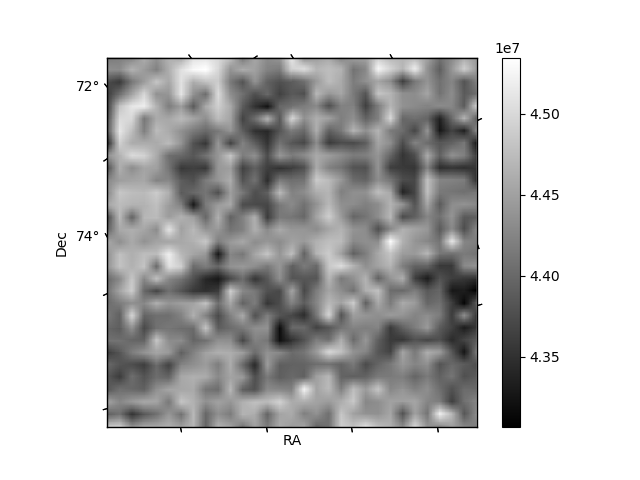
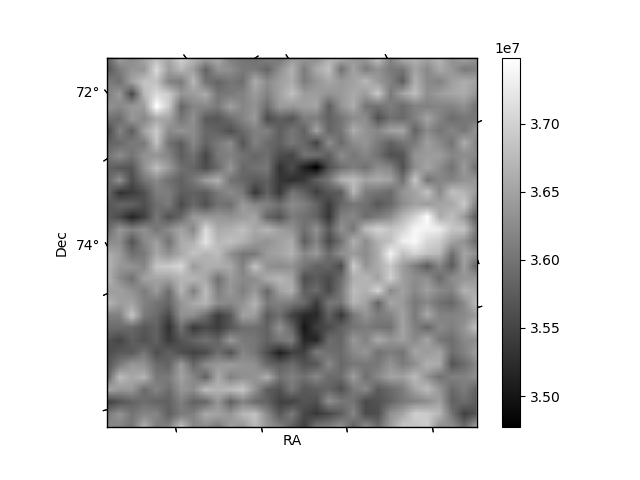
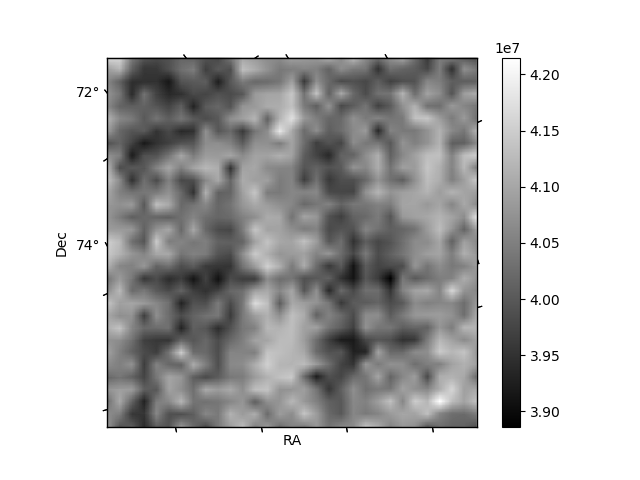
Histogram calculated using DETX and DETY for each event in the final _common_clean file
| Quadrant A | 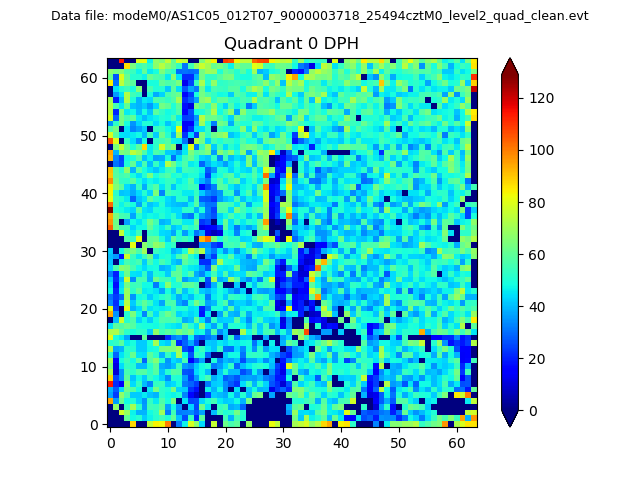 |
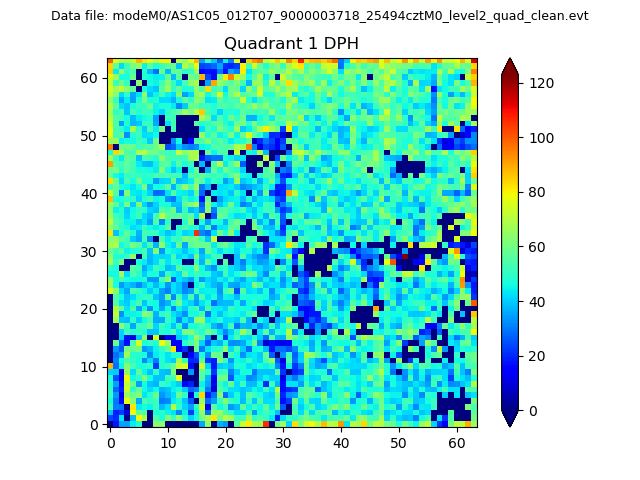 |
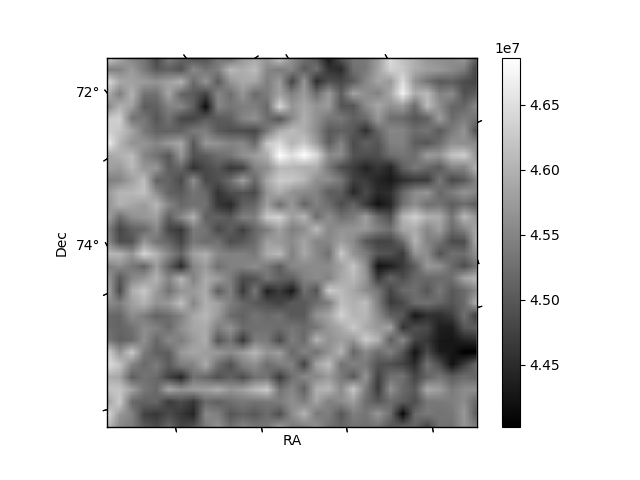
Quadrant B |
|---|---|---|---|
| Quadrant D | 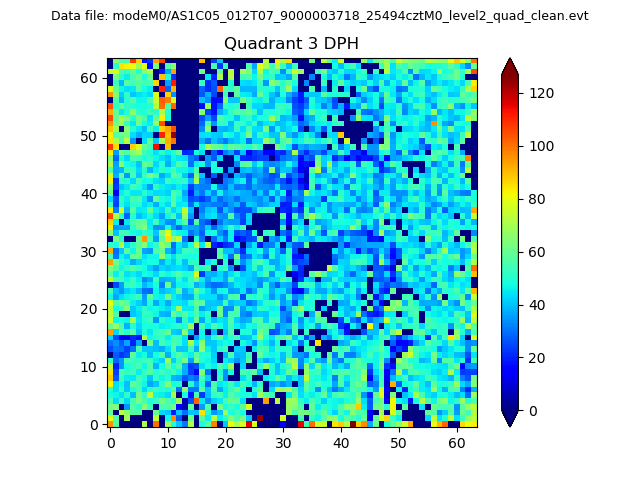 |
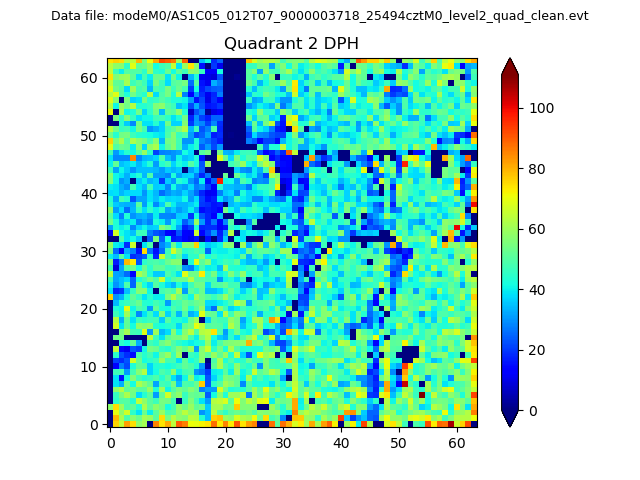 |
Quadrant C |
| Plot type | Count rate plots | Images |
|---|---|---|
| Comparison with Poisson distribution Blue bars denote a histogram of data divided into 1 sec bins. Red curve is a Poisson curve with rate = median count rate of data. |
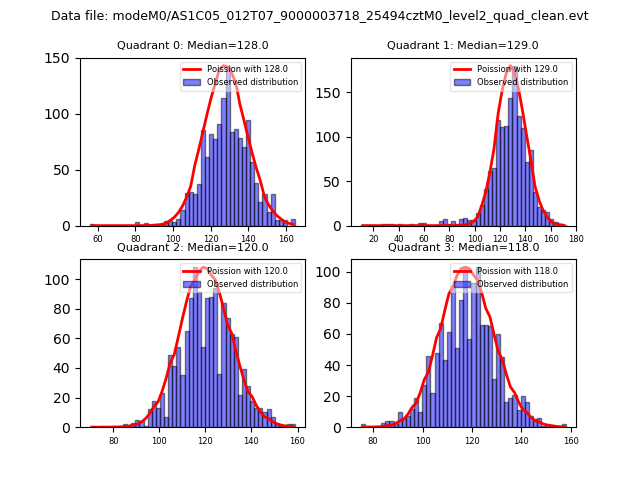 |
 |
| Quadrant-wise count rates Data is divided into 100 sec bins |
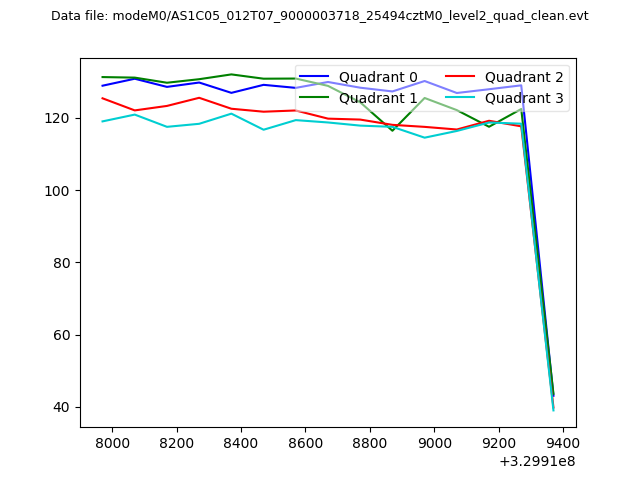 |
|
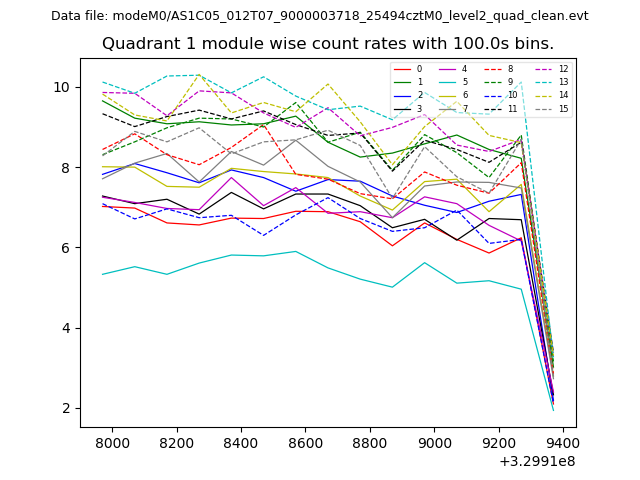
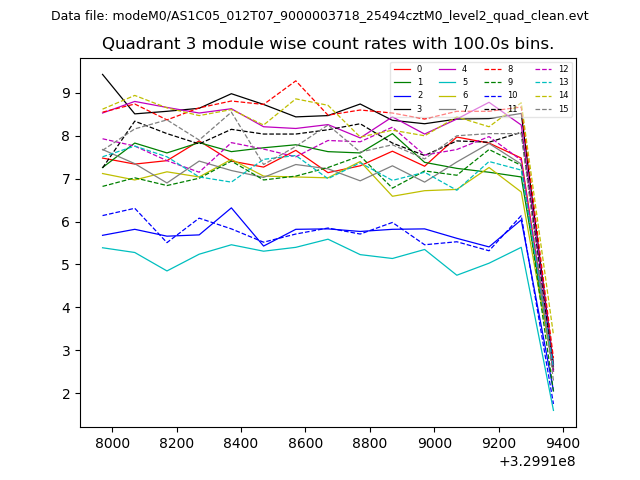
| Module-wise count rates for Quadrant A Data is divided into 100 sec bins |
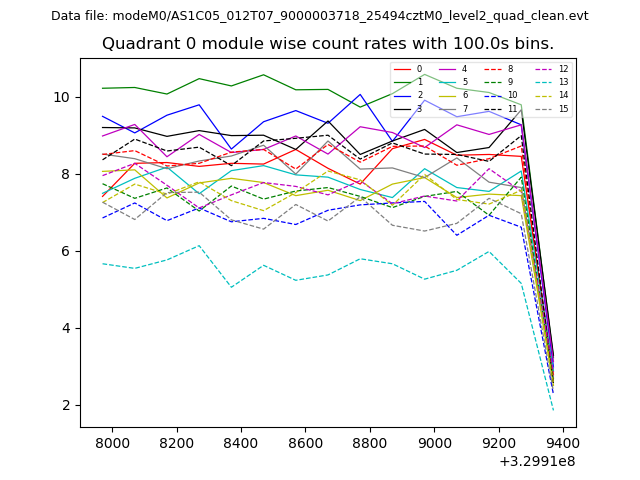 |
 |
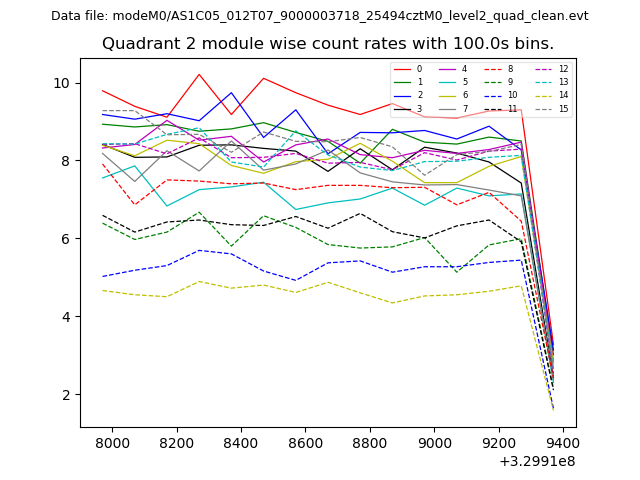
| Module-wise count rates for Quadrant B Data is divided into 100 sec bins |
 |
 |
| Module-wise count rates for Quadrant C Data is divided into 100 sec bins |
 |
 |
| Module-wise count rates for Quadrant D Data is divided into 100 sec bins |
 |
 |
| Parameter | Plot |
|---|---|
| CZT HV Monitor | 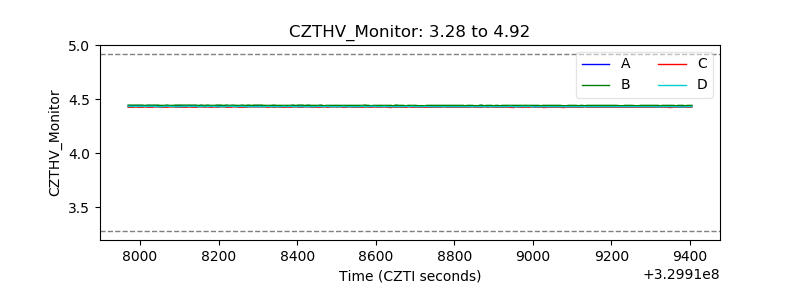 |
| D_VDD | 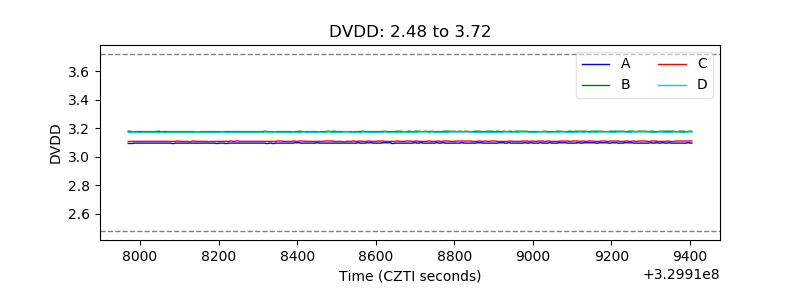 |
| Temperature 1 | 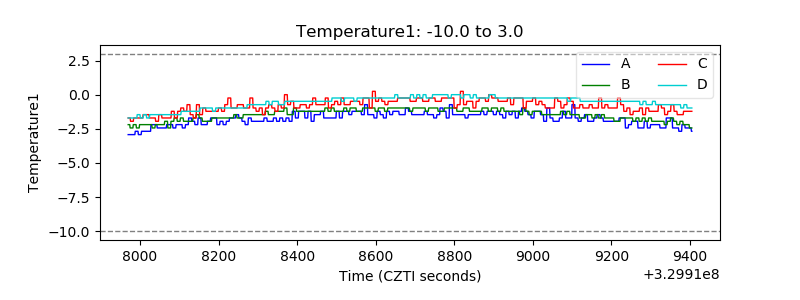 |
| Veto HV Monitor |  |
| Veto LLD | 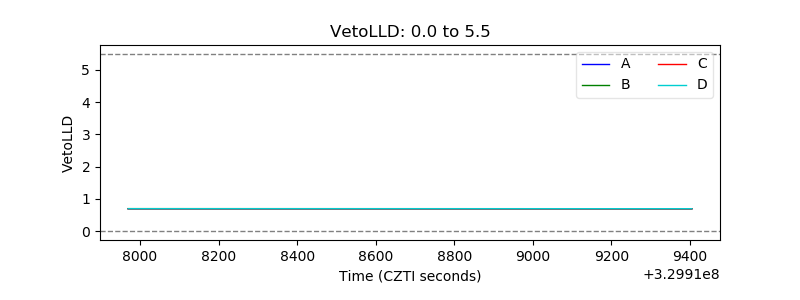 |
| Alpha Counter | 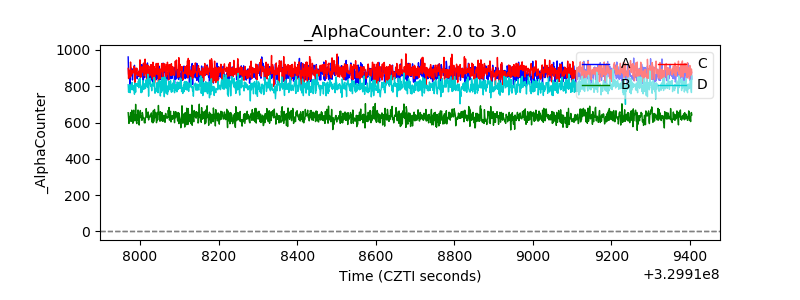 |
| _CPM_Rate | 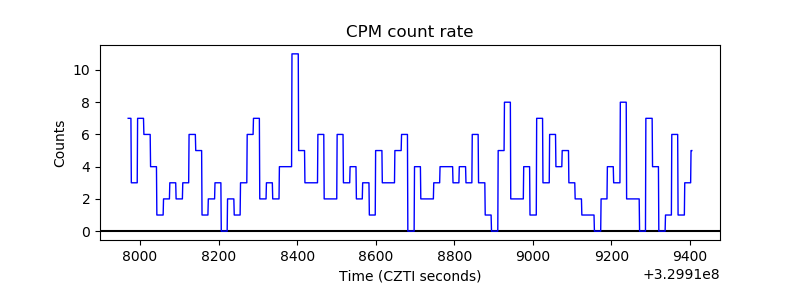 |
| CZT Counter | 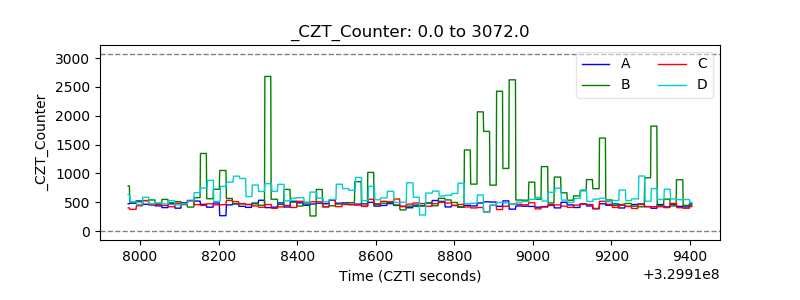 |
| +2.5 Volts monitor | 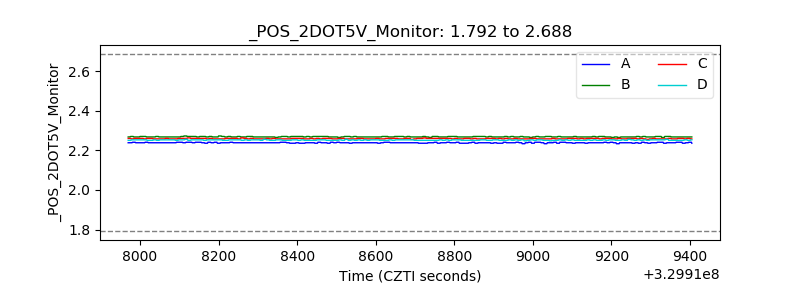 |
| +5 Volts monitor |  |
| _ROLL_ROT | 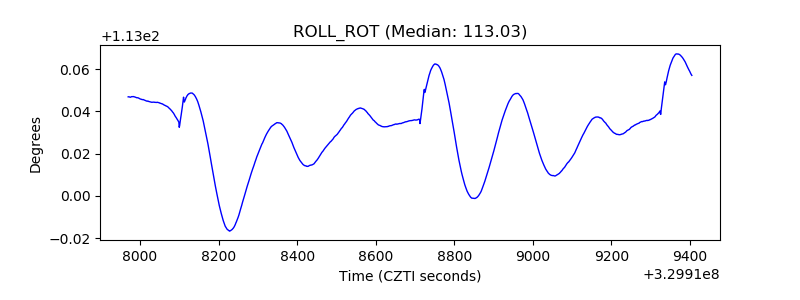 |
| _Roll_DEC | 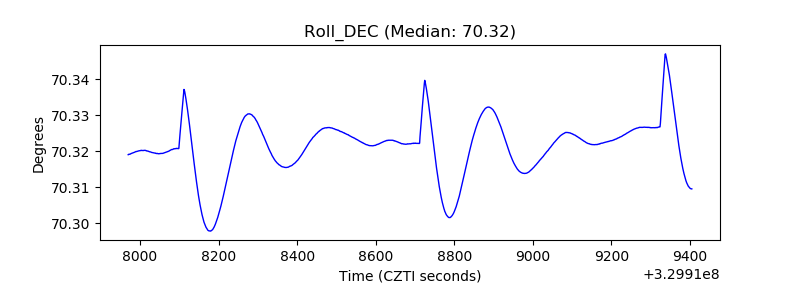 |
| _Roll_RA | 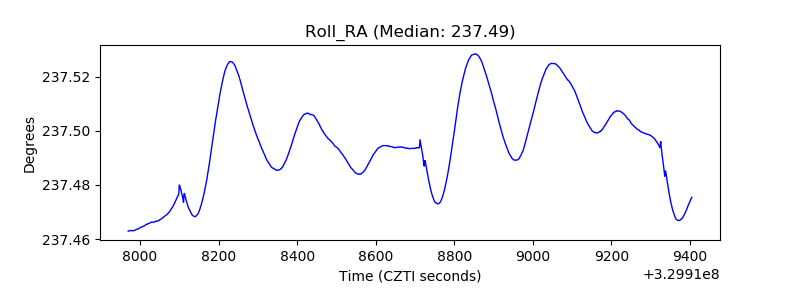 |
| Veto Counter | 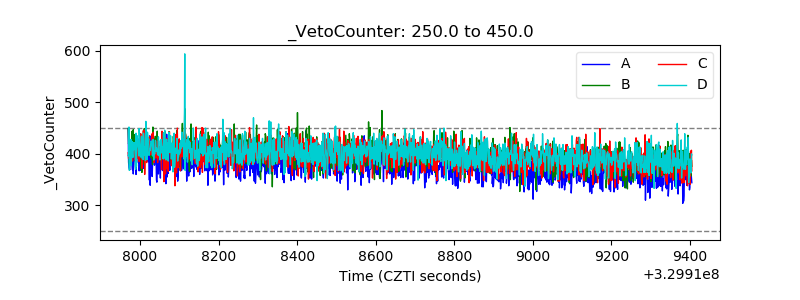 |