| Param | Original file | Final file |
|---|---|---|
| Filename | modeM0/AS1A08_003T17_9000003720_25494cztM0_level2.evt | modeM0/AS1A08_003T17_9000003720_25494cztM0_level2_quad_clean.evt |
| Size (bytes) | 398,122,560 | 53,386,560 |
| Size | 379.7 MB | 50.9 MB |
| Events in quadrant A | 2,308,032 | 339,803 |
| Events in quadrant B | 4,087,044 | 313,452 |
| Events in quadrant C | 2,303,767 | 325,897 |
| Events in quadrant D | 3,046,440 | 315,034 |
| Mode M0 | |||
|---|---|---|---|
| Quadrant | BADHDUFLAG | Total packets | Discarded packets |
| A | 0 | 9671 | 0 |
| B | 0 | 15158 | 0 |
| C | 0 | 9675 | 0 |
| D | 0 | 12016 | 0 |
| Mode M9 | |||
|---|---|---|---|
| Quadrant | BADHDUFLAG | Total packets | Discarded packets |
| A | 0 | 4 | 0 |
| B | 0 | 4 | 0 |
| C | 0 | 4 | 0 |
| D | 0 | 4 | 0 |
| Quadrant | Total seconds | Saturated seconds | Saturation percentage |
|---|---|---|---|
| A | 4585 | 132 | 2.878953% |
| B | 4585 | 747 | 16.292257% |
| C | 4585 | 158 | 3.446020% |
| D | 4584 | 217 | 4.733857% |
Noise dominated data is calculated using 1-second bins in cleaned event files. If a bin has >2000 counts, and if more than 50% of those come from <1% of pixels, then it is considered to be noise-dominated and hence unusable.
| Quadrant | # 1 sec bins | Bins with >0 counts | Bins with >2000 counts | High rate bins dominated by noise | Noise dominated (total time) | Noise dominated (detector-on time) | Marked lightcurve |
|---|---|---|---|---|---|---|---|
| A | 4920 | 4586 | 0 | 0 | 0.00% | 0.00% | 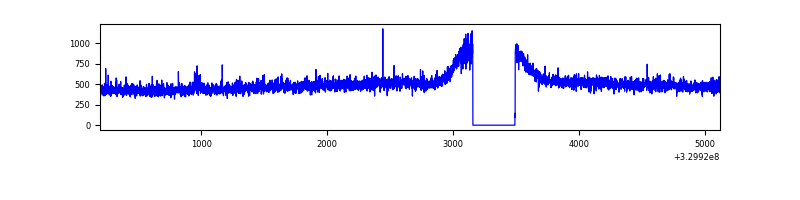 |
| B | 4920 | 4586 | 356 | 356 | 7.24% | 7.76% | 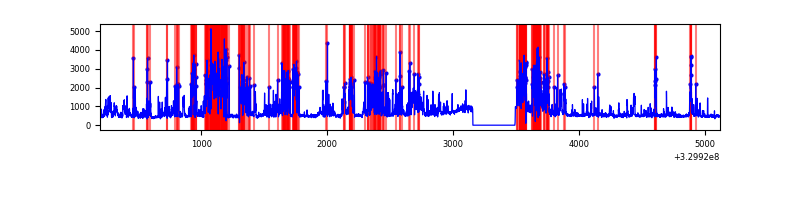 |
| C | 4920 | 4586 | 0 | 0 | 0.00% | 0.00% | 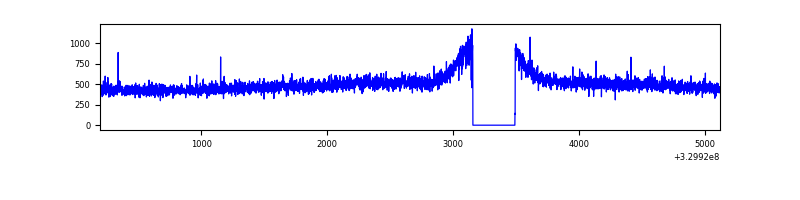 |
| D | 4919 | 4585 | 86 | 86 | 1.75% | 1.88% | 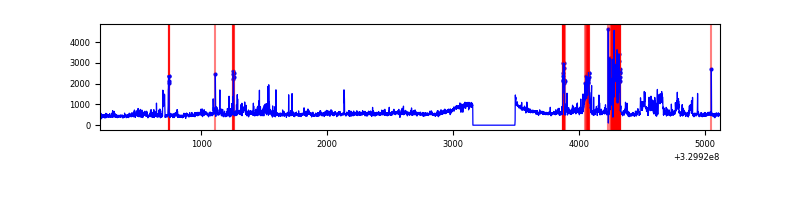 |
Top three noisy pixels from each quadrant. If the there are fewer than three noisy pixels in the level2.evt file, extra rows are filled as -1
| Pixel properties | Quadrant properties | ||||||
|---|---|---|---|---|---|---|---|
| Quadrant | DetID | PixID | Counts | Sigma | Mean | Median | Sigma |
| A | 13 | 254 | 6668 | 49.6 | 595 | 581 | 122.7 |
| A | 11 | 208 | 6228 | 46.01 | 595 | 581 | 122.7 |
| A | 3 | 137 | 5580 | 40.73 | 595 | 581 | 122.7 |
| B | 3 | 64 | 1884429 | 17375.91 | 549 | 535 | 108.4 |
| B | 0 | 190 | 16591 | 148.09 | 549 | 535 | 108.4 |
| B | 0 | 245 | 14976 | 133.2 | 549 | 535 | 108.4 |
| C | 14 | 238 | 90403 | 663.31 | 566 | 569 | 135.4 |
| C | 13 | 61 | 3926 | 24.78 | 566 | 569 | 135.4 |
| C | 2 | 16 | 3088 | 18.6 | 566 | 569 | 135.4 |
| D | 12 | 233 | 312493 | 2203.01 | 573 | 557 | 141.6 |
| D | 1 | 52 | 281645 | 1985.15 | 573 | 557 | 141.6 |
| D | 8 | 195 | 194283 | 1368.17 | 573 | 557 | 141.6 |
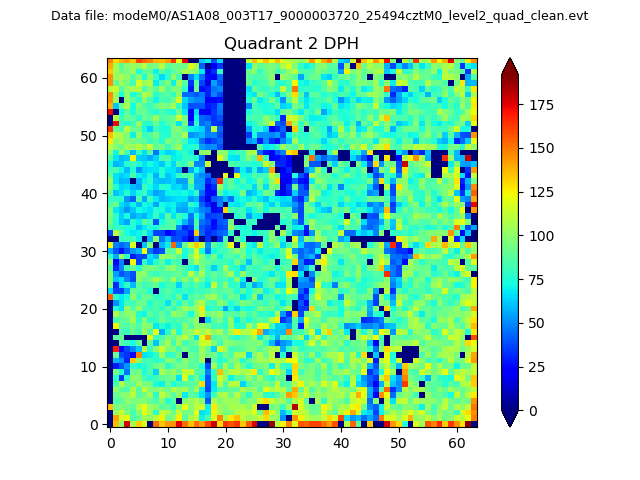
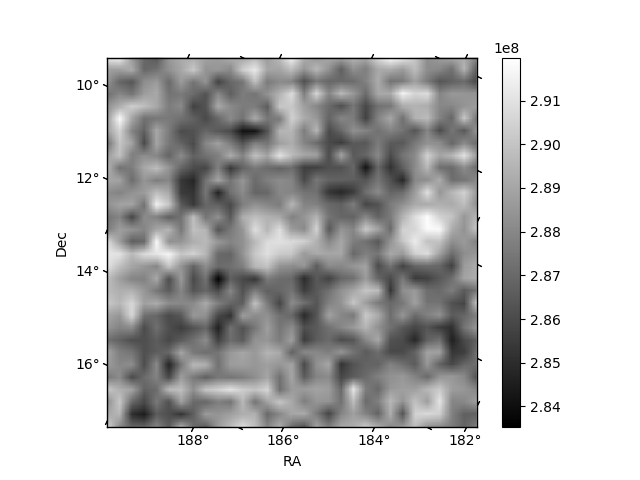
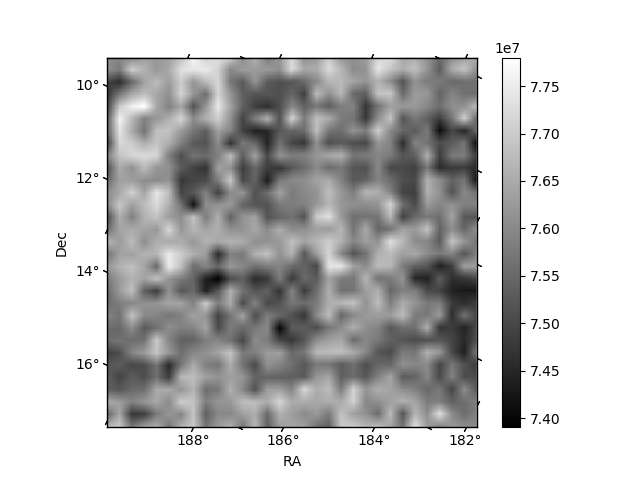
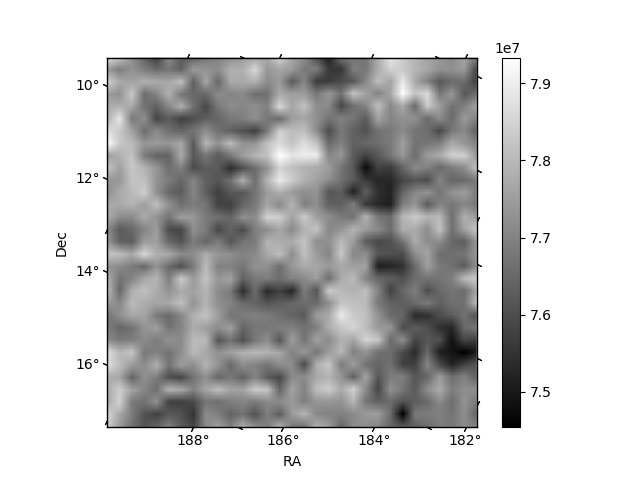
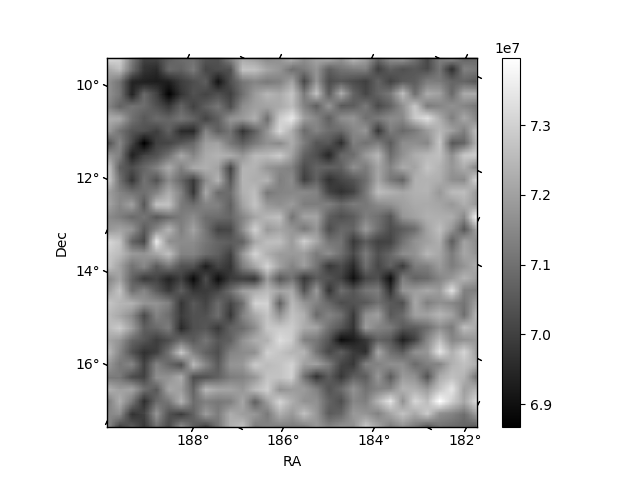
Histogram calculated using DETX and DETY for each event in the final _common_clean file
| Quadrant A | 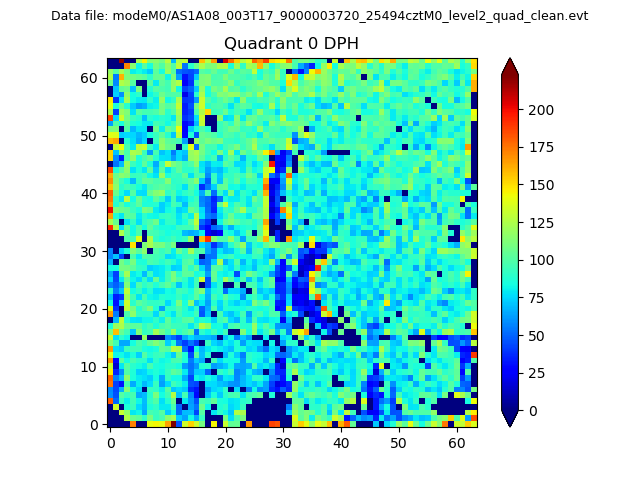 |
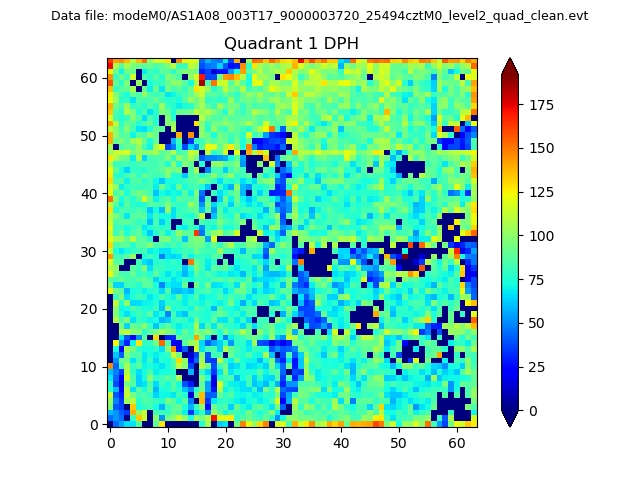 |
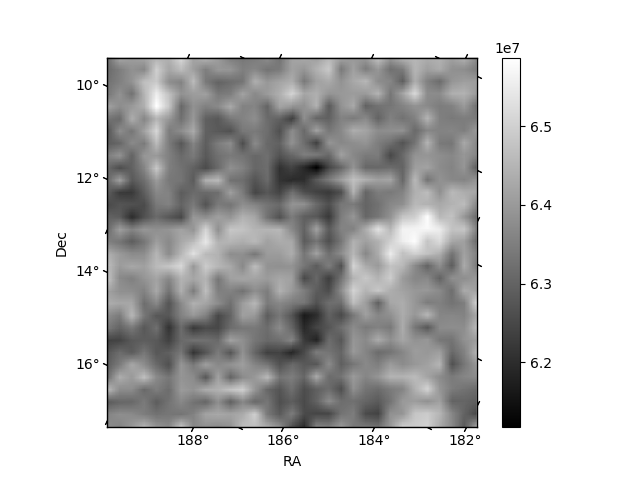
Quadrant B |
|---|---|---|---|
| Quadrant D | 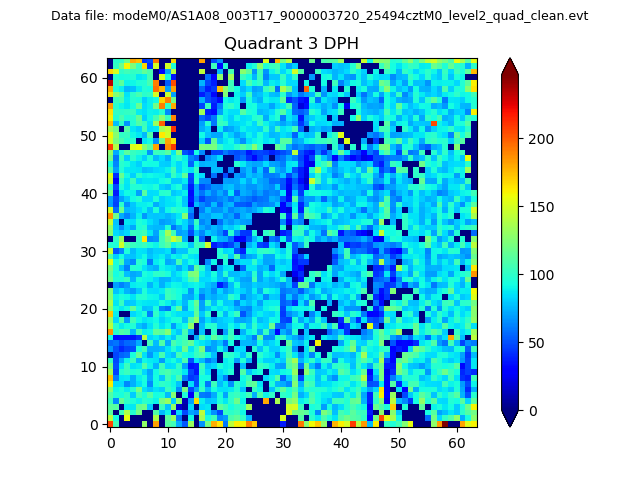 |
 |
Quadrant C |
| Plot type | Count rate plots | Images |
|---|---|---|
| Comparison with Poisson distribution Blue bars denote a histogram of data divided into 1 sec bins. Red curve is a Poisson curve with rate = median count rate of data. |
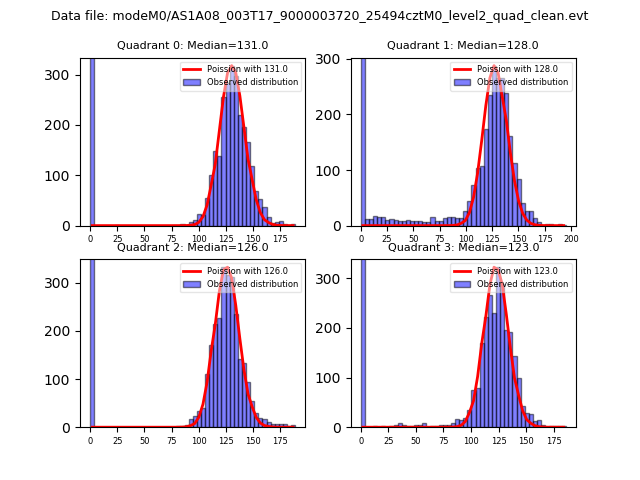 |
 |
| Quadrant-wise count rates Data is divided into 100 sec bins |
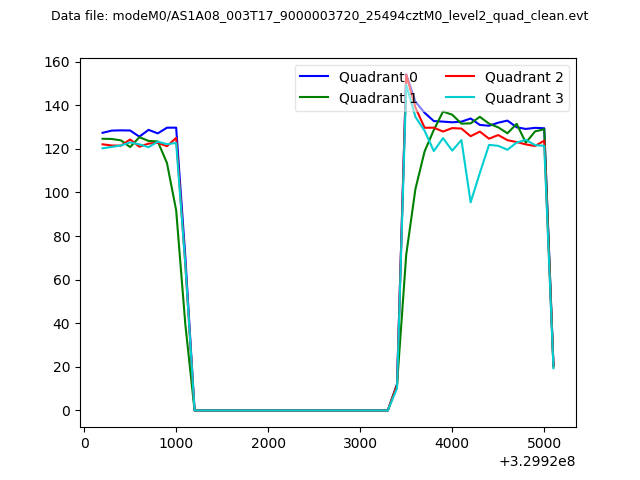 |
|
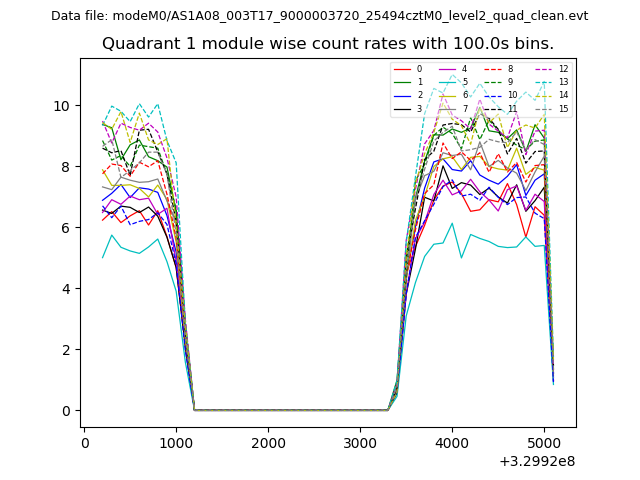
| Module-wise count rates for Quadrant A Data is divided into 100 sec bins |
 |
 |
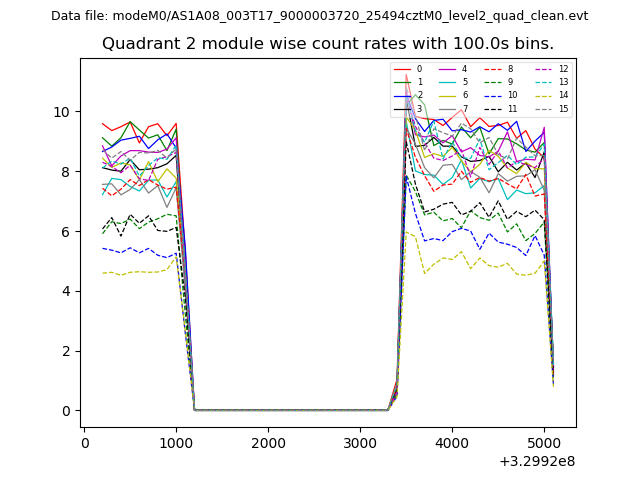
| Module-wise count rates for Quadrant B Data is divided into 100 sec bins |
 |
 |
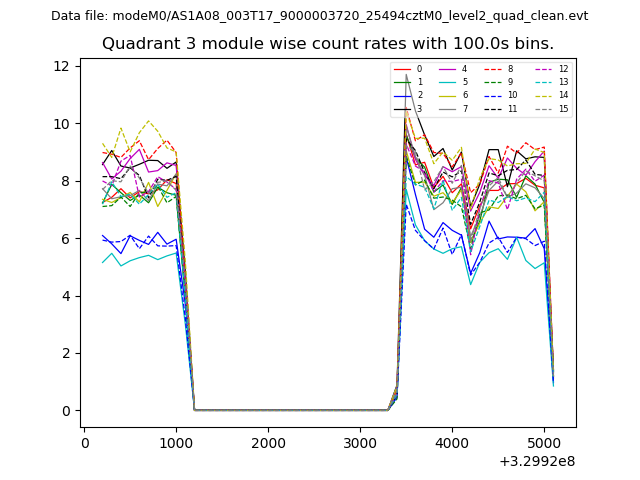
| Module-wise count rates for Quadrant C Data is divided into 100 sec bins |
 |
 |
| Module-wise count rates for Quadrant D Data is divided into 100 sec bins |
 |
 |
| Parameter | Plot |
|---|---|
| CZT HV Monitor | 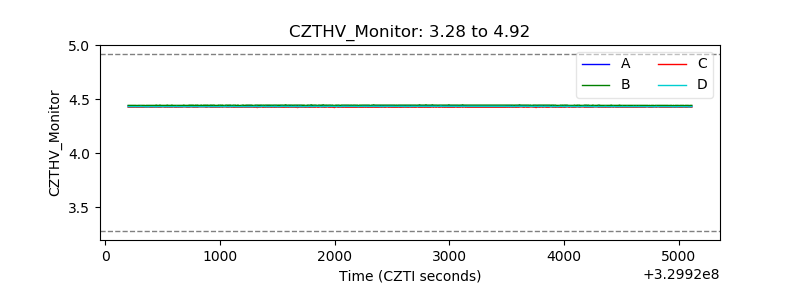 |
| D_VDD | 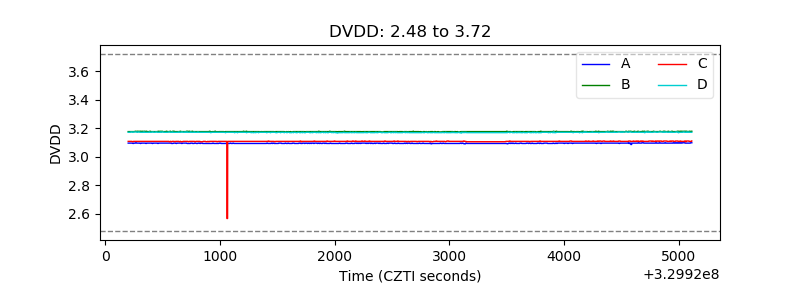 |
| Temperature 1 | 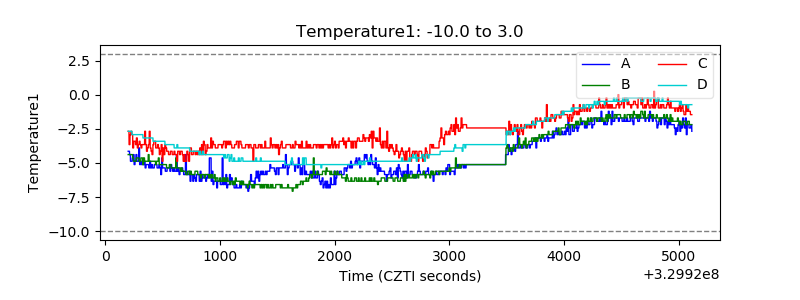 |
| Veto HV Monitor | 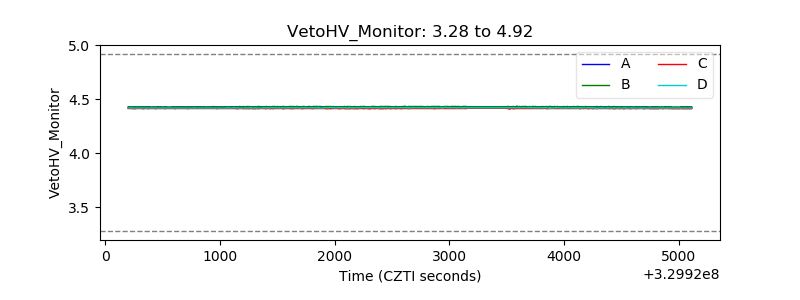 |
| Veto LLD | 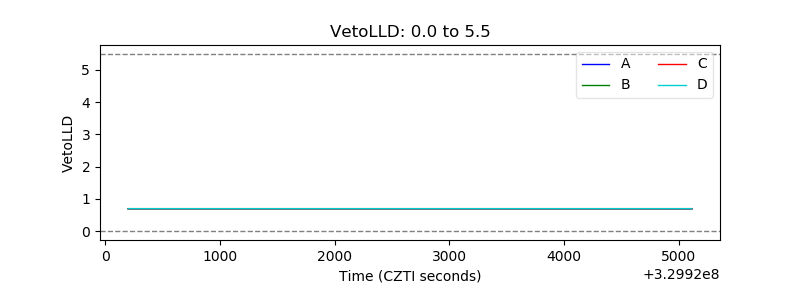 |
| Alpha Counter | 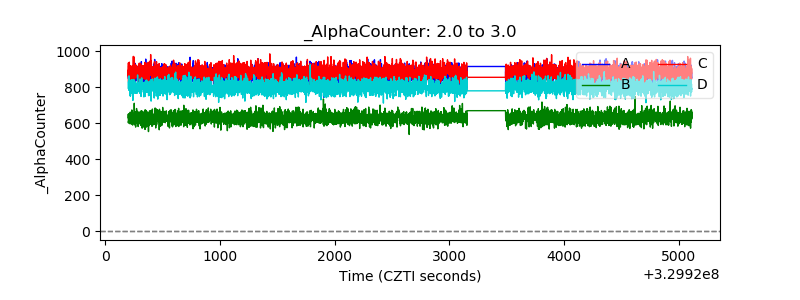 |
| _CPM_Rate | 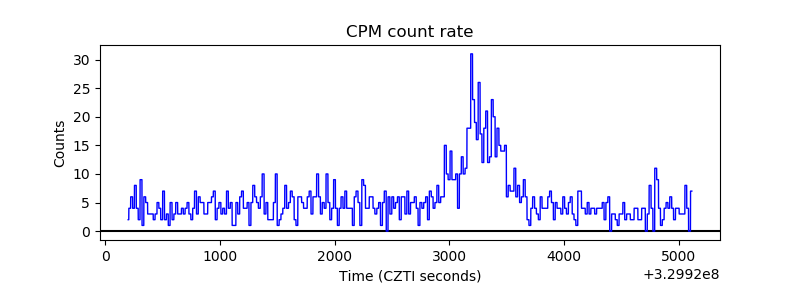 |
| CZT Counter | 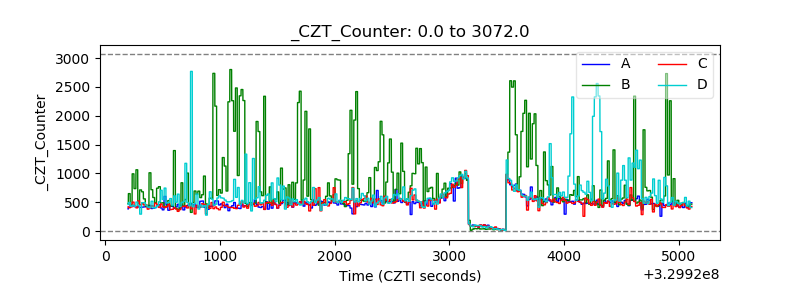 |
| +2.5 Volts monitor |  |
| +5 Volts monitor |  |
| _ROLL_ROT | 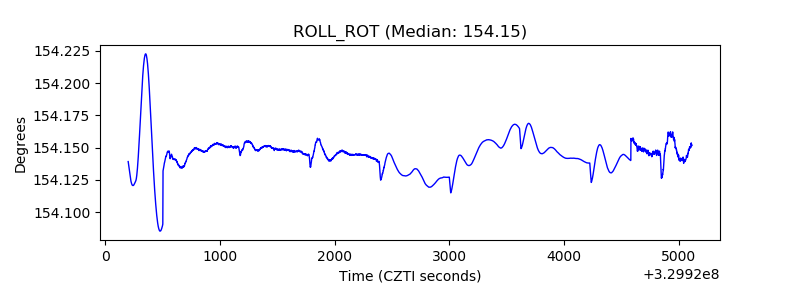 |
| _Roll_DEC | 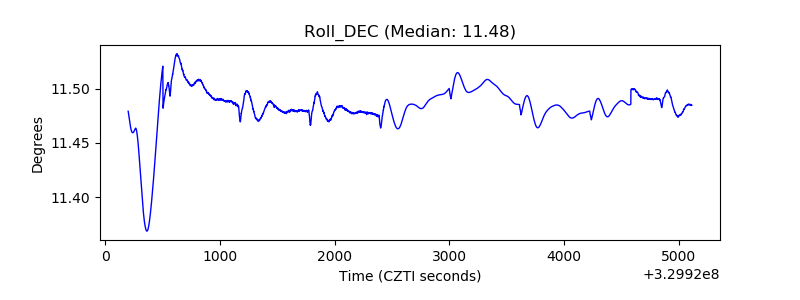 |
| _Roll_RA | 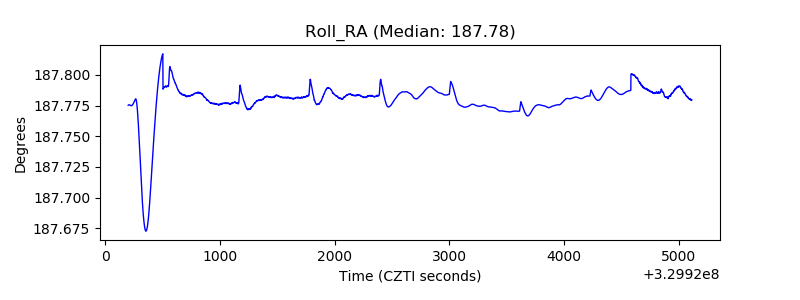 |
| Veto Counter |  |