| Param | Original file | Final file |
|---|---|---|
| Filename | modeM0/AS1A08_003T17_9000003720_25495cztM0_level2.evt | modeM0/AS1A08_003T17_9000003720_25495cztM0_level2_quad_clean.evt |
| Size (bytes) | 598,020,480 | 92,666,880 |
| Size | 570.3 MB | 88.4 MB |
| Events in quadrant A | 3,375,712 | 614,966 |
| Events in quadrant B | 5,899,034 | 543,976 |
| Events in quadrant C | 3,446,720 | 588,275 |
| Events in quadrant D | 4,914,017 | 569,974 |
| Mode M0 | |||
|---|---|---|---|
| Quadrant | BADHDUFLAG | Total packets | Discarded packets |
| A | 0 | 14555 | 0 |
| B | 0 | 21946 | 0 |
| C | 0 | 14750 | 0 |
| D | 0 | 19328 | 0 |
| Mode M9 | |||
|---|---|---|---|
| Quadrant | BADHDUFLAG | Total packets | Discarded packets |
| A | 0 | 2 | 0 |
| B | 0 | 2 | 0 |
| C | 0 | 2 | 0 |
| D | 0 | 2 | 0 |
| Quadrant | Total seconds | Saturated seconds | Saturation percentage |
|---|---|---|---|
| A | 7007 | 116 | 1.655487% |
| B | 7008 | 1040 | 14.840183% |
| C | 7008 | 170 | 2.425799% |
| D | 7008 | 264 | 3.767123% |
Noise dominated data is calculated using 1-second bins in cleaned event files. If a bin has >2000 counts, and if more than 50% of those come from <1% of pixels, then it is considered to be noise-dominated and hence unusable.
| Quadrant | # 1 sec bins | Bins with >0 counts | Bins with >2000 counts | High rate bins dominated by noise | Noise dominated (total time) | Noise dominated (detector-on time) | Marked lightcurve |
|---|---|---|---|---|---|---|---|
| A | 7262 | 7008 | 0 | 0 | 0.00% | 0.00% | 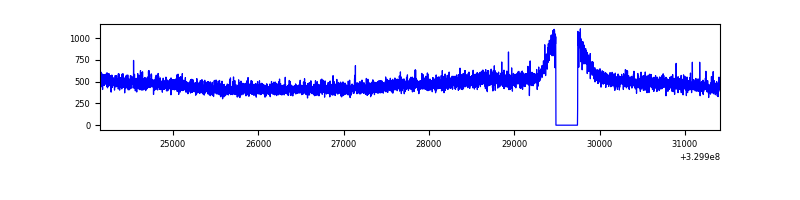 |
| B | 7263 | 7009 | 612 | 612 | 8.43% | 8.73% | 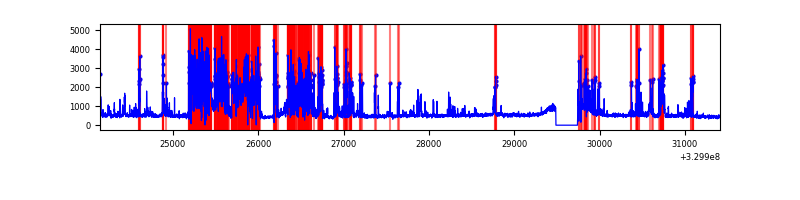 |
| C | 7263 | 7009 | 1 | 1 | 0.01% | 0.01% | 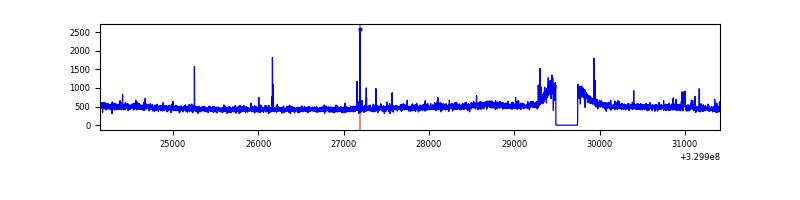 |
| D | 7263 | 7009 | 89 | 89 | 1.23% | 1.27% | 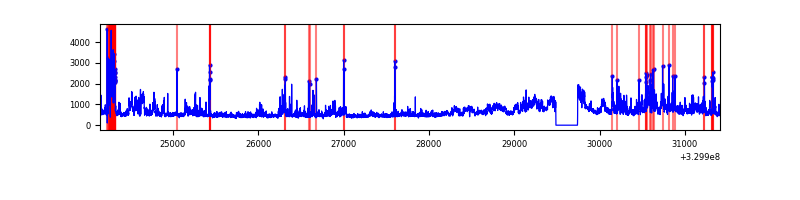 |
Top three noisy pixels from each quadrant. If the there are fewer than three noisy pixels in the level2.evt file, extra rows are filled as -1
| Pixel properties | Quadrant properties | ||||||
|---|---|---|---|---|---|---|---|
| Quadrant | DetID | PixID | Counts | Sigma | Mean | Median | Sigma |
| A | 13 | 254 | 9742 | 50.12 | 874 | 854 | 177.3 |
| A | 3 | 137 | 8117 | 40.96 | 874 | 854 | 177.3 |
| A | 0 | 226 | 7495 | 37.45 | 874 | 854 | 177.3 |
| B | 3 | 64 | 2686450 | 17185.06 | 804 | 783 | 156.3 |
| B | 0 | 190 | 25307 | 156.92 | 804 | 783 | 156.3 |
| B | 0 | 245 | 23860 | 147.67 | 804 | 783 | 156.3 |
| C | 14 | 238 | 130656 | 657.79 | 833 | 837 | 197.4 |
| C | 2 | 16 | 38712 | 191.91 | 833 | 837 | 197.4 |
| C | 0 | 239 | 26851 | 131.81 | 833 | 837 | 197.4 |
| D | 1 | 52 | 530434 | 2571.35 | 842 | 819 | 206.0 |
| D | 7 | 238 | 471824 | 2286.79 | 842 | 819 | 206.0 |
| D | 8 | 195 | 355433 | 1721.7 | 842 | 819 | 206.0 |
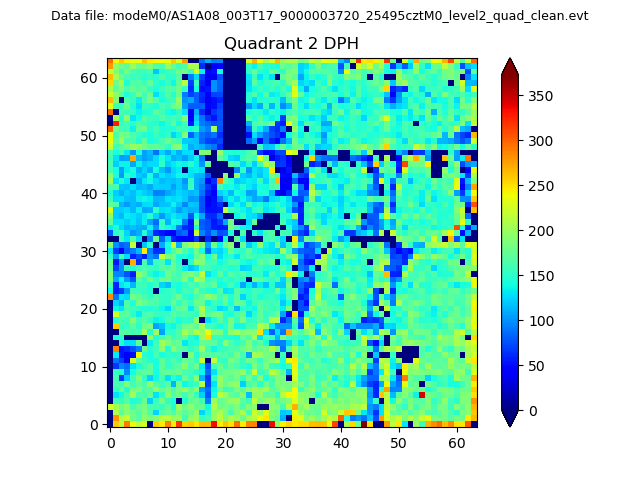
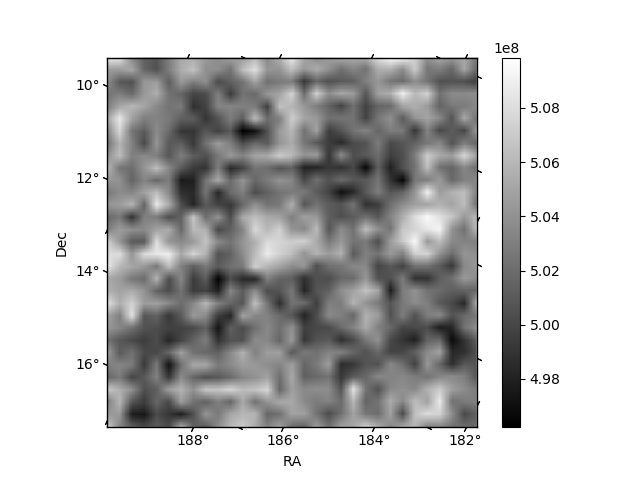
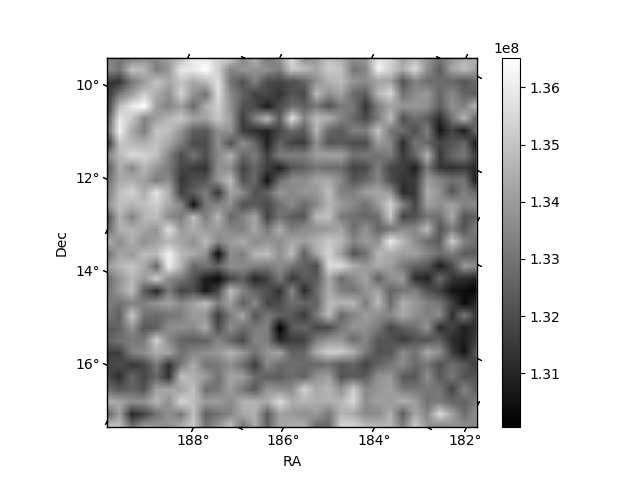
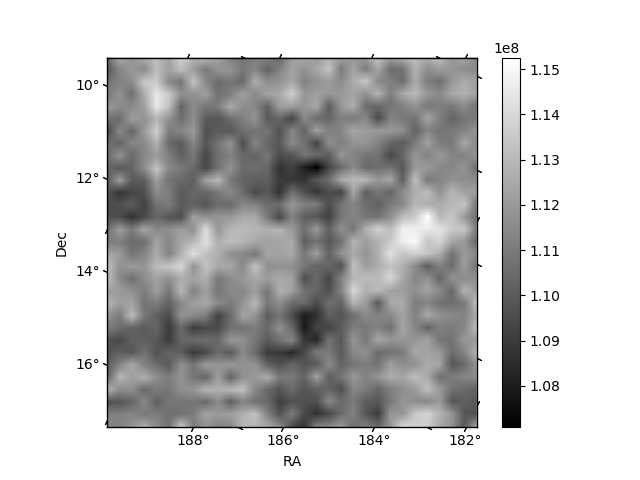
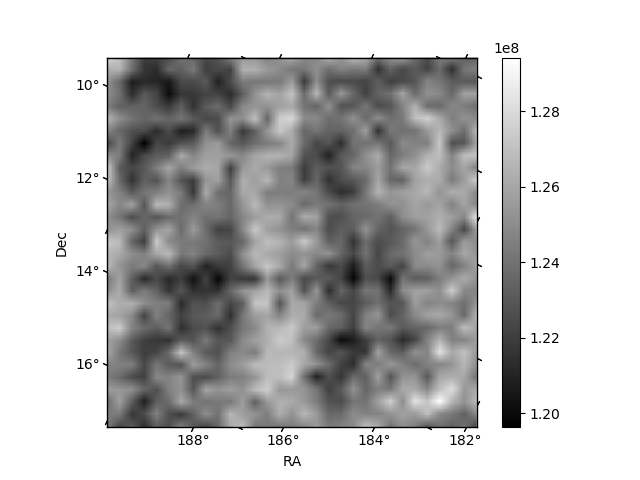
Histogram calculated using DETX and DETY for each event in the final _common_clean file
| Quadrant A | 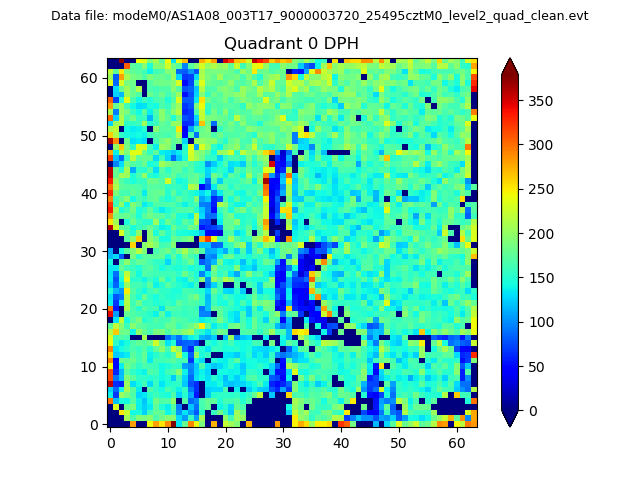 |
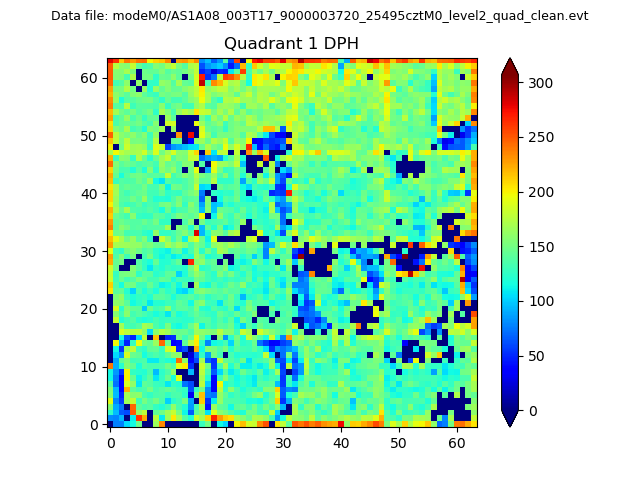 |
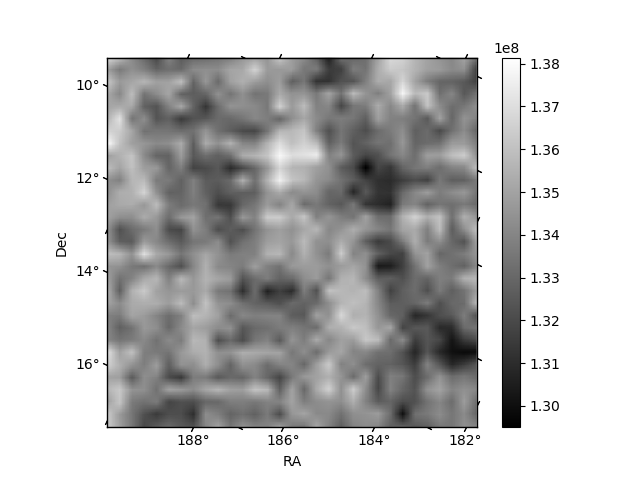
Quadrant B |
|---|---|---|---|
| Quadrant D | 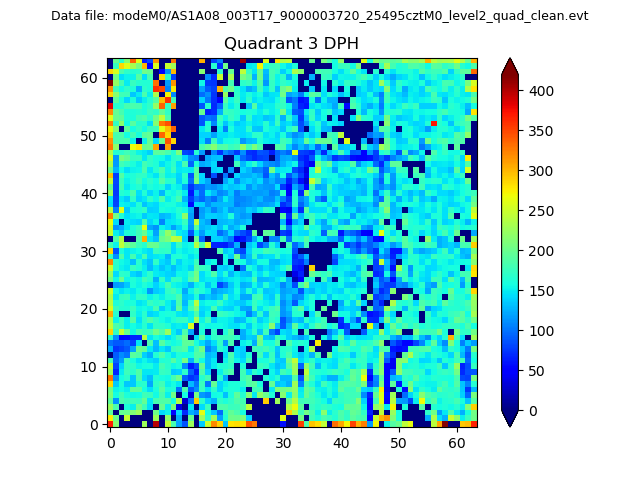 |
 |
Quadrant C |
| Plot type | Count rate plots | Images |
|---|---|---|
| Comparison with Poisson distribution Blue bars denote a histogram of data divided into 1 sec bins. Red curve is a Poisson curve with rate = median count rate of data. |
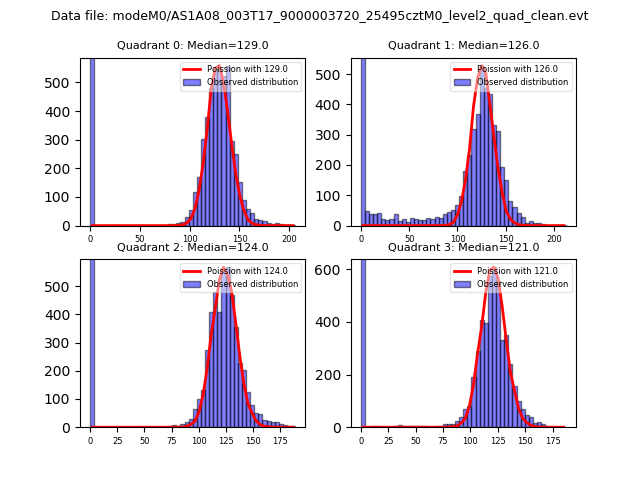 |
 |
| Quadrant-wise count rates Data is divided into 100 sec bins |
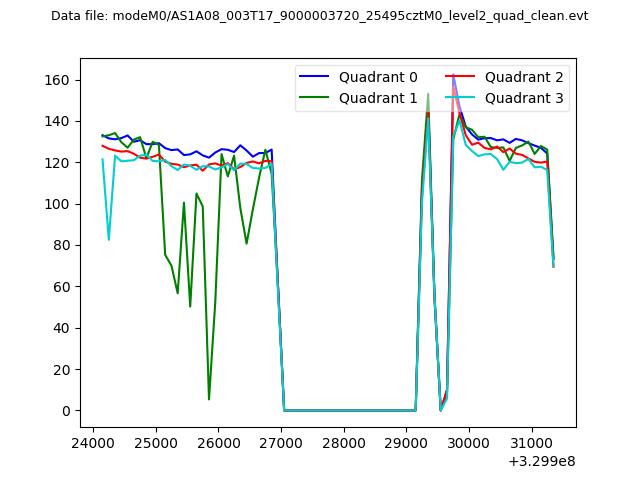 |
|
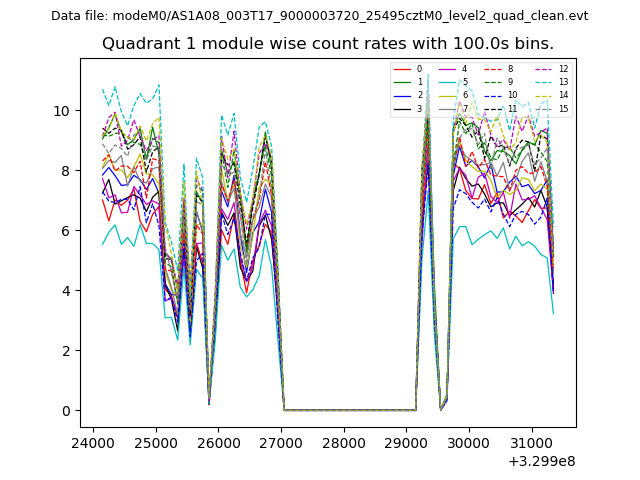
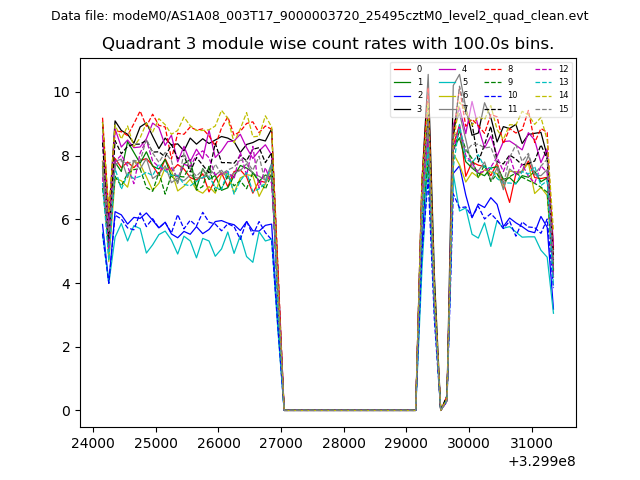
| Module-wise count rates for Quadrant A Data is divided into 100 sec bins |
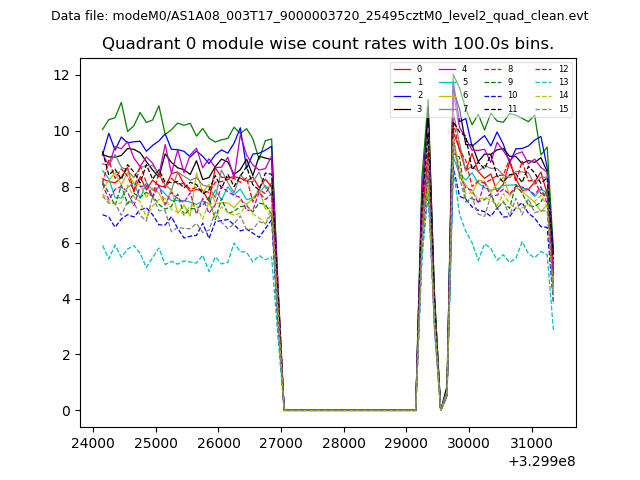 |
 |
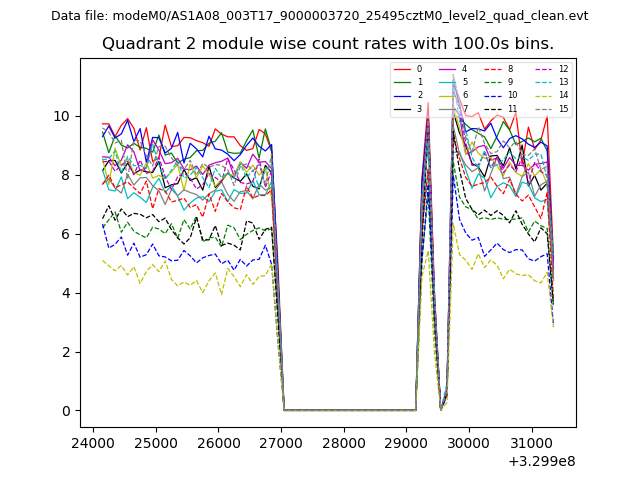
| Module-wise count rates for Quadrant B Data is divided into 100 sec bins |
 |
 |
| Module-wise count rates for Quadrant C Data is divided into 100 sec bins |
 |
 |
| Module-wise count rates for Quadrant D Data is divided into 100 sec bins |
 |
 |
| Parameter | Plot |
|---|---|
| CZT HV Monitor | 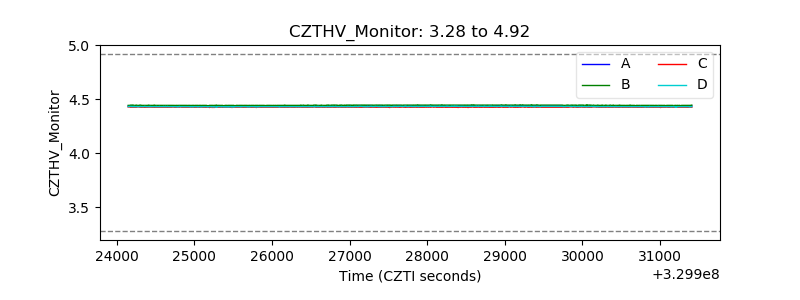 |
| D_VDD | 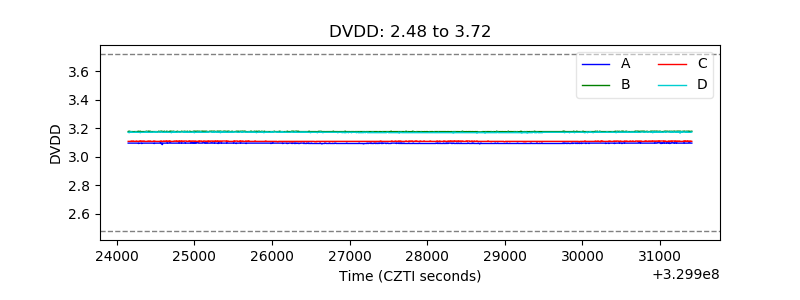 |
| Temperature 1 | 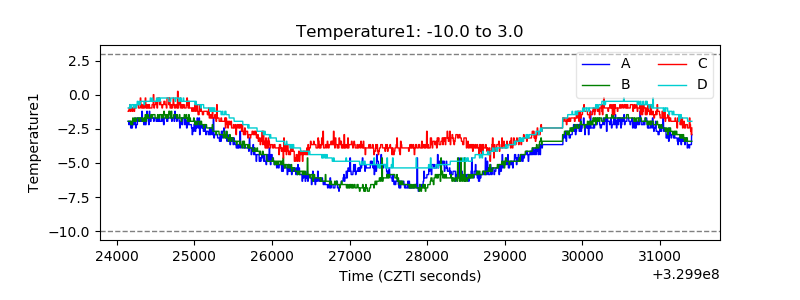 |
| Veto HV Monitor | 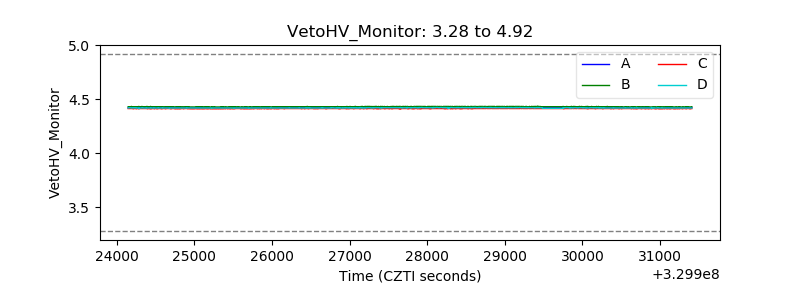 |
| Veto LLD | 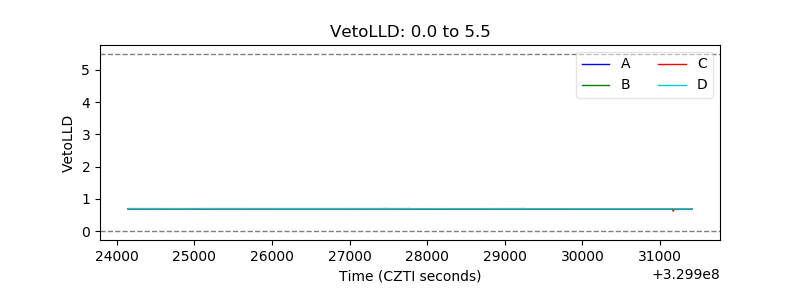 |
| Alpha Counter | 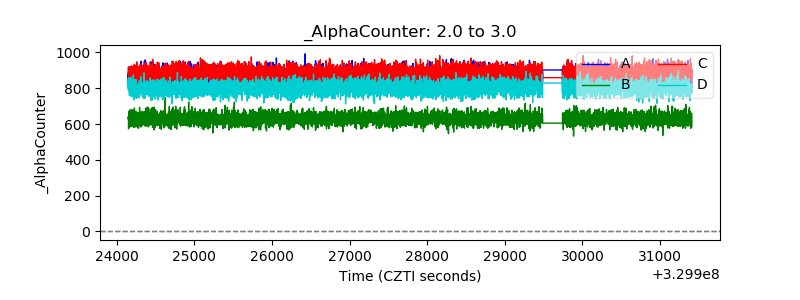 |
| _CPM_Rate | 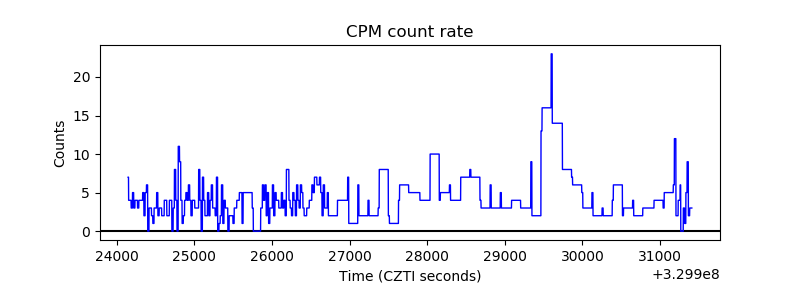 |
| CZT Counter |  |
| +2.5 Volts monitor | 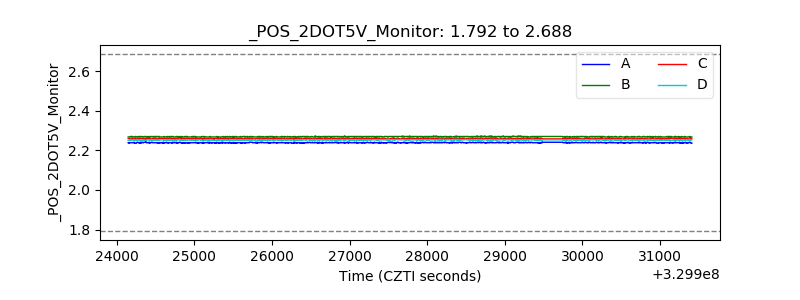 |
| +5 Volts monitor |  |
| _ROLL_ROT | 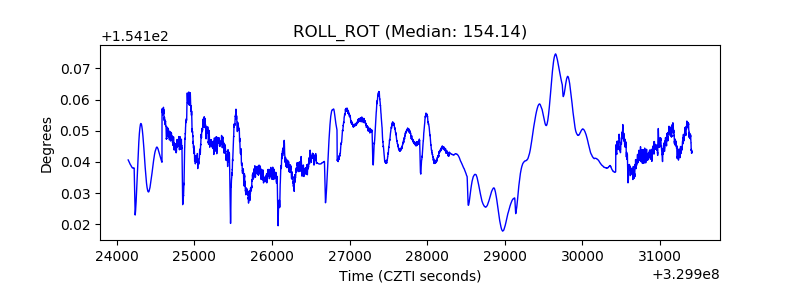 |
| _Roll_DEC | 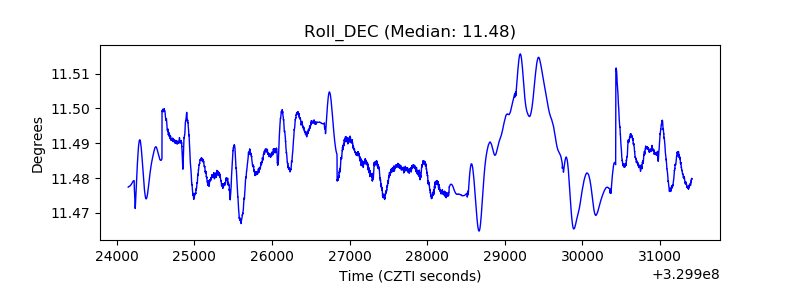 |
| _Roll_RA |  |
| Veto Counter | 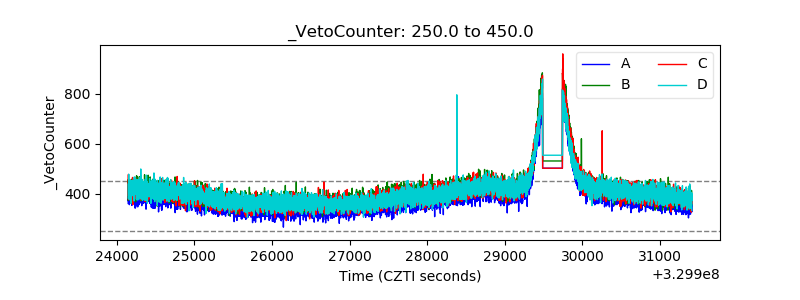 |