| Param | Original file | Final file |
|---|---|---|
| Filename | modeM0/AS1A08_003T17_9000003720_25498cztM0_level2.evt | modeM0/AS1A08_003T17_9000003720_25498cztM0_level2_quad_clean.evt |
| Size (bytes) | 1,500,595,200 | 236,073,600 |
| Size | 1.4 GB | 225.1 MB |
| Events in quadrant A | 8,716,244 | 1,523,720 |
| Events in quadrant B | 13,486,338 | 1,463,711 |
| Events in quadrant C | 8,880,960 | 1,465,348 |
| Events in quadrant D | 13,107,027 | 1,414,948 |
| Mode M0 | |||
|---|---|---|---|
| Quadrant | BADHDUFLAG | Total packets | Discarded packets |
| A | 0 | 38231 | 0 |
| B | 0 | 52132 | 0 |
| C | 0 | 38404 | 0 |
| D | 0 | 51810 | 0 |
| Mode M9 | |||
|---|---|---|---|
| Quadrant | BADHDUFLAG | Total packets | Discarded packets |
| A | 0 | 17 | 0 |
| B | 0 | 17 | 0 |
| C | 0 | 17 | 0 |
| D | 0 | 17 | 0 |
| Quadrant | Total seconds | Saturated seconds | Saturation percentage |
|---|---|---|---|
| A | 18595 | 127 | 0.682979% |
| B | 18596 | 1590 | 8.550226% |
| C | 18596 | 247 | 1.328243% |
| D | 18596 | 431 | 2.317703% |
Noise dominated data is calculated using 1-second bins in cleaned event files. If a bin has >2000 counts, and if more than 50% of those come from <1% of pixels, then it is considered to be noise-dominated and hence unusable.
| Quadrant | # 1 sec bins | Bins with >0 counts | Bins with >2000 counts | High rate bins dominated by noise | Noise dominated (total time) | Noise dominated (detector-on time) | Marked lightcurve |
|---|---|---|---|---|---|---|---|
| A | 20390 | 18599 | 0 | 0 | 0.00% | 0.00% | 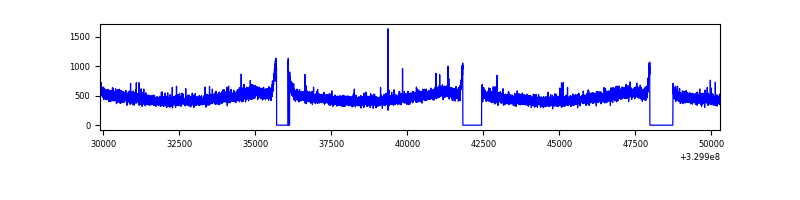 |
| B | 20391 | 18600 | 1088 | 1088 | 5.34% | 5.85% | 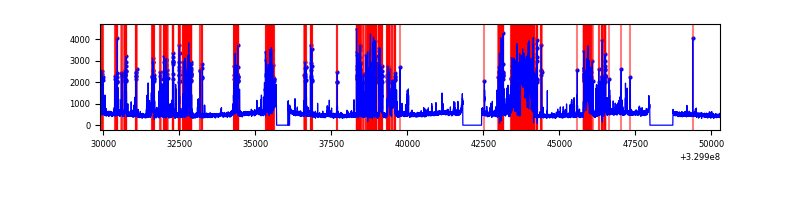 |
| C | 20391 | 18600 | 2 | 2 | 0.01% | 0.01% | 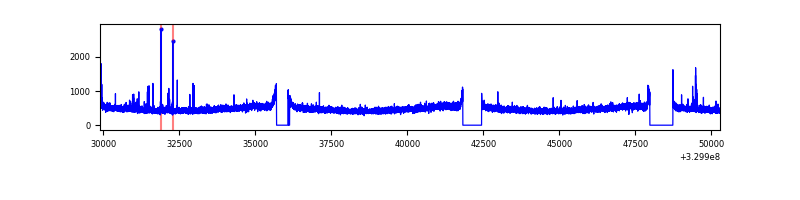 |
| D | 20391 | 18600 | 210 | 210 | 1.03% | 1.13% | 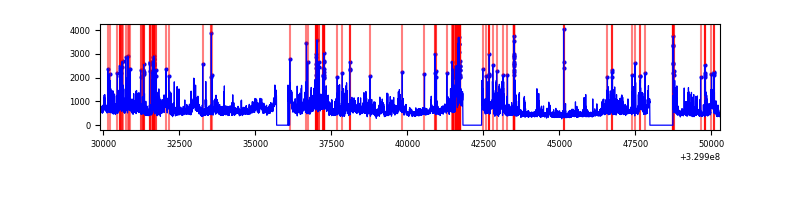 |
Top three noisy pixels from each quadrant. If the there are fewer than three noisy pixels in the level2.evt file, extra rows are filled as -1
| Pixel properties | Quadrant properties | ||||||
|---|---|---|---|---|---|---|---|
| Quadrant | DetID | PixID | Counts | Sigma | Mean | Median | Sigma |
| A | 13 | 254 | 29126 | 59.12 | 2258 | 2210 | 455.3 |
| A | 3 | 137 | 21281 | 41.89 | 2258 | 2210 | 455.3 |
| A | 0 | 226 | 19222 | 37.37 | 2258 | 2210 | 455.3 |
| B | 3 | 64 | 4769126 | 11487.32 | 2170 | 2118 | 415.0 |
| B | 3 | 112 | 97028 | 228.71 | 2170 | 2118 | 415.0 |
| B | 12 | 111 | 51646 | 119.35 | 2170 | 2118 | 415.0 |
| C | 14 | 238 | 342038 | 670.49 | 2162 | 2177 | 506.9 |
| C | 2 | 16 | 62495 | 119.0 | 2162 | 2177 | 506.9 |
| C | 5 | 112 | 17666 | 30.56 | 2162 | 2177 | 506.9 |
| D | 8 | 195 | 1808111 | 3403.82 | 2179 | 2117 | 530.6 |
| D | 1 | 52 | 1439786 | 2709.63 | 2179 | 2117 | 530.6 |
| D | 7 | 238 | 705265 | 1325.25 | 2179 | 2117 | 530.6 |
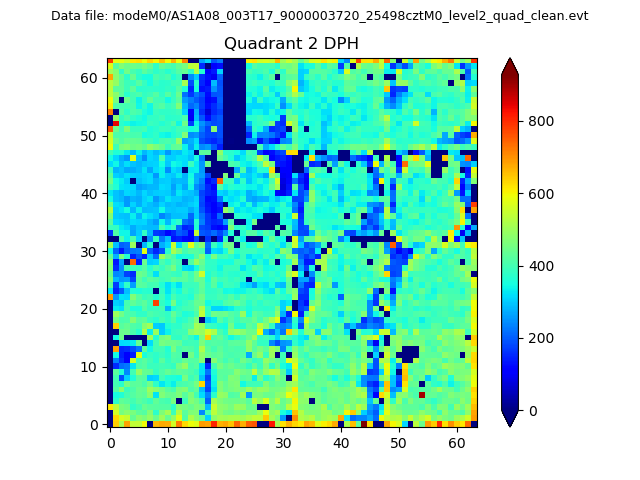
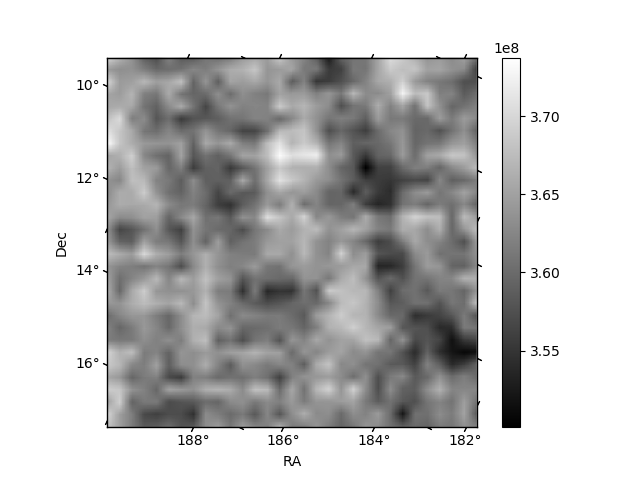
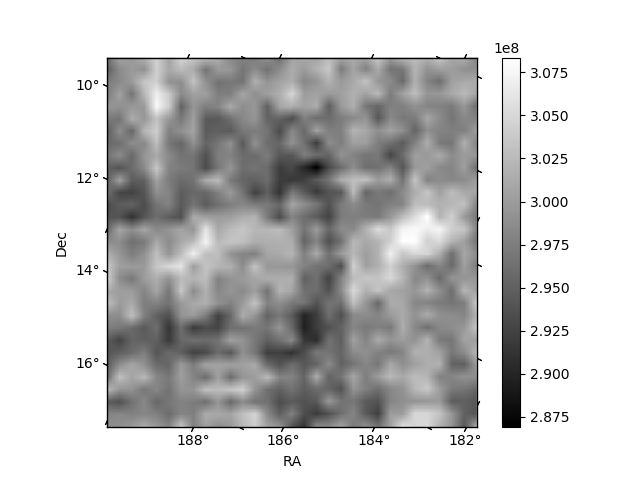
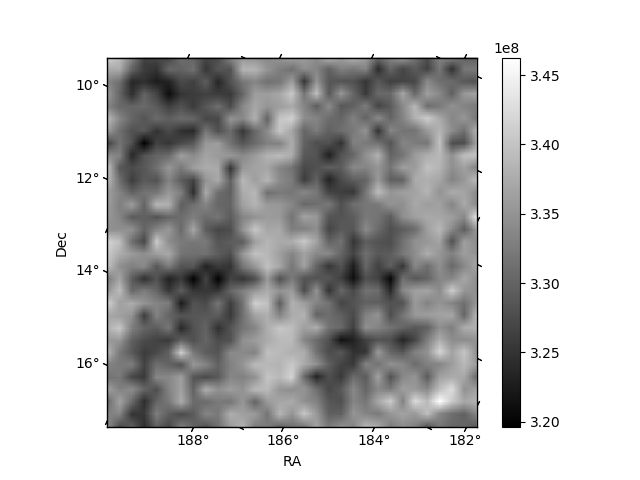
Histogram calculated using DETX and DETY for each event in the final _common_clean file
| Quadrant A | 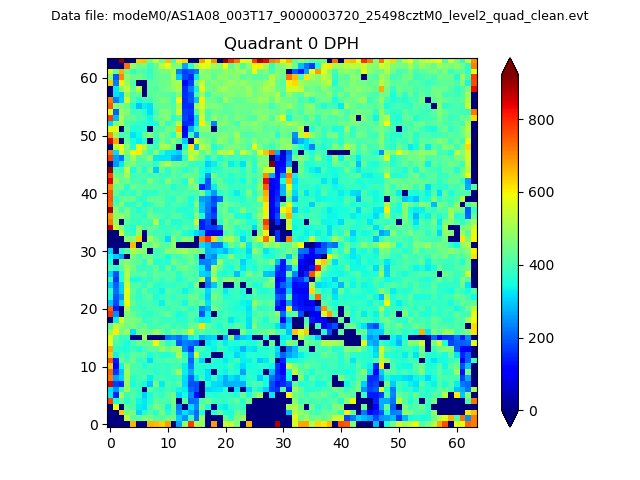 |
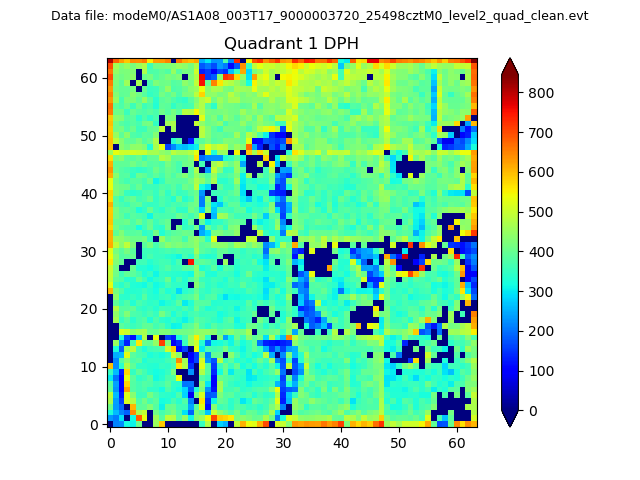 |
Quadrant B |
|---|---|---|---|
| Quadrant D | 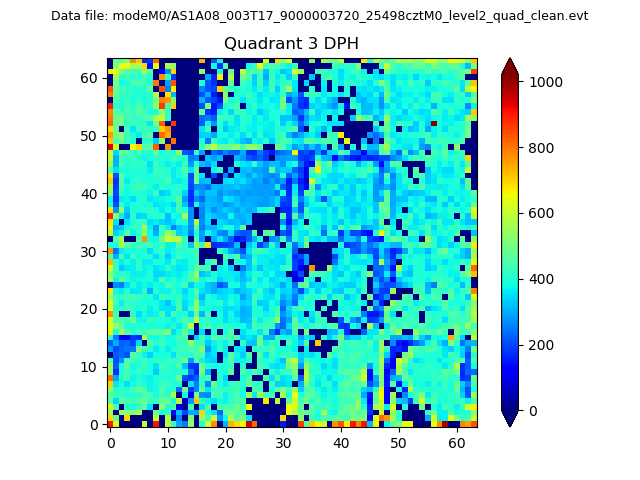 |
 |
Quadrant C |
| Plot type | Count rate plots | Images |
|---|---|---|
| Comparison with Poisson distribution Blue bars denote a histogram of data divided into 1 sec bins. Red curve is a Poisson curve with rate = median count rate of data. |
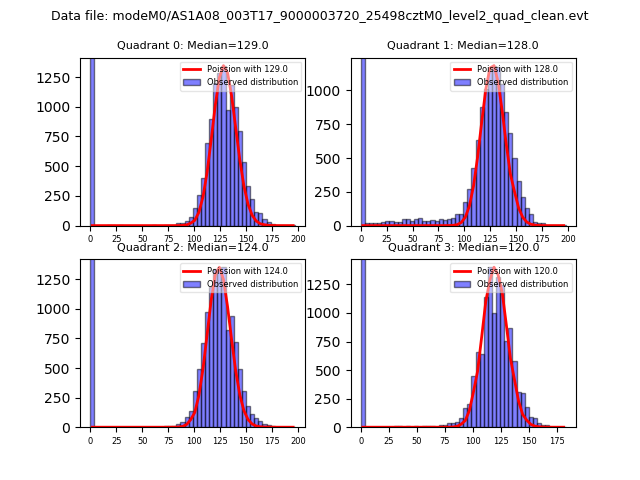 |
 |
| Quadrant-wise count rates Data is divided into 100 sec bins |
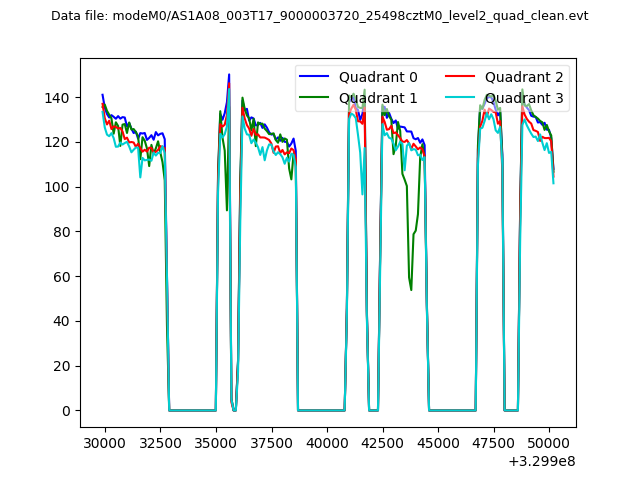 |
|
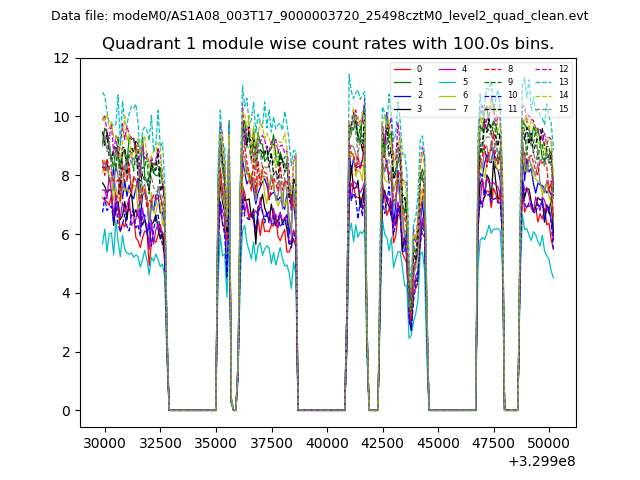
| Module-wise count rates for Quadrant A Data is divided into 100 sec bins |
 |
 |
| Module-wise count rates for Quadrant B Data is divided into 100 sec bins |
 |
 |
| Module-wise count rates for Quadrant C Data is divided into 100 sec bins |
 |
 |
| Module-wise count rates for Quadrant D Data is divided into 100 sec bins |
 |
 |
| Parameter | Plot |
|---|---|
| CZT HV Monitor | 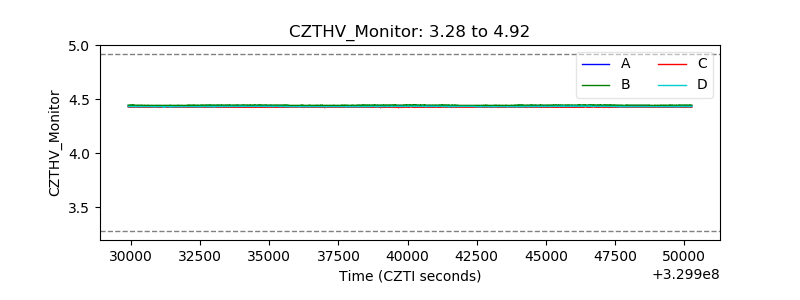 |
| D_VDD | 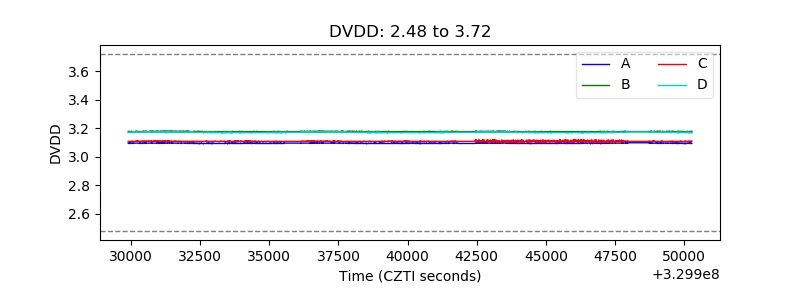 |
| Temperature 1 | 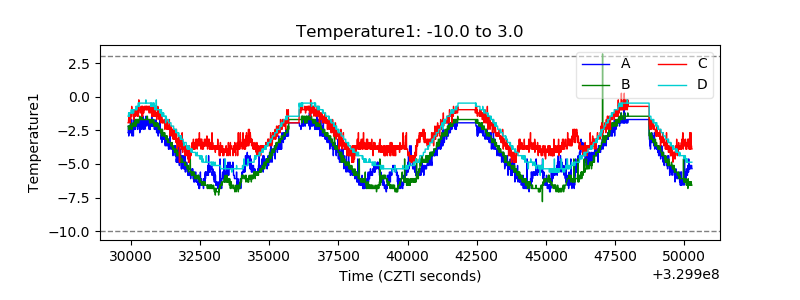 |
| Veto HV Monitor |  |
| Veto LLD | 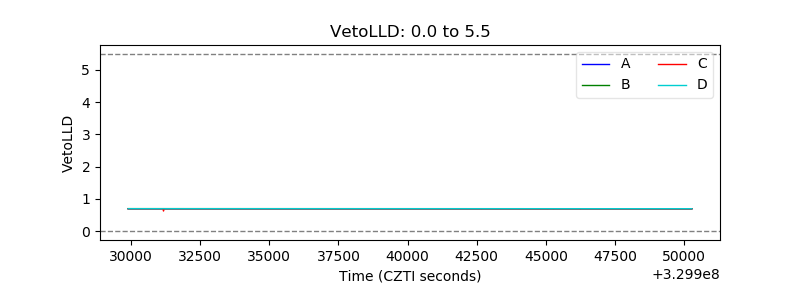 |
| Alpha Counter | 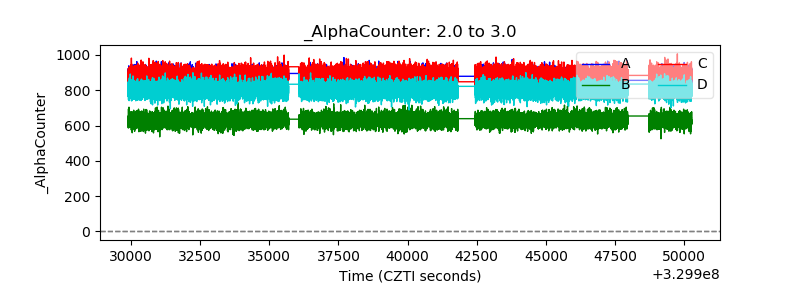 |
| _CPM_Rate | 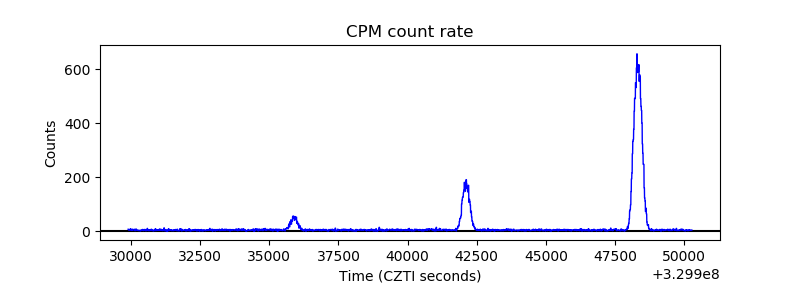 |
| CZT Counter | 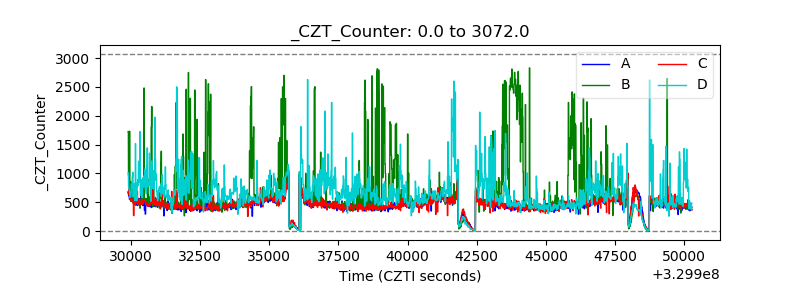 |
| +2.5 Volts monitor | 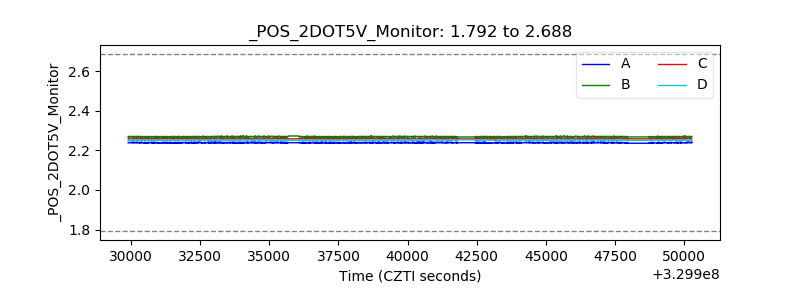 |
| +5 Volts monitor |  |
| _ROLL_ROT | 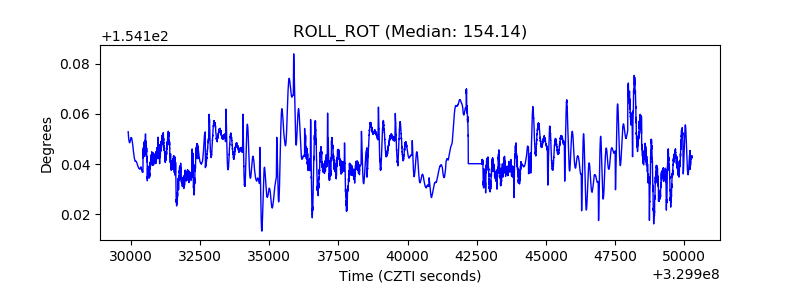 |
| _Roll_DEC |  |
| _Roll_RA | 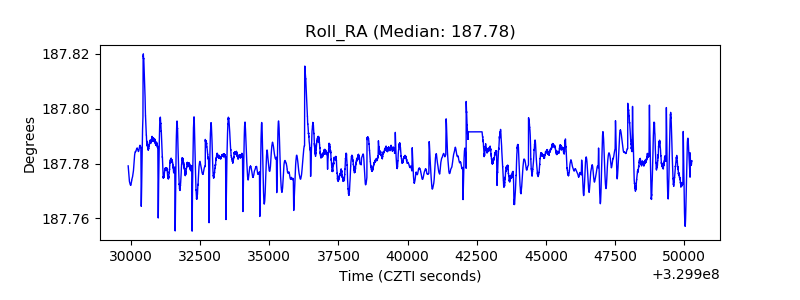 |
| Veto Counter | 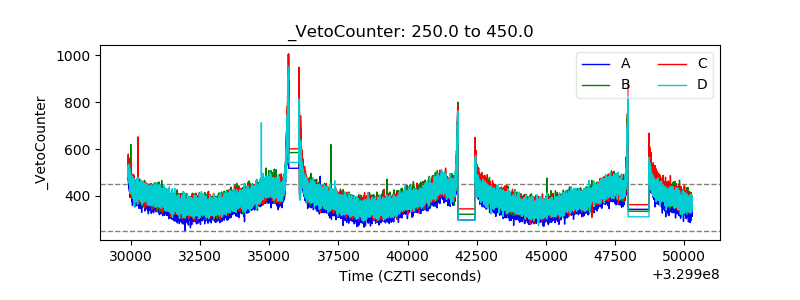 |