| Param | Original file | Final file |
|---|---|---|
| Filename | modeM0/AS1A08_003T17_9000003720_25499cztM0_level2.evt | modeM0/AS1A08_003T17_9000003720_25499cztM0_level2_quad_clean.evt |
| Size (bytes) | 471,090,240 | 90,080,640 |
| Size | 449.3 MB | 85.9 MB |
| Events in quadrant A | 3,153,591 | 578,150 |
| Events in quadrant B | 3,316,697 | 583,884 |
| Events in quadrant C | 3,207,261 | 555,047 |
| Events in quadrant D | 4,132,387 | 541,628 |
| Mode M0 | |||
|---|---|---|---|
| Quadrant | BADHDUFLAG | Total packets | Discarded packets |
| A | 0 | 13685 | 0 |
| B | 0 | 14095 | 0 |
| C | 0 | 13752 | 0 |
| D | 0 | 16779 | 0 |
| Mode M9 | |||
|---|---|---|---|
| Quadrant | BADHDUFLAG | Total packets | Discarded packets |
| A | 0 | 9 | 0 |
| B | 0 | 9 | 0 |
| C | 0 | 9 | 0 |
| D | 0 | 9 | 0 |
| Quadrant | Total seconds | Saturated seconds | Saturation percentage |
|---|---|---|---|
| A | 6727 | 24 | 0.356771% |
| B | 6727 | 32 | 0.475695% |
| C | 6727 | 42 | 0.624350% |
| D | 6727 | 57 | 0.847332% |
Noise dominated data is calculated using 1-second bins in cleaned event files. If a bin has >2000 counts, and if more than 50% of those come from <1% of pixels, then it is considered to be noise-dominated and hence unusable.
| Quadrant | # 1 sec bins | Bins with >0 counts | Bins with >2000 counts | High rate bins dominated by noise | Noise dominated (total time) | Noise dominated (detector-on time) | Marked lightcurve |
|---|---|---|---|---|---|---|---|
| A | 7657 | 6728 | 0 | 0 | 0.00% | 0.00% | 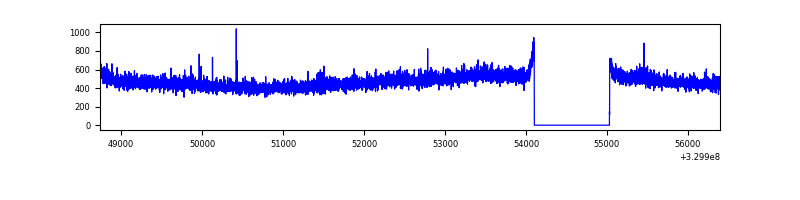 |
| B | 7657 | 6728 | 3 | 3 | 0.04% | 0.04% | 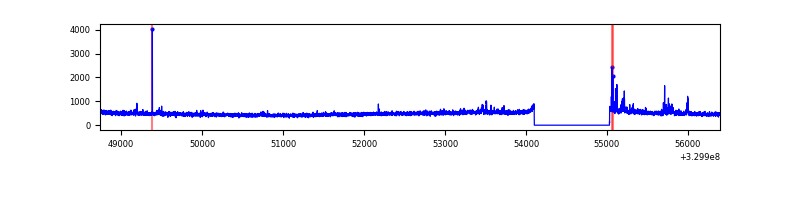 |
| C | 7657 | 6728 | 0 | 0 | 0.00% | 0.00% | 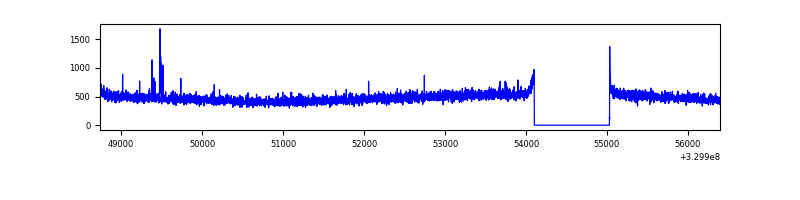 |
| D | 7657 | 6728 | 40 | 40 | 0.52% | 0.59% | 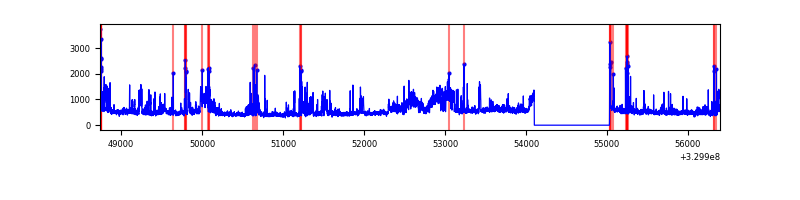 |
Top three noisy pixels from each quadrant. If the there are fewer than three noisy pixels in the level2.evt file, extra rows are filled as -1
| Pixel properties | Quadrant properties | ||||||
|---|---|---|---|---|---|---|---|
| Quadrant | DetID | PixID | Counts | Sigma | Mean | Median | Sigma |
| A | 13 | 254 | 10364 | 57.92 | 816 | 799 | 165.2 |
| A | 3 | 137 | 7723 | 41.93 | 816 | 799 | 165.2 |
| A | 0 | 226 | 7039 | 37.78 | 816 | 799 | 165.2 |
| B | 5 | 235 | 81511 | 517.49 | 813 | 792 | 156.0 |
| B | 12 | 111 | 19308 | 118.71 | 813 | 792 | 156.0 |
| B | 11 | 111 | 17313 | 105.92 | 813 | 792 | 156.0 |
| C | 14 | 238 | 125115 | 673.31 | 783 | 788 | 184.6 |
| C | 5 | 112 | 15181 | 77.95 | 783 | 788 | 184.6 |
| C | 3 | 233 | 7829 | 38.13 | 783 | 788 | 184.6 |
| D | 1 | 52 | 987846 | 5107.66 | 788 | 763 | 193.3 |
| D | 8 | 195 | 126324 | 649.71 | 788 | 763 | 193.3 |
| D | 2 | 234 | 27958 | 140.72 | 788 | 763 | 193.3 |
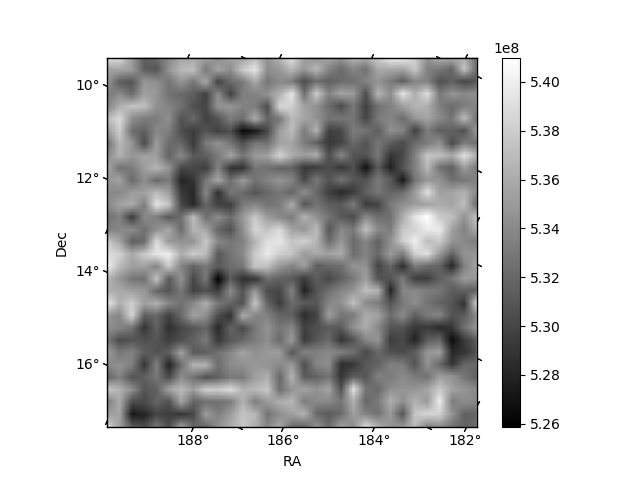
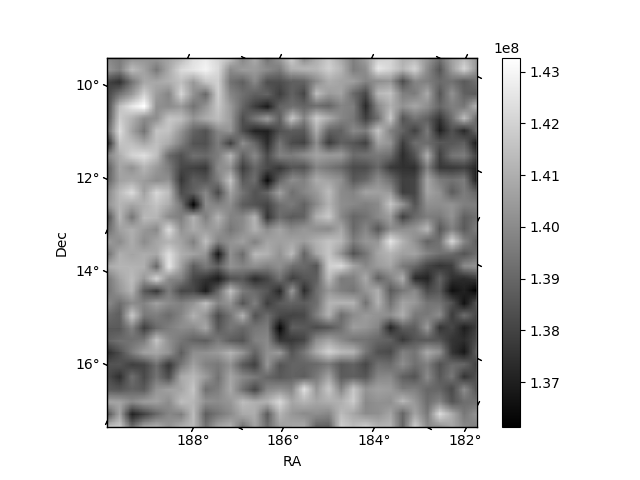
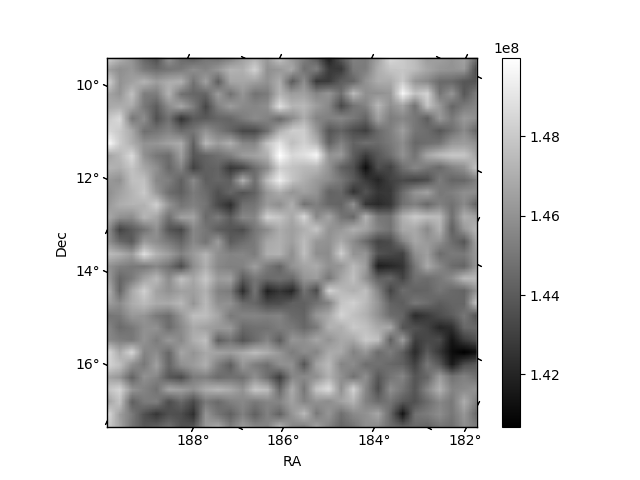
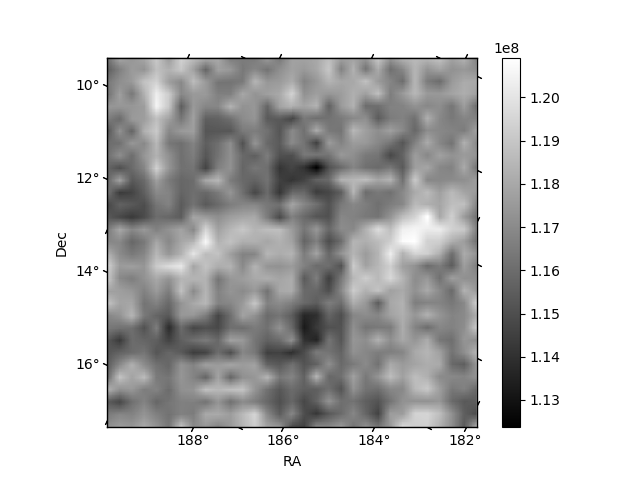
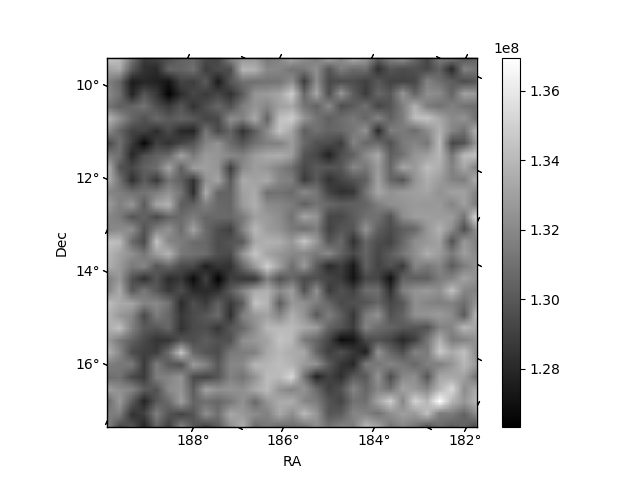
Histogram calculated using DETX and DETY for each event in the final _common_clean file
| Quadrant A | 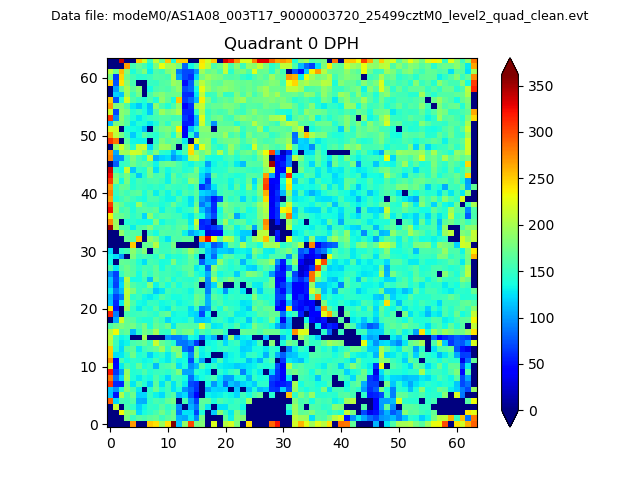 |
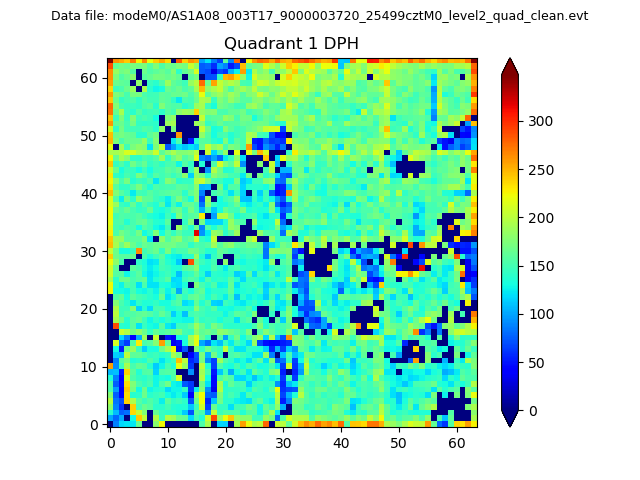 |
Quadrant B |
|---|---|---|---|
| Quadrant D | 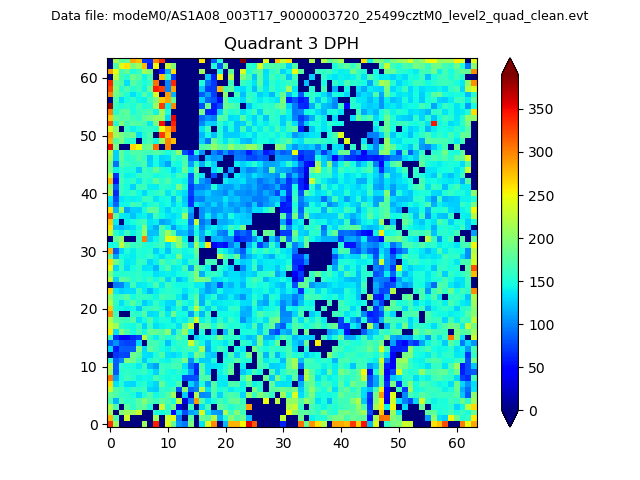 |
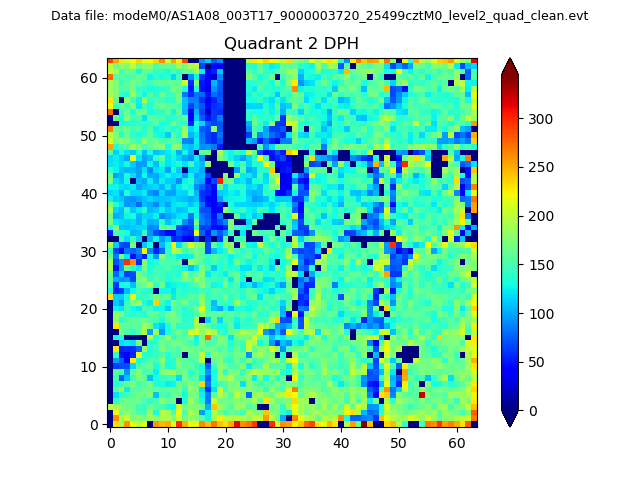 |
Quadrant C |
| Plot type | Count rate plots | Images |
|---|---|---|
| Comparison with Poisson distribution Blue bars denote a histogram of data divided into 1 sec bins. Red curve is a Poisson curve with rate = median count rate of data. |
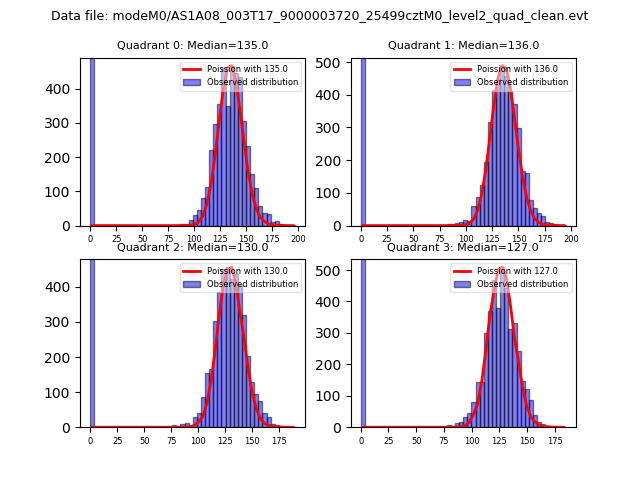 |
 |
| Quadrant-wise count rates Data is divided into 100 sec bins |
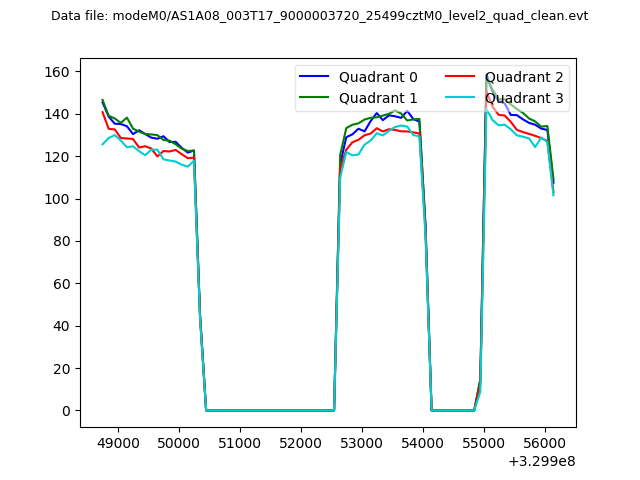 |
|
| Module-wise count rates for Quadrant A Data is divided into 100 sec bins |
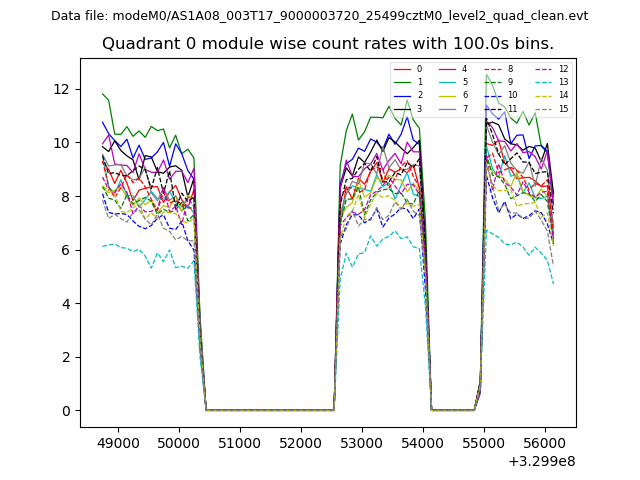 |
 |
| Module-wise count rates for Quadrant B Data is divided into 100 sec bins |
 |
 |
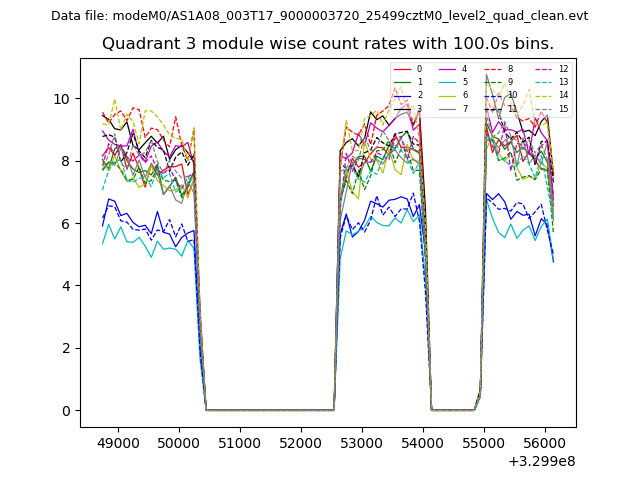
| Module-wise count rates for Quadrant C Data is divided into 100 sec bins |
 |
 |
| Module-wise count rates for Quadrant D Data is divided into 100 sec bins |
 |
 |
| Parameter | Plot |
|---|---|
| CZT HV Monitor |  |
| D_VDD | 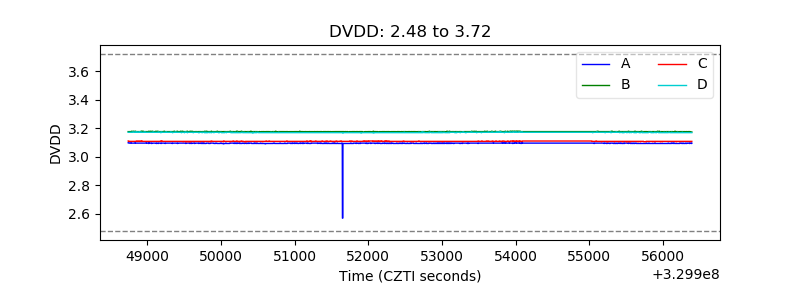 |
| Temperature 1 | 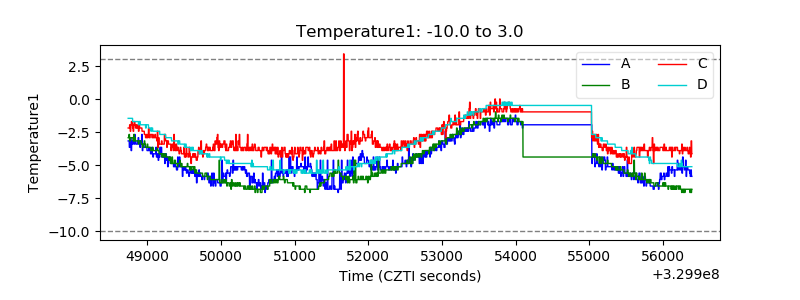 |
| Veto HV Monitor |  |
| Veto LLD | 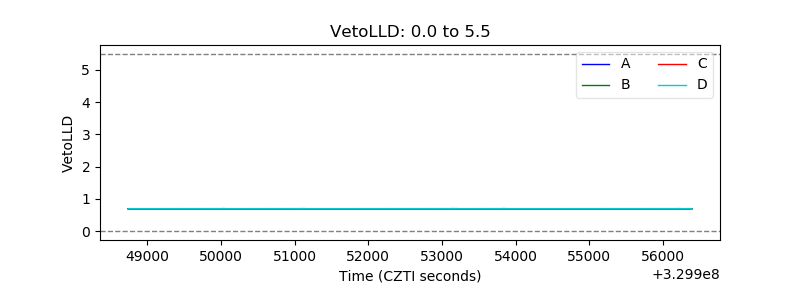 |
| Alpha Counter | 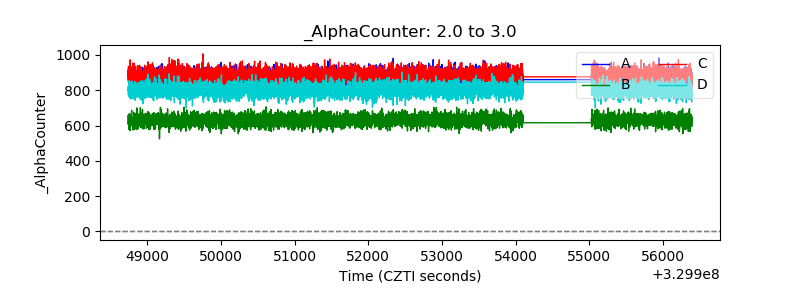 |
| _CPM_Rate | 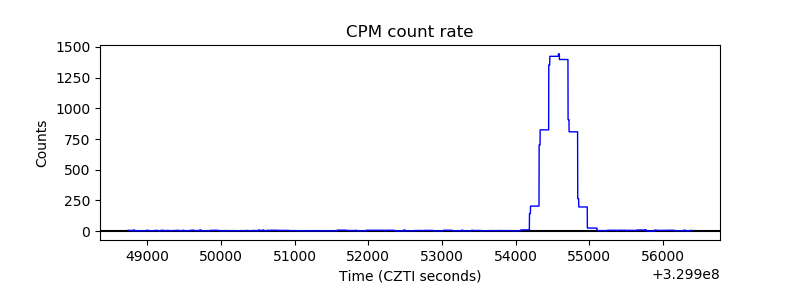 |
| CZT Counter | 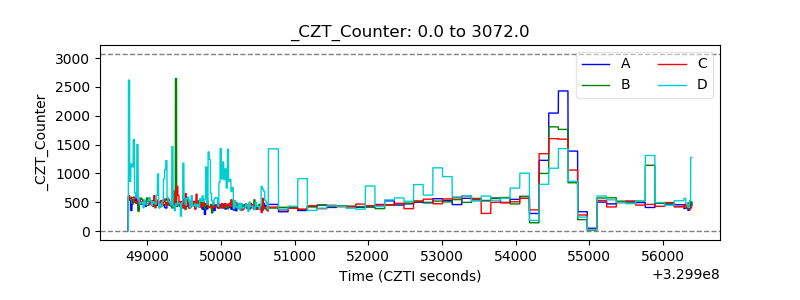 |
| +2.5 Volts monitor | 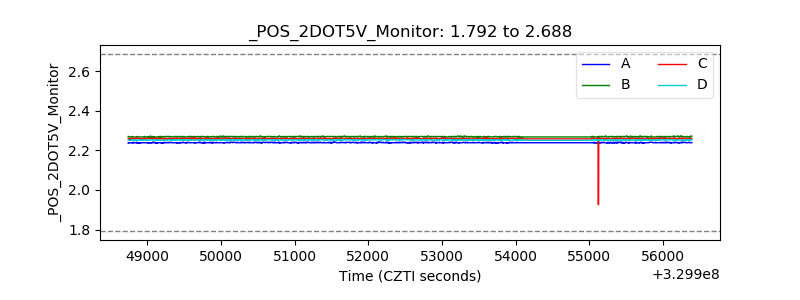 |
| +5 Volts monitor |  |
| _ROLL_ROT |  |
| _Roll_DEC | 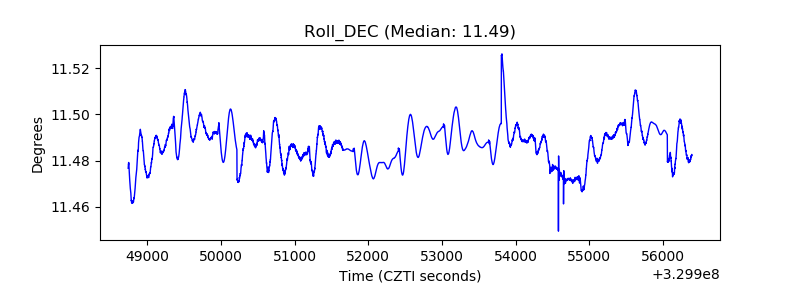 |
| _Roll_RA | 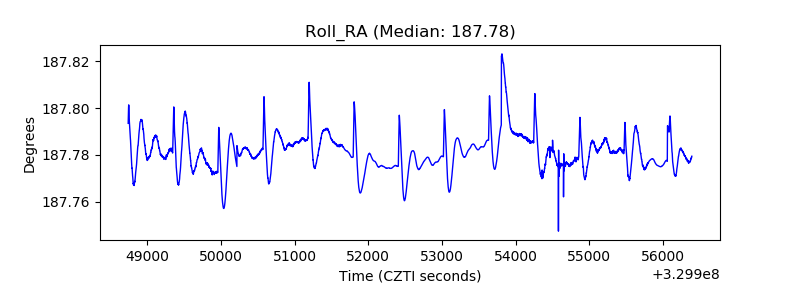 |
| Veto Counter |  |