| Param | Original file | Final file |
|---|---|---|
| Filename | modeM0/AS1A08_003T17_9000003720_25500cztM0_level2.evt | modeM0/AS1A08_003T17_9000003720_25500cztM0_level2_quad_clean.evt |
| Size (bytes) | 466,228,800 | 83,090,880 |
| Size | 444.6 MB | 79.2 MB |
| Events in quadrant A | 3,166,714 | 529,521 |
| Events in quadrant B | 3,311,713 | 539,367 |
| Events in quadrant C | 3,181,972 | 505,450 |
| Events in quadrant D | 4,014,832 | 485,364 |
| Mode M0 | |||
|---|---|---|---|
| Quadrant | BADHDUFLAG | Total packets | Discarded packets |
| A | 0 | 13419 | 0 |
| B | 0 | 13840 | 0 |
| C | 0 | 13409 | 0 |
| D | 0 | 16151 | 0 |
| Mode M9 | |||
|---|---|---|---|
| Quadrant | BADHDUFLAG | Total packets | Discarded packets |
| A | 0 | 16 | 0 |
| B | 0 | 17 | 0 |
| C | 0 | 17 | 0 |
| D | 0 | 17 | 0 |
| Quadrant | Total seconds | Saturated seconds | Saturation percentage |
|---|---|---|---|
| A | 6546 | 22 | 0.336083% |
| B | 6546 | 34 | 0.519401% |
| C | 6546 | 50 | 0.763825% |
| D | 6546 | 168 | 2.566453% |
Noise dominated data is calculated using 1-second bins in cleaned event files. If a bin has >2000 counts, and if more than 50% of those come from <1% of pixels, then it is considered to be noise-dominated and hence unusable.
| Quadrant | # 1 sec bins | Bins with >0 counts | Bins with >2000 counts | High rate bins dominated by noise | Noise dominated (total time) | Noise dominated (detector-on time) | Marked lightcurve |
|---|---|---|---|---|---|---|---|
| A | 7606 | 6547 | 0 | 0 | 0.00% | 0.00% | 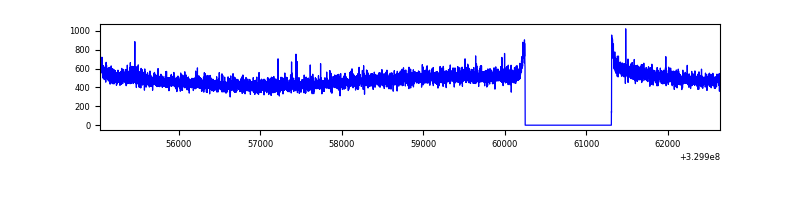 |
| B | 7606 | 6547 | 2 | 2 | 0.03% | 0.03% | 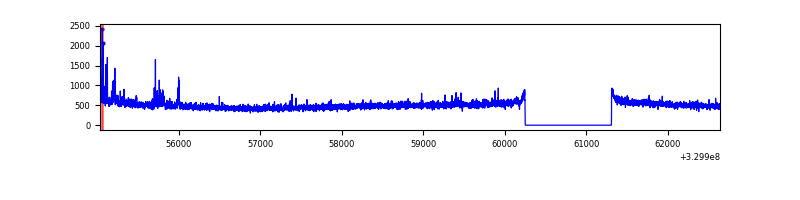 |
| C | 7606 | 6547 | 0 | 0 | 0.00% | 0.00% | 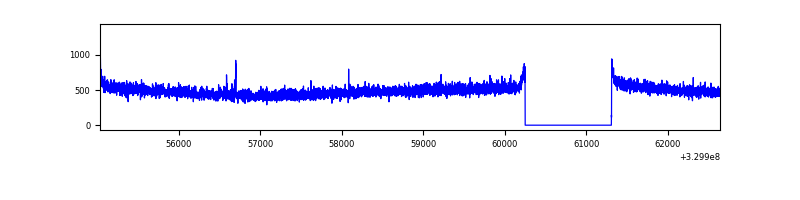 |
| D | 7606 | 6547 | 129 | 129 | 1.70% | 1.97% | 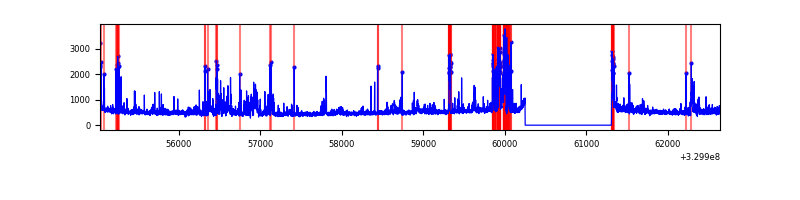 |
Top three noisy pixels from each quadrant. If the there are fewer than three noisy pixels in the level2.evt file, extra rows are filled as -1
| Pixel properties | Quadrant properties | ||||||
|---|---|---|---|---|---|---|---|
| Quadrant | DetID | PixID | Counts | Sigma | Mean | Median | Sigma |
| A | 13 | 254 | 9516 | 53.12 | 820 | 803 | 164.0 |
| A | 3 | 137 | 7436 | 40.44 | 820 | 803 | 164.0 |
| A | 0 | 226 | 6978 | 37.64 | 820 | 803 | 164.0 |
| B | 5 | 235 | 81215 | 511.75 | 819 | 799 | 157.1 |
| B | 12 | 111 | 19224 | 117.25 | 819 | 799 | 157.1 |
| B | 11 | 111 | 17154 | 104.08 | 819 | 799 | 157.1 |
| C | 14 | 238 | 124021 | 671.75 | 781 | 786 | 183.5 |
| C | 2 | 16 | 9013 | 44.84 | 781 | 786 | 183.5 |
| C | 13 | 61 | 5399 | 25.15 | 781 | 786 | 183.5 |
| D | 1 | 52 | 506103 | 2646.29 | 779 | 757 | 191.0 |
| D | 12 | 233 | 371664 | 1942.29 | 779 | 757 | 191.0 |
| D | 8 | 195 | 149370 | 778.23 | 779 | 757 | 191.0 |
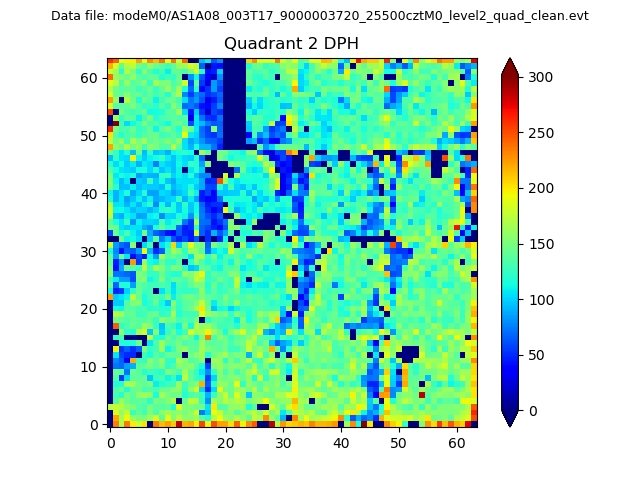
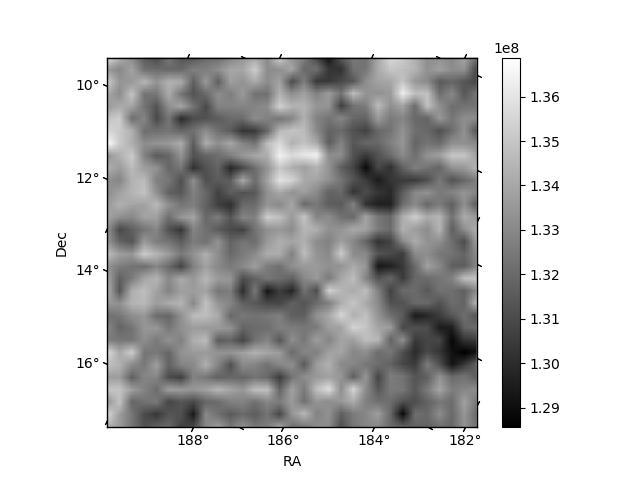
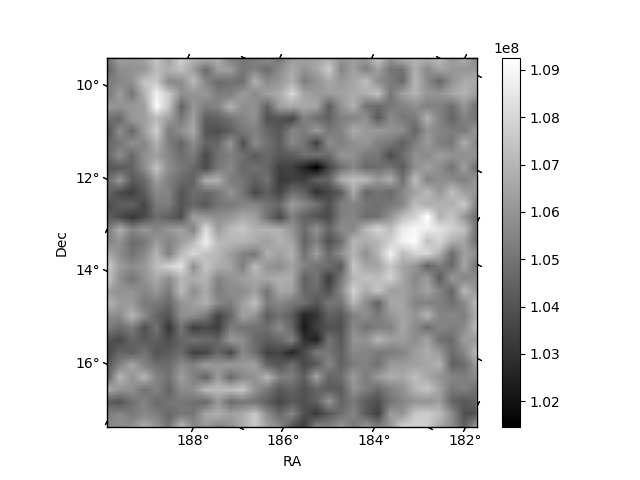
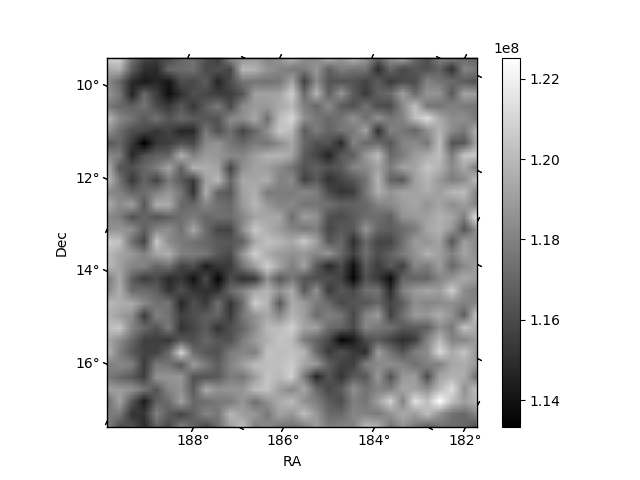
Histogram calculated using DETX and DETY for each event in the final _common_clean file
| Quadrant A | 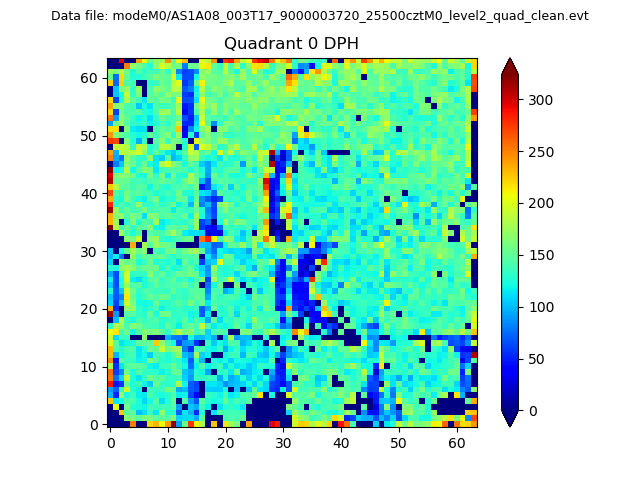 |
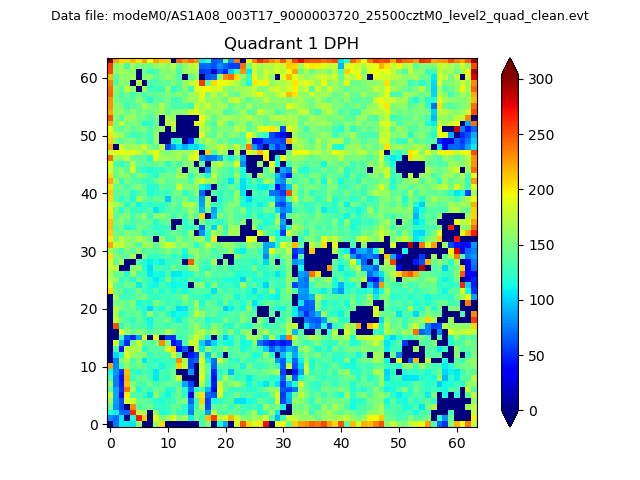 |
Quadrant B |
|---|---|---|---|
| Quadrant D | 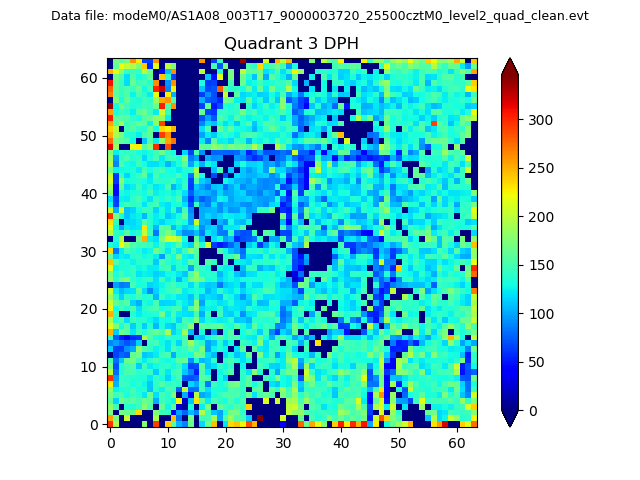 |
 |
Quadrant C |
| Plot type | Count rate plots | Images |
|---|---|---|
| Comparison with Poisson distribution Blue bars denote a histogram of data divided into 1 sec bins. Red curve is a Poisson curve with rate = median count rate of data. |
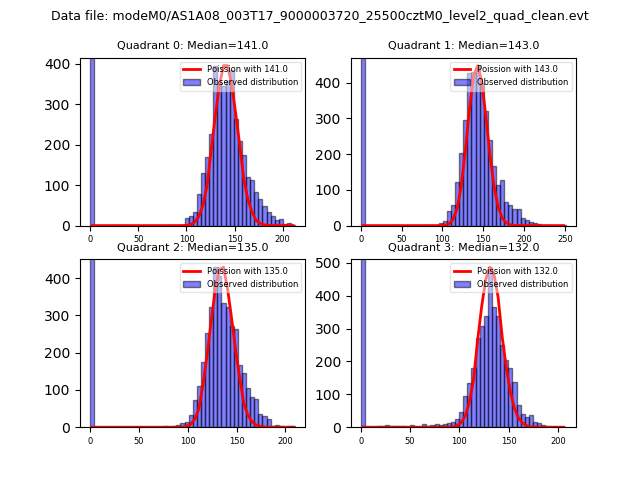 |
 |
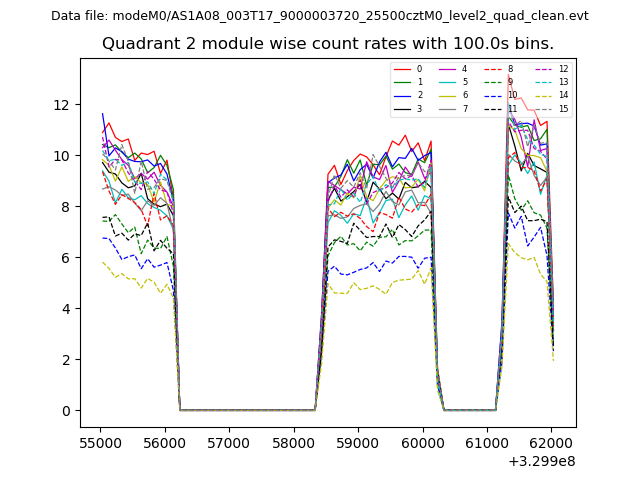
| Quadrant-wise count rates Data is divided into 100 sec bins |
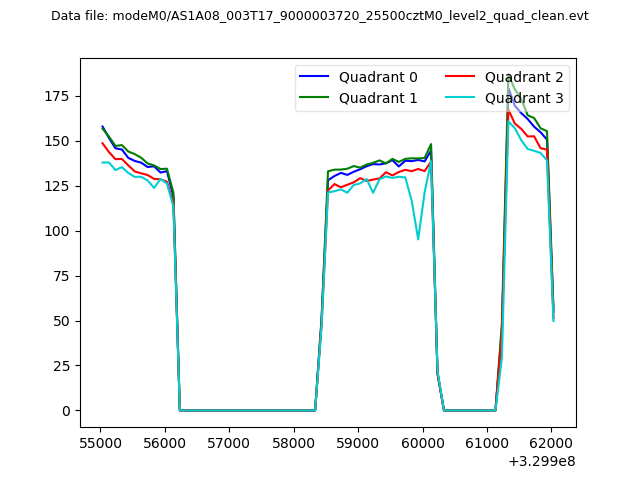 |
|
| Module-wise count rates for Quadrant A Data is divided into 100 sec bins |
 |
 |
| Module-wise count rates for Quadrant B Data is divided into 100 sec bins |
 |
 |
| Module-wise count rates for Quadrant C Data is divided into 100 sec bins |
 |
 |
| Module-wise count rates for Quadrant D Data is divided into 100 sec bins |
 |
 |
| Parameter | Plot |
|---|---|
| CZT HV Monitor | 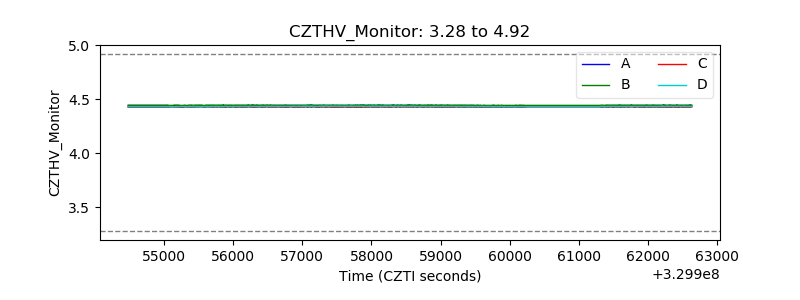 |
| D_VDD | 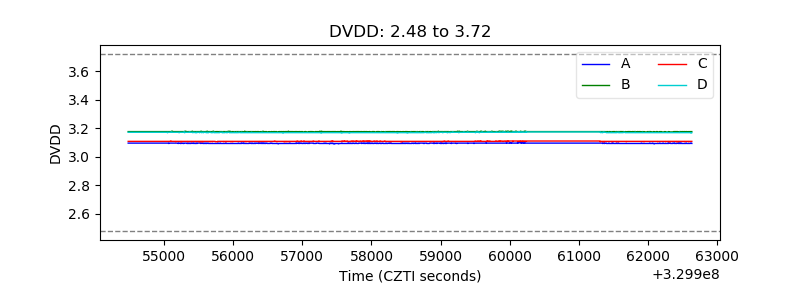 |
| Temperature 1 | 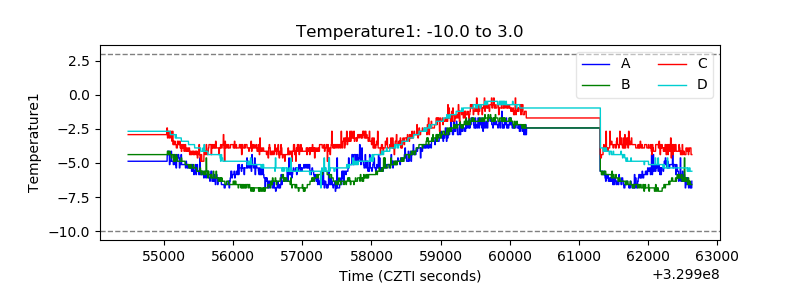 |
| Veto HV Monitor |  |
| Veto LLD | 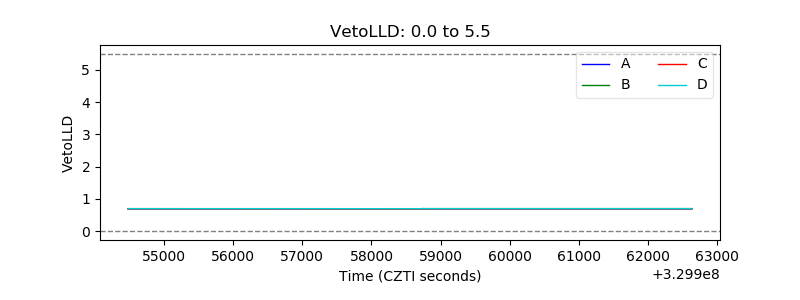 |
| Alpha Counter | 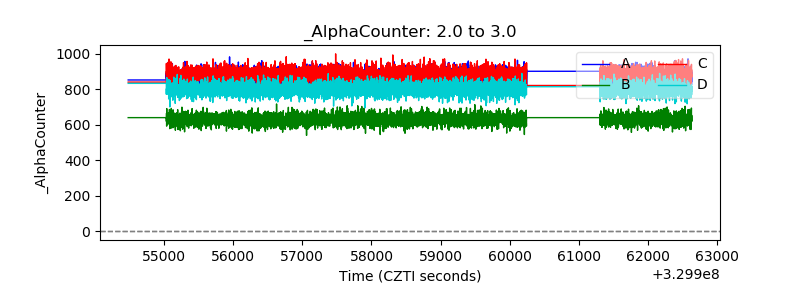 |
| _CPM_Rate | 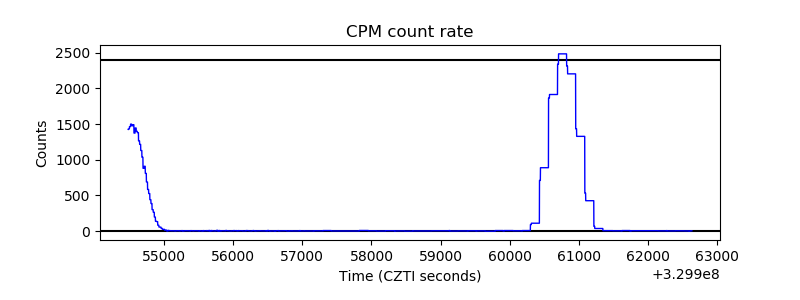 |
| CZT Counter | 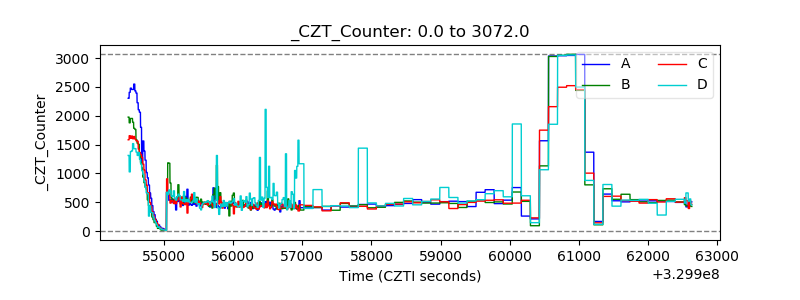 |
| +2.5 Volts monitor |  |
| +5 Volts monitor | 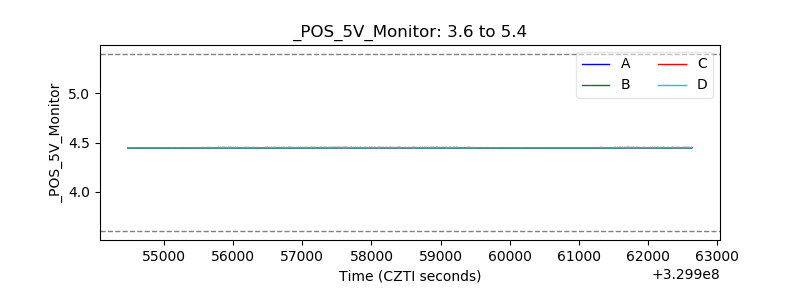 |
| _ROLL_ROT | 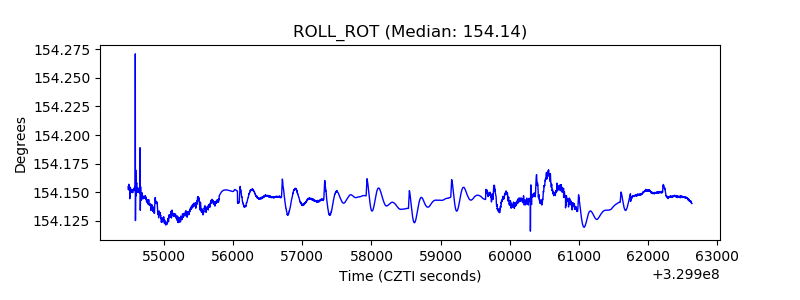 |
| _Roll_DEC | 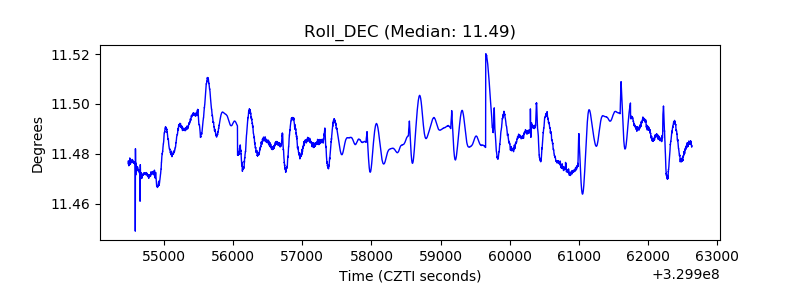 |
| _Roll_RA | 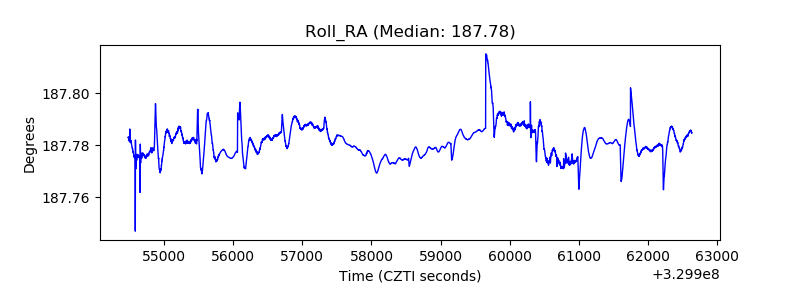 |
| Veto Counter | 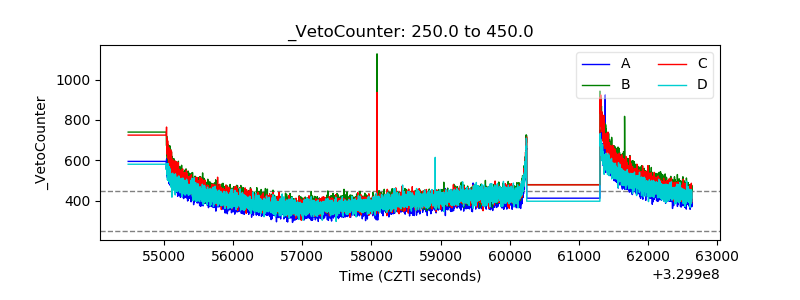 |