| Param | Original file | Final file |
|---|---|---|
| Filename | modeM0/AS1A08_003T17_9000003720_25502cztM0_level2.evt | modeM0/AS1A08_003T17_9000003720_25502cztM0_level2_quad_clean.evt |
| Size (bytes) | 476,337,600 | 76,392,000 |
| Size | 454.3 MB | 72.9 MB |
| Events in quadrant A | 3,272,446 | 481,623 |
| Events in quadrant B | 3,331,363 | 490,877 |
| Events in quadrant C | 3,255,613 | 454,094 |
| Events in quadrant D | 4,133,459 | 441,344 |
| Mode M0 | |||
|---|---|---|---|
| Quadrant | BADHDUFLAG | Total packets | Discarded packets |
| A | 0 | 13469 | 0 |
| B | 0 | 13619 | 0 |
| C | 0 | 13441 | 0 |
| D | 0 | 16471 | 0 |
| Mode M9 | |||
|---|---|---|---|
| Quadrant | BADHDUFLAG | Total packets | Discarded packets |
| A | 0 | 23 | 0 |
| B | 0 | 23 | 0 |
| C | 0 | 23 | 0 |
| D | 0 | 23 | 0 |
| Quadrant | Total seconds | Saturated seconds | Saturation percentage |
|---|---|---|---|
| A | 6385 | 41 | 0.642130% |
| B | 6385 | 50 | 0.783085% |
| C | 6385 | 71 | 1.111981% |
| D | 6386 | 125 | 1.957407% |
Noise dominated data is calculated using 1-second bins in cleaned event files. If a bin has >2000 counts, and if more than 50% of those come from <1% of pixels, then it is considered to be noise-dominated and hence unusable.
| Quadrant | # 1 sec bins | Bins with >0 counts | Bins with >2000 counts | High rate bins dominated by noise | Noise dominated (total time) | Noise dominated (detector-on time) | Marked lightcurve |
|---|---|---|---|---|---|---|---|
| A | 8620 | 6387 | 0 | 0 | 0.00% | 0.00% | 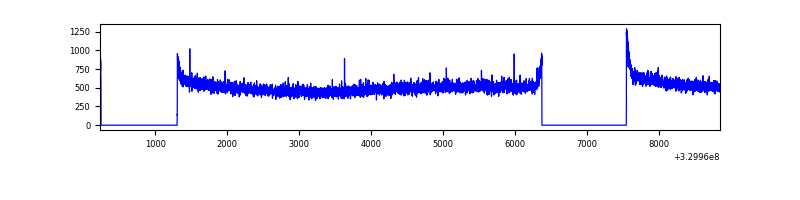 |
| B | 8620 | 6387 | 0 | 0 | 0.00% | 0.00% | 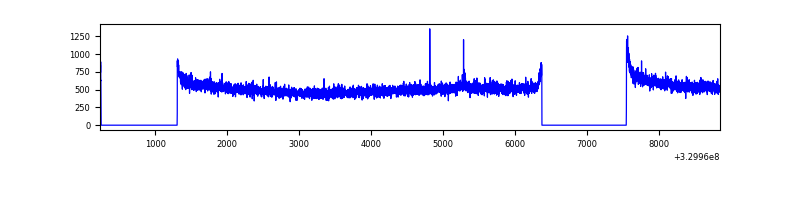 |
| C | 8620 | 6387 | 0 | 0 | 0.00% | 0.00% | 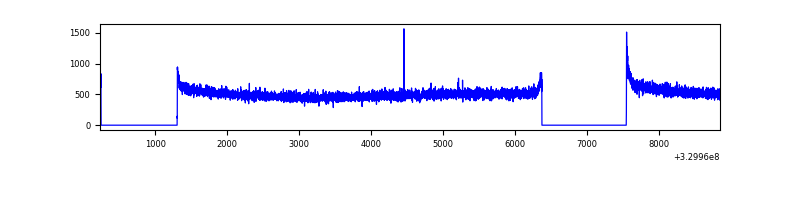 |
| D | 8621 | 6388 | 91 | 91 | 1.06% | 1.42% | 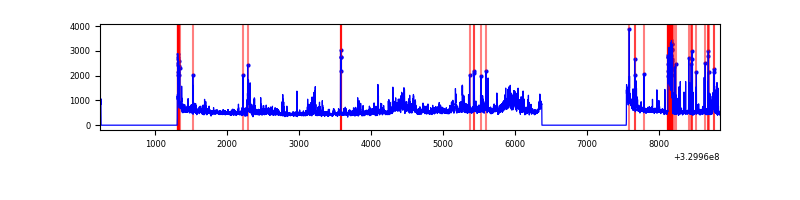 |
Top three noisy pixels from each quadrant. If the there are fewer than three noisy pixels in the level2.evt file, extra rows are filled as -1
| Pixel properties | Quadrant properties | ||||||
|---|---|---|---|---|---|---|---|
| Quadrant | DetID | PixID | Counts | Sigma | Mean | Median | Sigma |
| A | 13 | 254 | 9552 | 51.43 | 847 | 830 | 169.6 |
| A | 0 | 226 | 7350 | 38.44 | 847 | 830 | 169.6 |
| A | 3 | 137 | 7229 | 37.73 | 847 | 830 | 169.6 |
| B | 12 | 111 | 19281 | 115.47 | 845 | 826 | 159.8 |
| B | 11 | 111 | 17189 | 102.38 | 845 | 826 | 159.8 |
| B | 14 | 111 | 15898 | 94.3 | 845 | 826 | 159.8 |
| C | 14 | 238 | 130609 | 694.63 | 799 | 805 | 186.9 |
| C | 13 | 61 | 5467 | 24.95 | 799 | 805 | 186.9 |
| C | 7 | 247 | 4496 | 19.75 | 799 | 805 | 186.9 |
| D | 8 | 195 | 575594 | 2952.77 | 800 | 778 | 194.7 |
| D | 1 | 52 | 402010 | 2061.09 | 800 | 778 | 194.7 |
| D | 12 | 233 | 124711 | 636.63 | 800 | 778 | 194.7 |
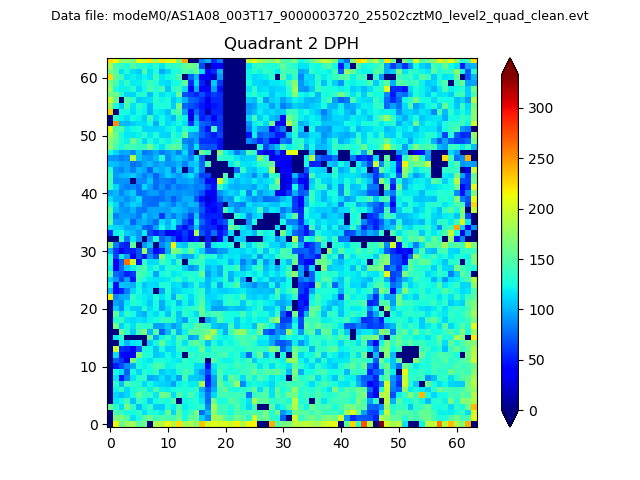
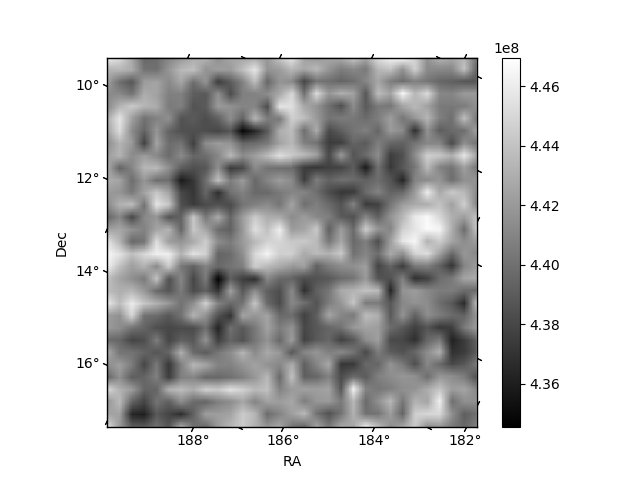
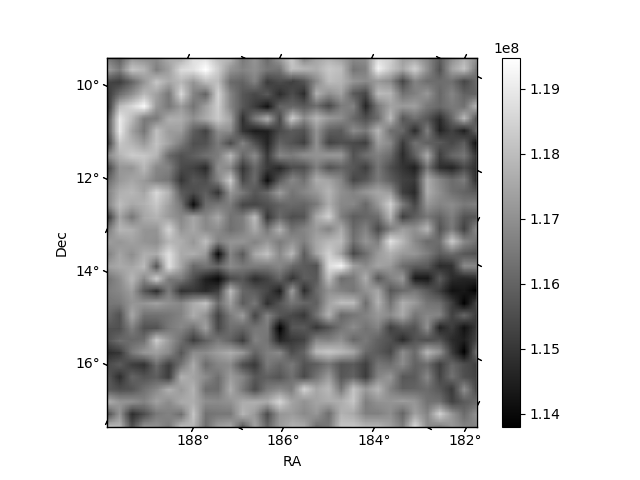
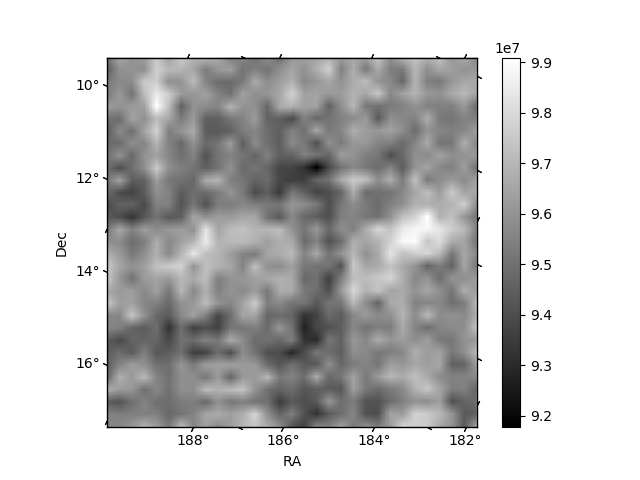
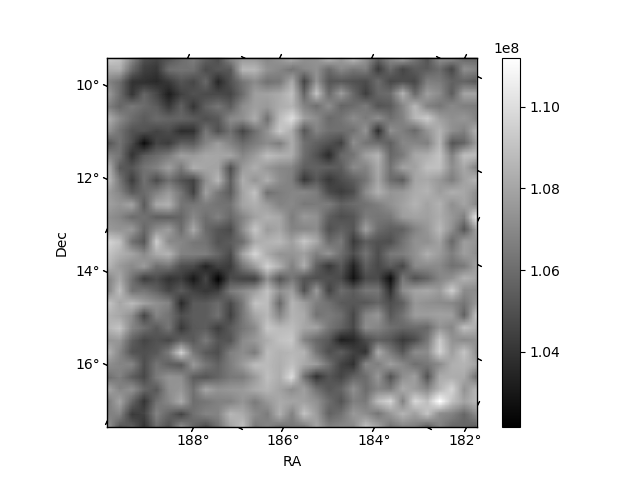
Histogram calculated using DETX and DETY for each event in the final _common_clean file
| Quadrant A | 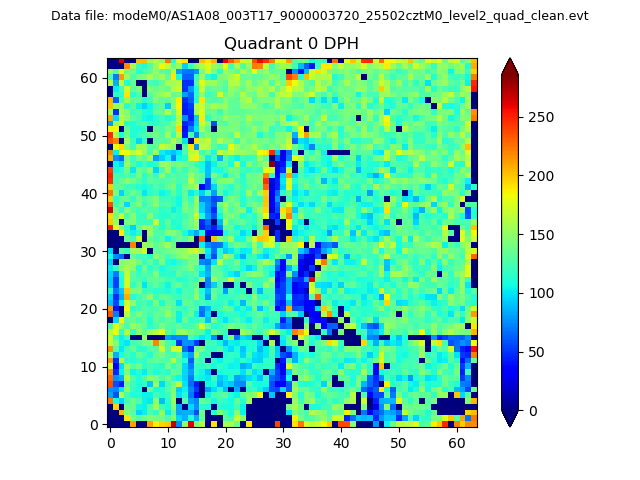 |
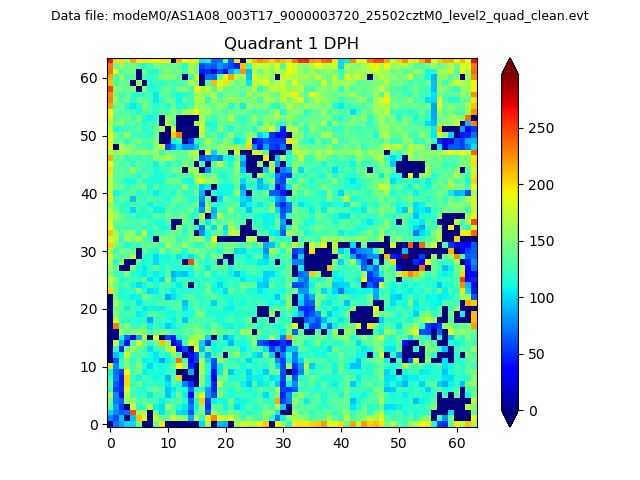 |
Quadrant B |
|---|---|---|---|
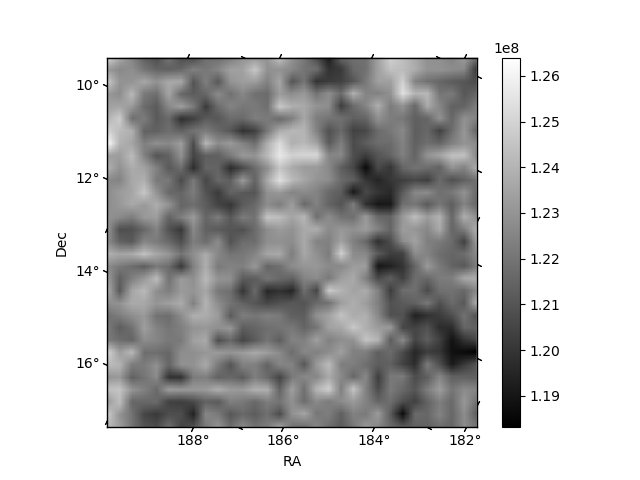
| Quadrant D | 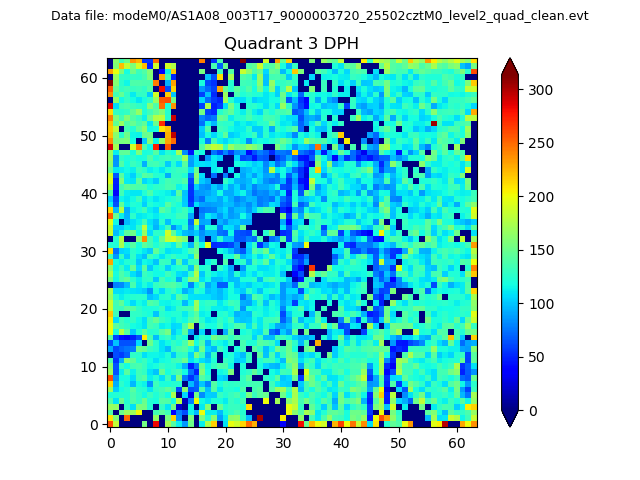 |
 |
Quadrant C |
| Plot type | Count rate plots | Images |
|---|---|---|
| Comparison with Poisson distribution Blue bars denote a histogram of data divided into 1 sec bins. Red curve is a Poisson curve with rate = median count rate of data. |
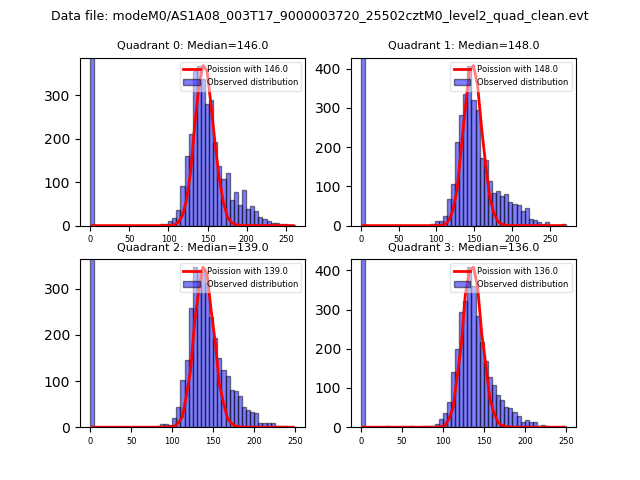 |
 |
| Quadrant-wise count rates Data is divided into 100 sec bins |
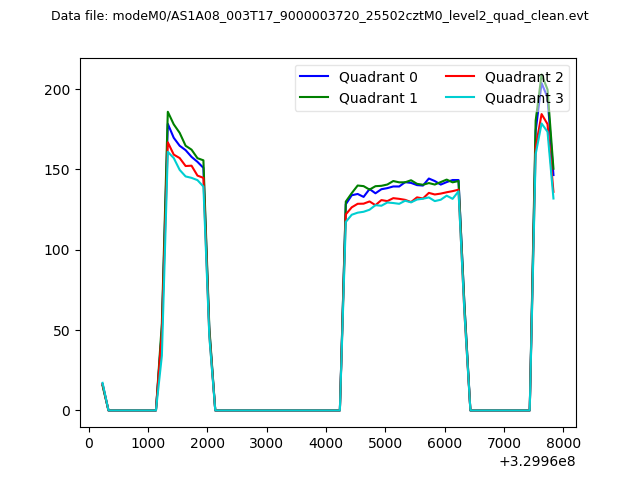 |
|
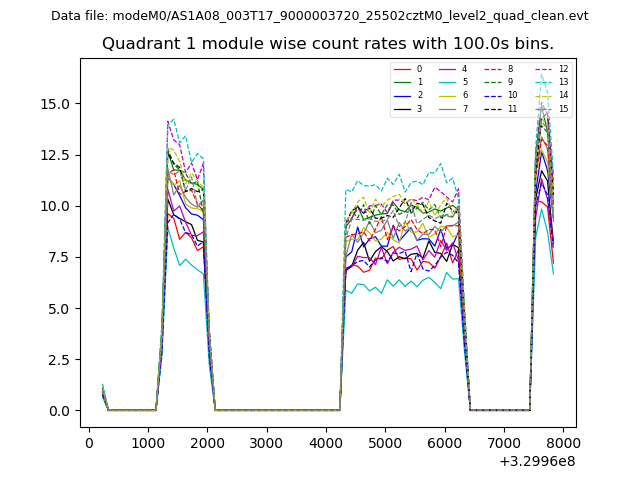
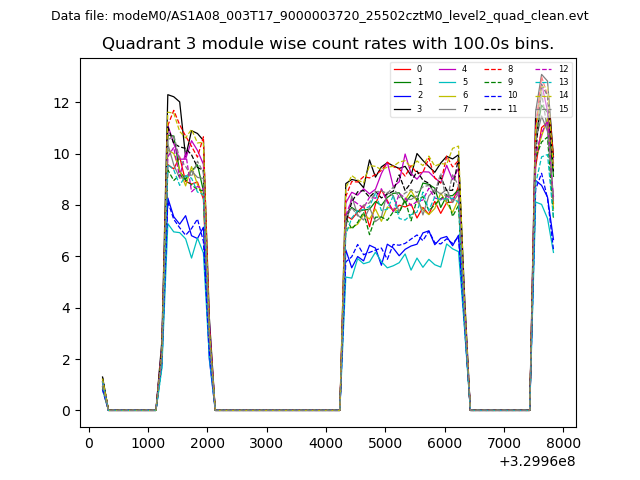
| Module-wise count rates for Quadrant A Data is divided into 100 sec bins |
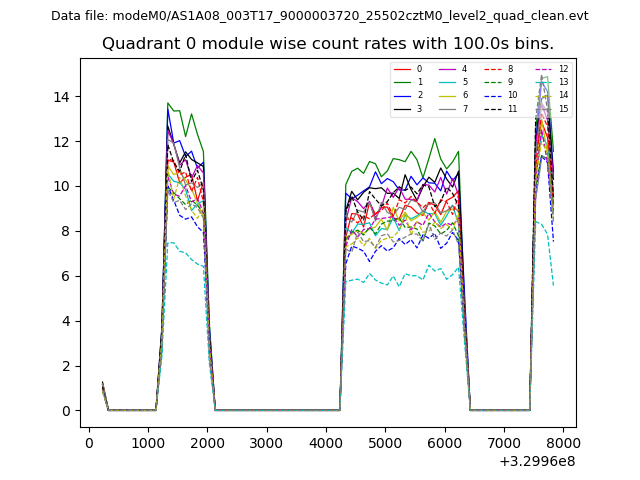 |
 |
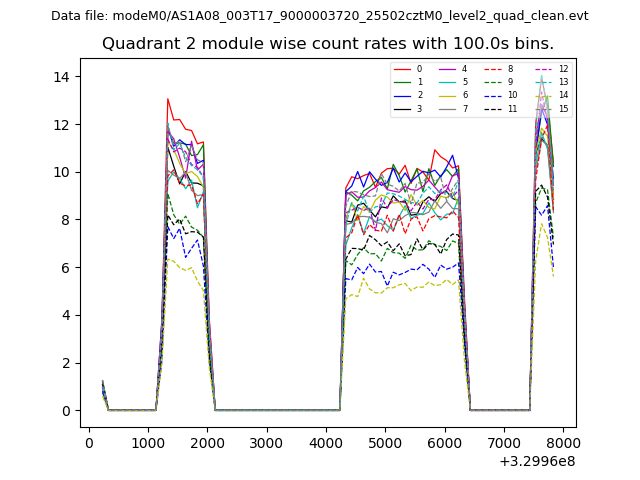
| Module-wise count rates for Quadrant B Data is divided into 100 sec bins |
 |
 |
| Module-wise count rates for Quadrant C Data is divided into 100 sec bins |
 |
 |
| Module-wise count rates for Quadrant D Data is divided into 100 sec bins |
 |
 |
| Parameter | Plot |
|---|---|
| CZT HV Monitor | 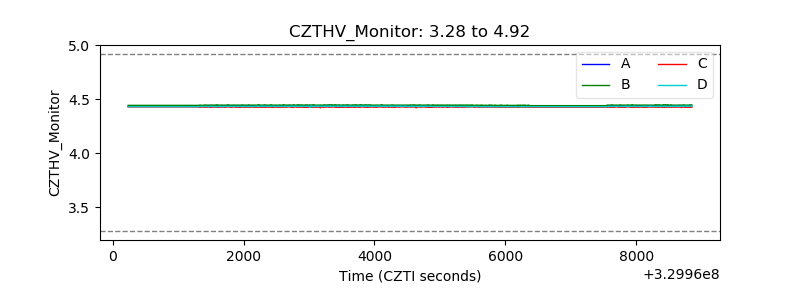 |
| D_VDD | 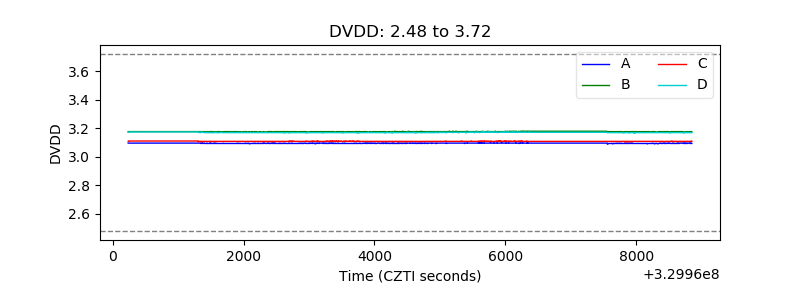 |
| Temperature 1 | 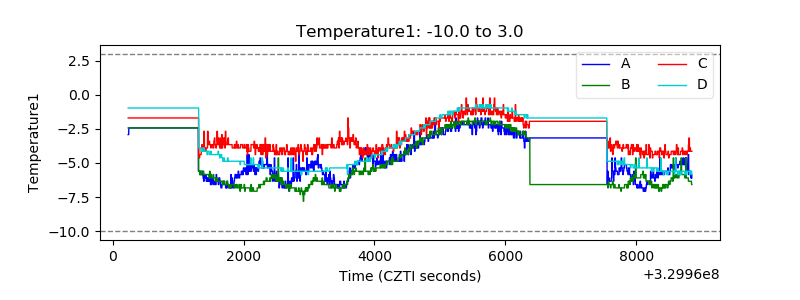 |
| Veto HV Monitor | 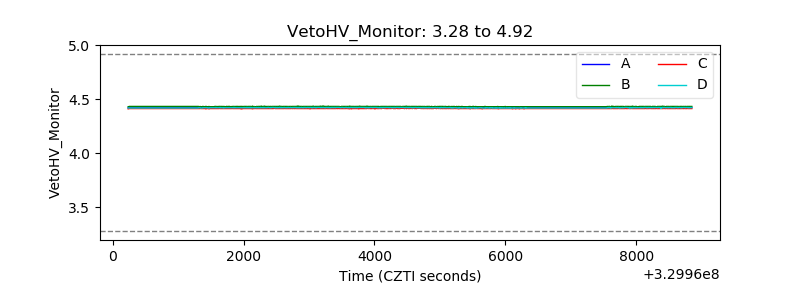 |
| Veto LLD | 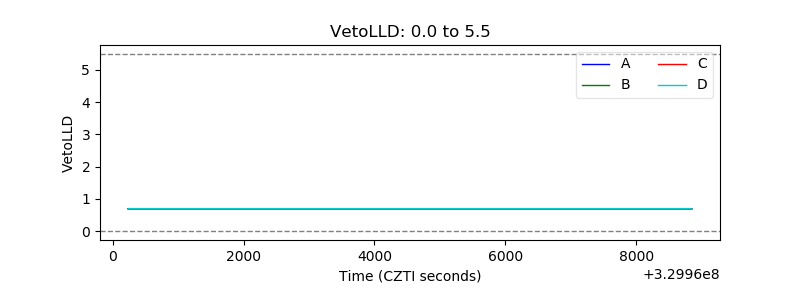 |
| Alpha Counter | 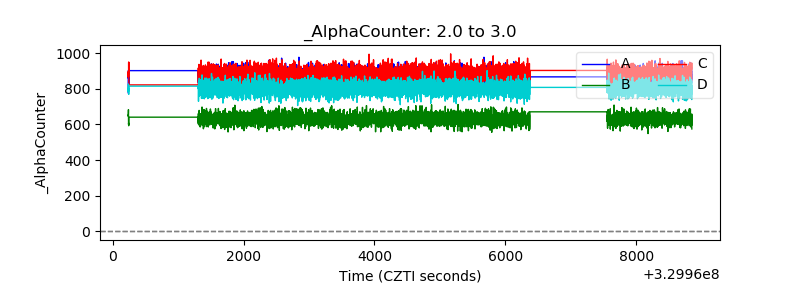 |
| _CPM_Rate | 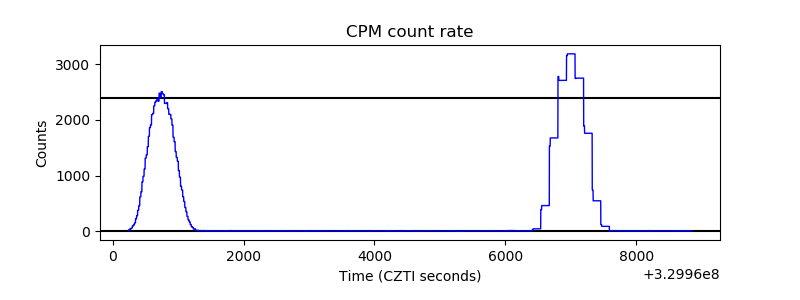 |
| CZT Counter | 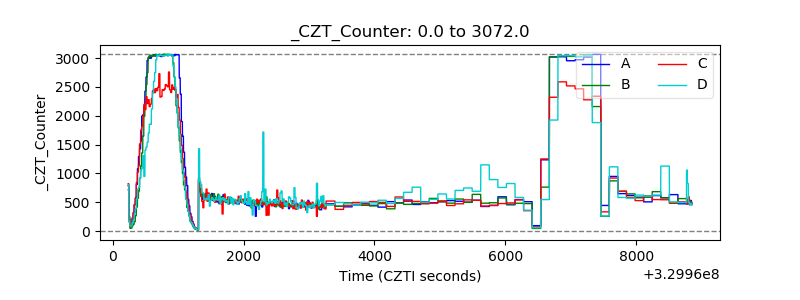 |
| +2.5 Volts monitor |  |
| +5 Volts monitor |  |
| _ROLL_ROT | 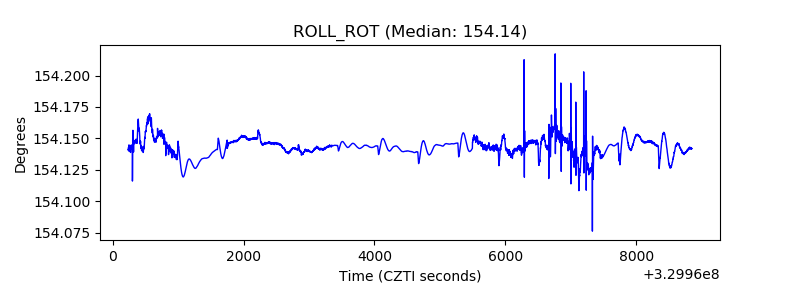 |
| _Roll_DEC | 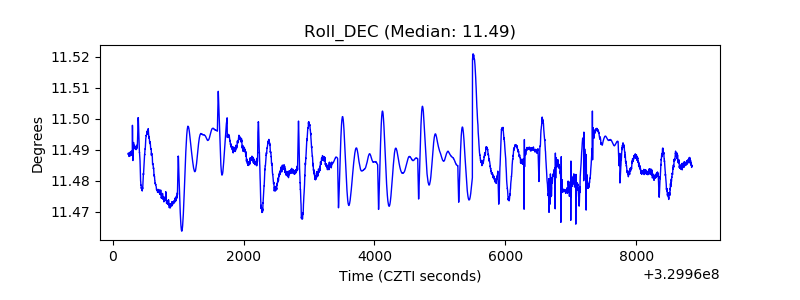 |
| _Roll_RA | 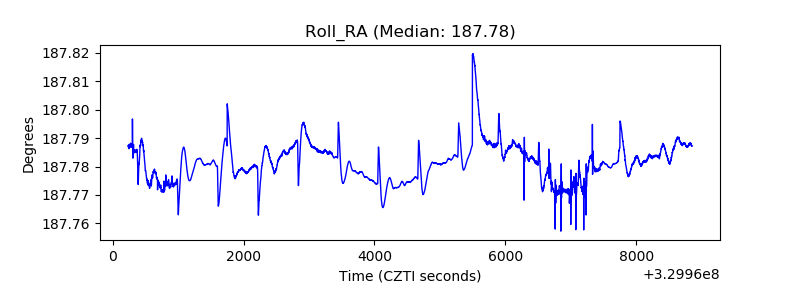 |
| Veto Counter | 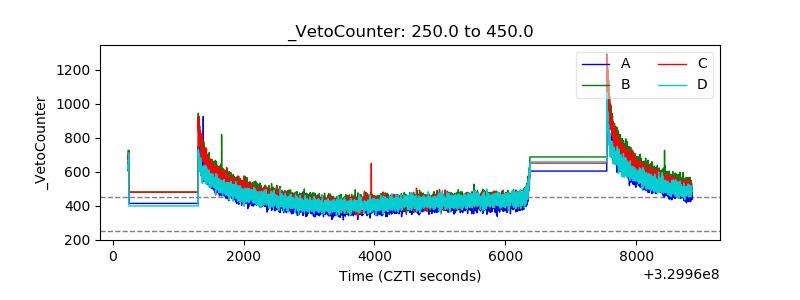 |