| Param | Original file | Final file |
|---|---|---|
| Filename | modeM0/AS1A08_003T17_9000003720_25503cztM0_level2.evt | modeM0/AS1A08_003T17_9000003720_25503cztM0_level2_quad_clean.evt |
| Size (bytes) | 511,153,920 | 67,965,120 |
| Size | 487.5 MB | 64.8 MB |
| Events in quadrant A | 3,546,757 | 414,714 |
| Events in quadrant B | 3,621,244 | 421,123 |
| Events in quadrant C | 3,507,541 | 389,181 |
| Events in quadrant D | 4,362,296 | 377,587 |
| Mode M0 | |||
|---|---|---|---|
| Quadrant | BADHDUFLAG | Total packets | Discarded packets |
| A | 0 | 14308 | 0 |
| B | 0 | 14631 | 0 |
| C | 0 | 14239 | 0 |
| D | 0 | 17063 | 0 |
| Mode M9 | |||
|---|---|---|---|
| Quadrant | BADHDUFLAG | Total packets | Discarded packets |
| A | 0 | 15 | 0 |
| B | 0 | 16 | 0 |
| C | 0 | 16 | 0 |
| D | 0 | 16 | 0 |
| Quadrant | Total seconds | Saturated seconds | Saturation percentage |
|---|---|---|---|
| A | 6528 | 35 | 0.536152% |
| B | 6528 | 56 | 0.857843% |
| C | 6528 | 79 | 1.210172% |
| D | 6528 | 192 | 2.941176% |
Noise dominated data is calculated using 1-second bins in cleaned event files. If a bin has >2000 counts, and if more than 50% of those come from <1% of pixels, then it is considered to be noise-dominated and hence unusable.
| Quadrant | # 1 sec bins | Bins with >0 counts | Bins with >2000 counts | High rate bins dominated by noise | Noise dominated (total time) | Noise dominated (detector-on time) | Marked lightcurve |
|---|---|---|---|---|---|---|---|
| A | 7823 | 6529 | 0 | 0 | 0.00% | 0.00% | 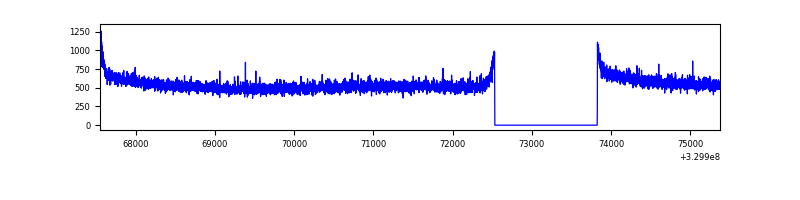 |
| B | 7823 | 6529 | 7 | 7 | 0.09% | 0.11% | 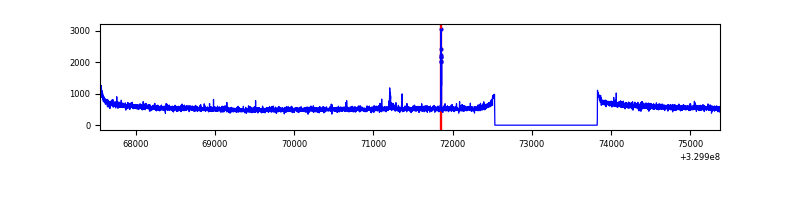 |
| C | 7823 | 6529 | 6 | 6 | 0.08% | 0.09% | 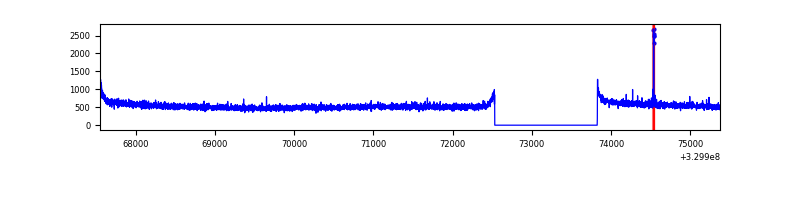 |
| D | 7823 | 6529 | 145 | 145 | 1.85% | 2.22% | 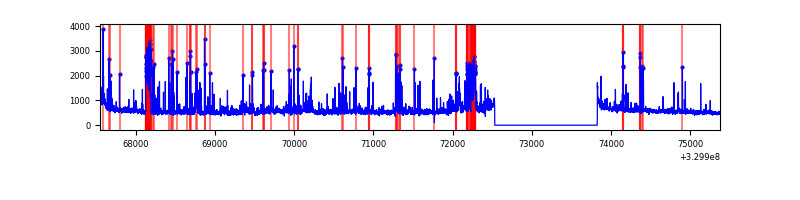 |
Top three noisy pixels from each quadrant. If the there are fewer than three noisy pixels in the level2.evt file, extra rows are filled as -1
| Pixel properties | Quadrant properties | ||||||
|---|---|---|---|---|---|---|---|
| Quadrant | DetID | PixID | Counts | Sigma | Mean | Median | Sigma |
| A | 13 | 254 | 9691 | 48.45 | 918 | 902 | 181.4 |
| A | 0 | 226 | 7923 | 38.7 | 918 | 902 | 181.4 |
| A | 3 | 137 | 7865 | 38.38 | 918 | 902 | 181.4 |
| B | 12 | 111 | 20158 | 113.2 | 915 | 897 | 170.2 |
| B | 5 | 171 | 18120 | 101.22 | 915 | 897 | 170.2 |
| B | 11 | 111 | 17904 | 99.95 | 915 | 897 | 170.2 |
| C | 14 | 238 | 141353 | 707.87 | 857 | 866 | 198.5 |
| C | 2 | 16 | 21114 | 102.02 | 857 | 866 | 198.5 |
| C | 13 | 61 | 5970 | 25.72 | 857 | 866 | 198.5 |
| D | 1 | 52 | 750848 | 3672.26 | 855 | 833 | 204.2 |
| D | 2 | 82 | 149831 | 729.53 | 855 | 833 | 204.2 |
| D | 8 | 195 | 147636 | 718.78 | 855 | 833 | 204.2 |
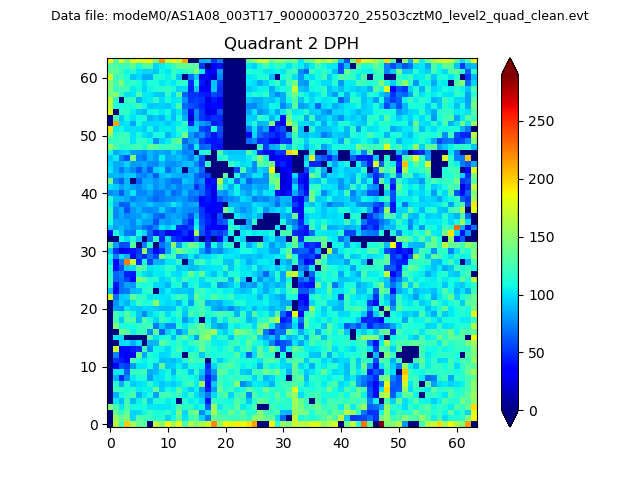
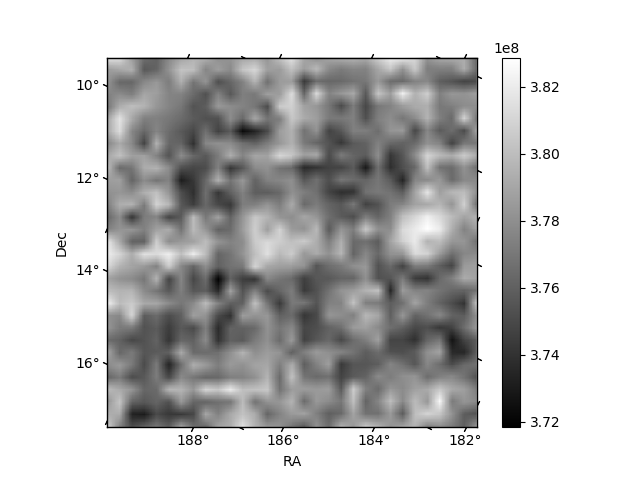
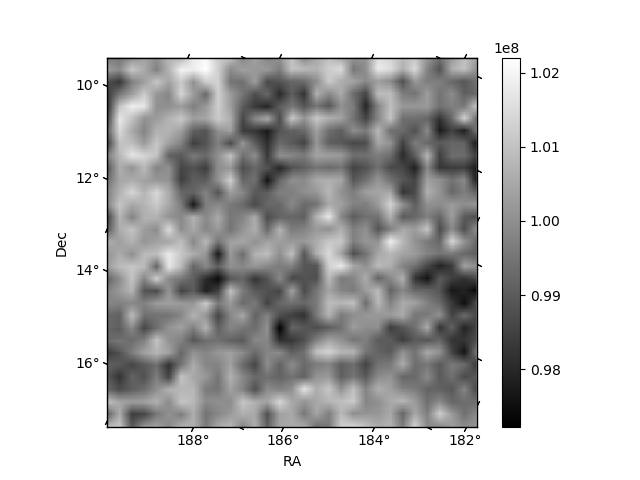
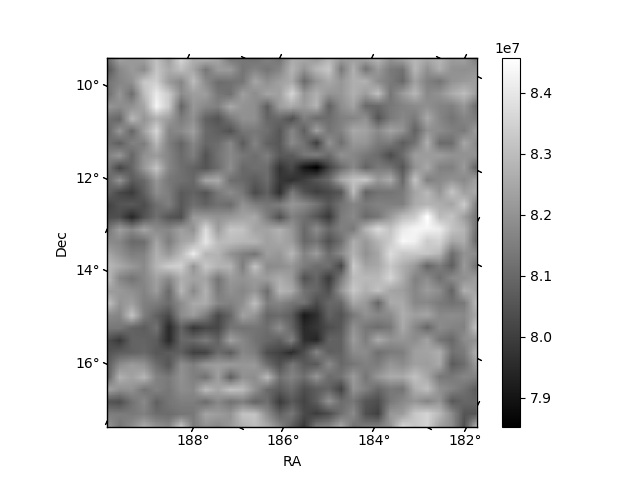
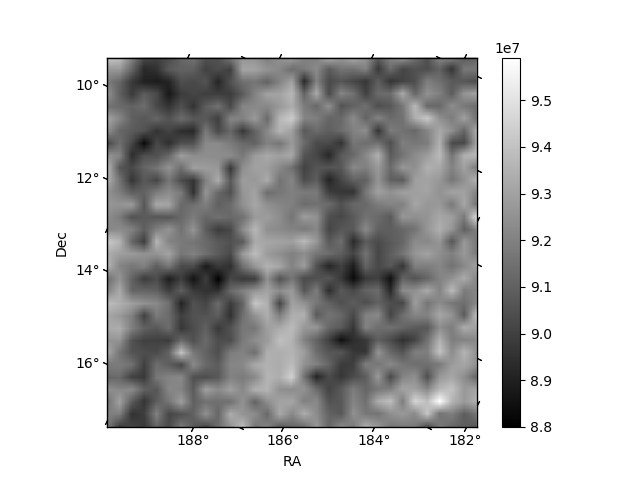
Histogram calculated using DETX and DETY for each event in the final _common_clean file
| Quadrant A | 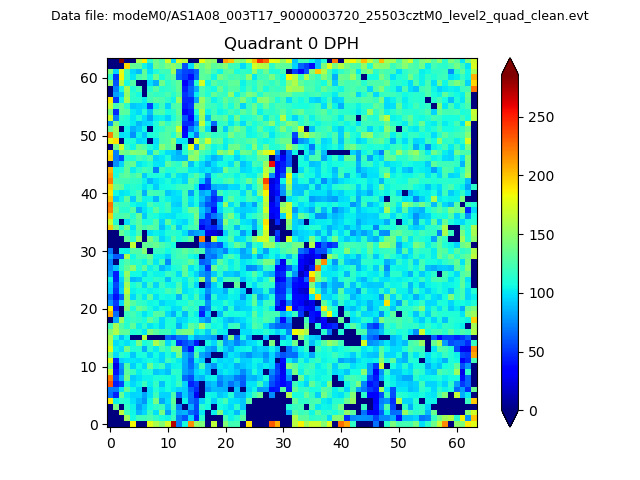 |
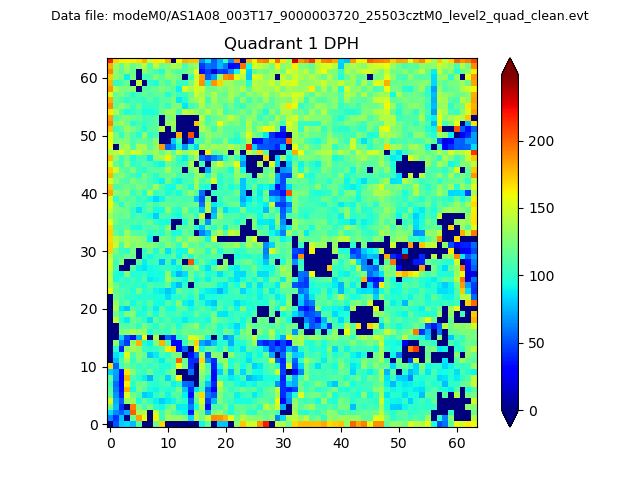 |
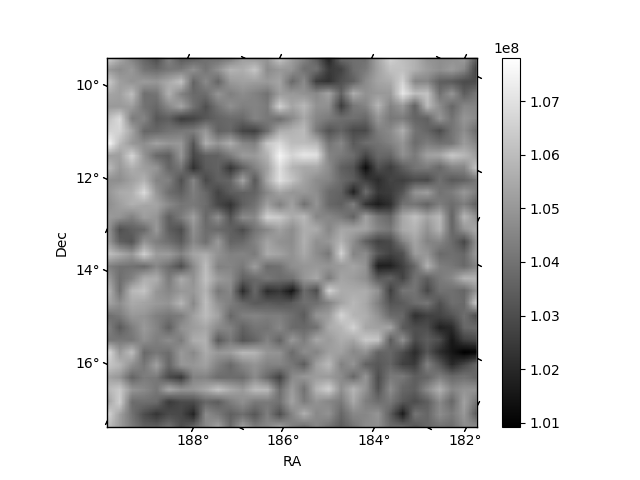
Quadrant B |
|---|---|---|---|
| Quadrant D | 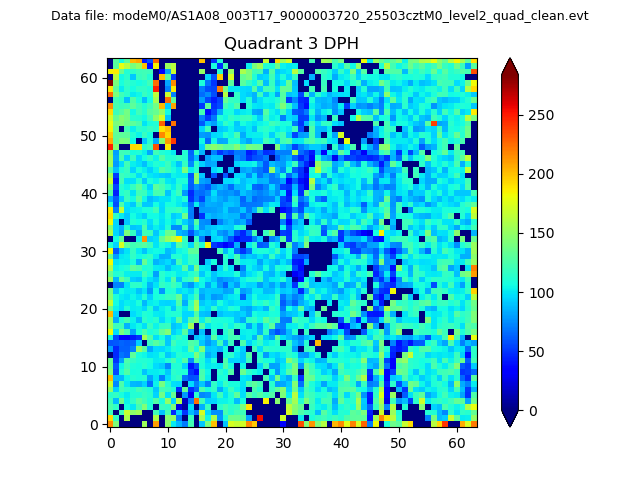 |
 |
Quadrant C |
| Plot type | Count rate plots | Images |
|---|---|---|
| Comparison with Poisson distribution Blue bars denote a histogram of data divided into 1 sec bins. Red curve is a Poisson curve with rate = median count rate of data. |
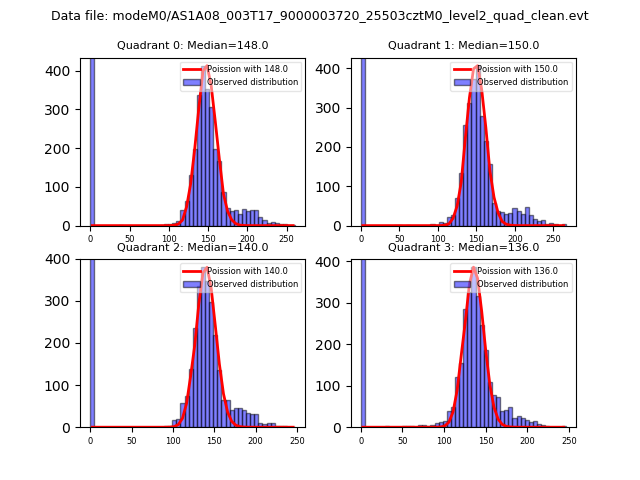 |
 |
| Quadrant-wise count rates Data is divided into 100 sec bins |
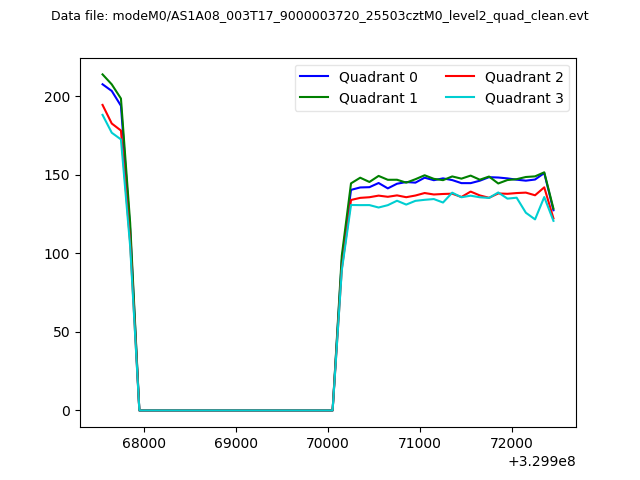 |
|
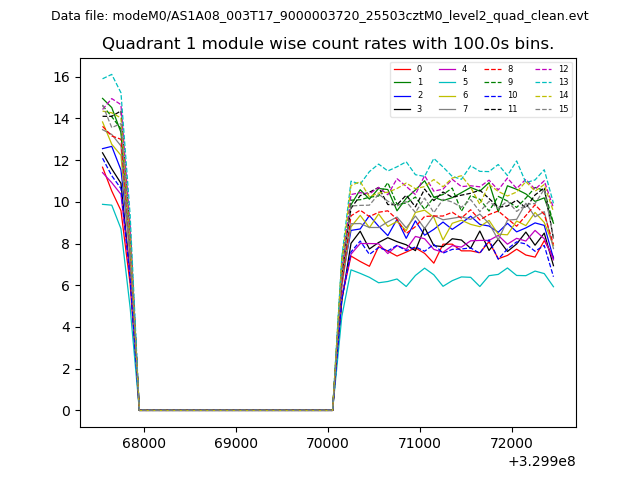
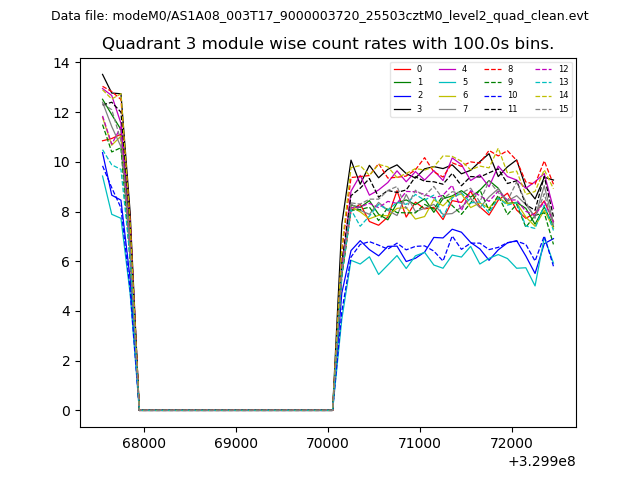
| Module-wise count rates for Quadrant A Data is divided into 100 sec bins |
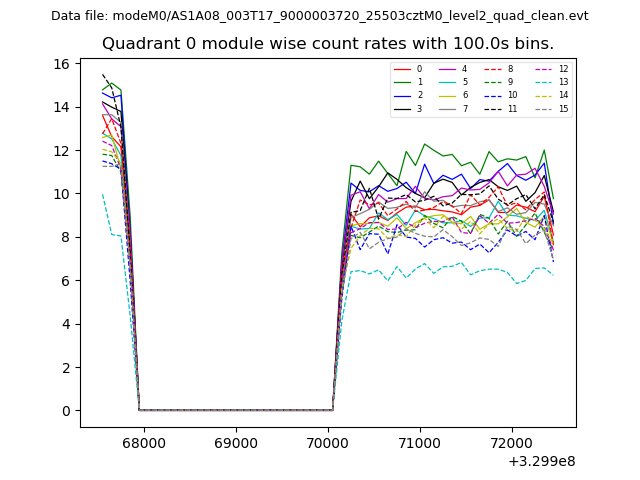 |
 |
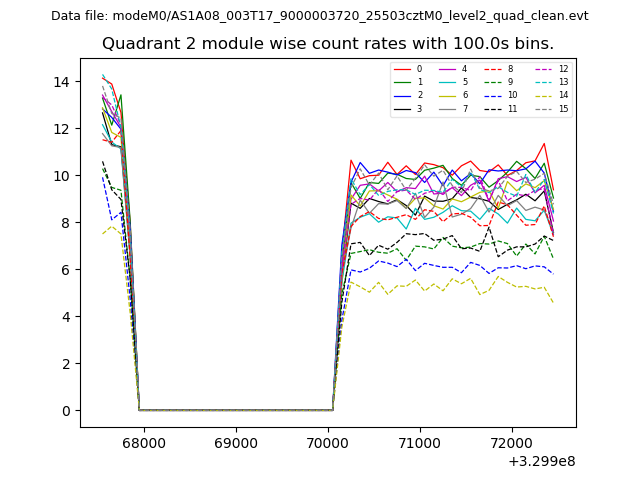
| Module-wise count rates for Quadrant B Data is divided into 100 sec bins |
 |
 |
| Module-wise count rates for Quadrant C Data is divided into 100 sec bins |
 |
 |
| Module-wise count rates for Quadrant D Data is divided into 100 sec bins |
 |
 |
| Parameter | Plot |
|---|---|
| CZT HV Monitor | 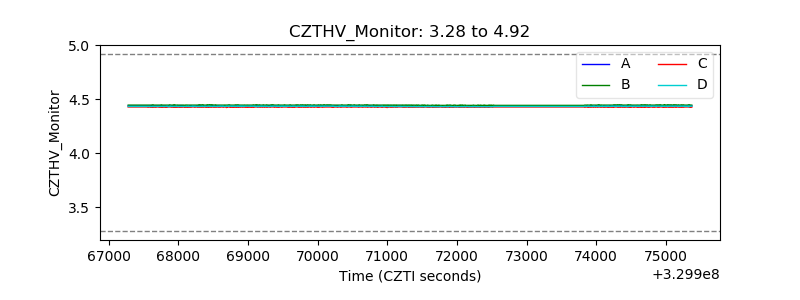 |
| D_VDD | 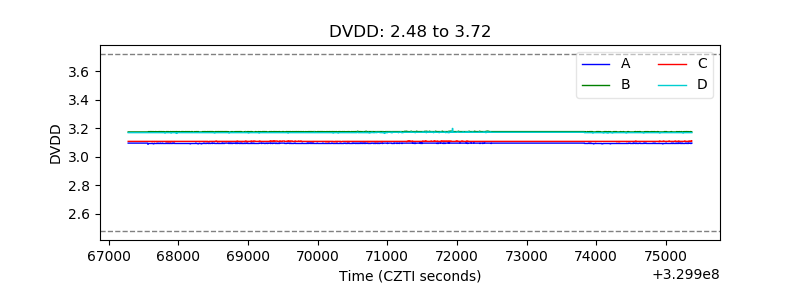 |
| Temperature 1 | 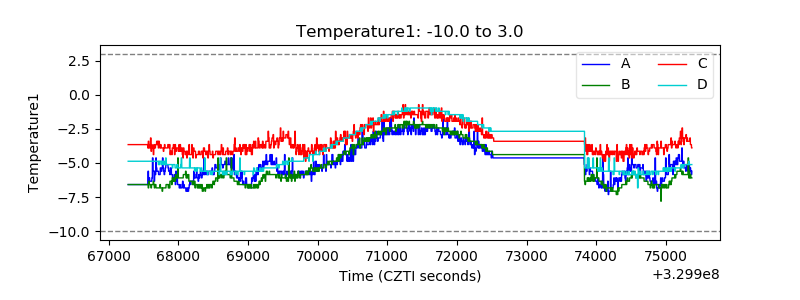 |
| Veto HV Monitor | 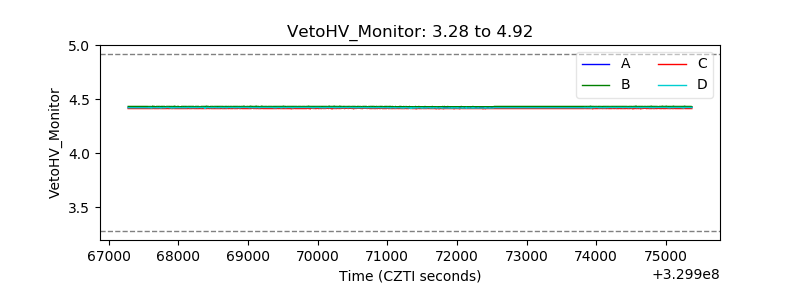 |
| Veto LLD | 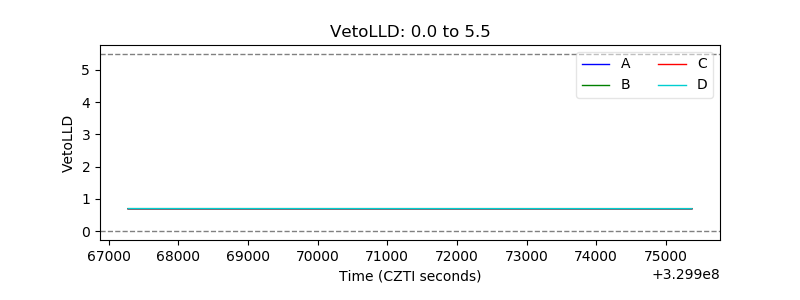 |
| Alpha Counter | 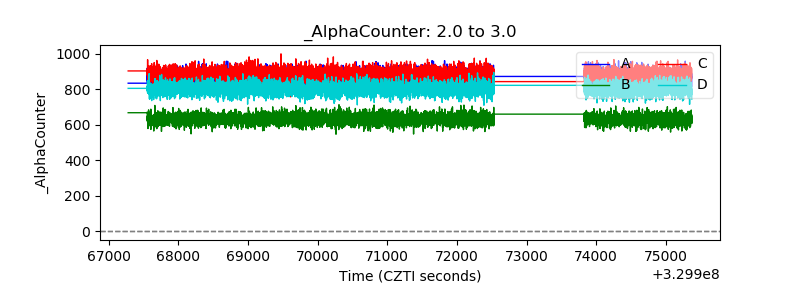 |
| _CPM_Rate | 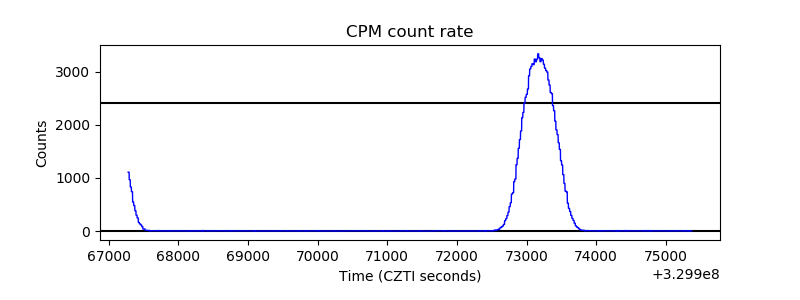 |
| CZT Counter | 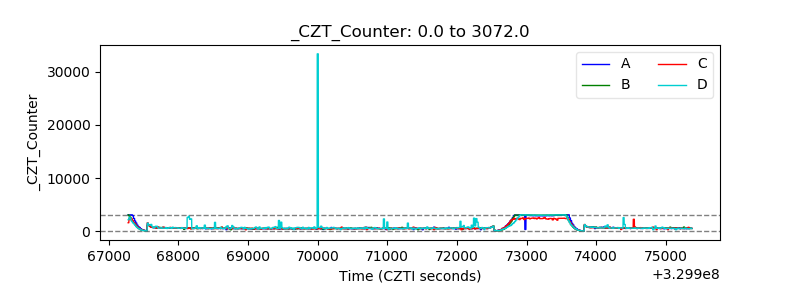 |
| +2.5 Volts monitor |  |
| +5 Volts monitor |  |
| _ROLL_ROT | 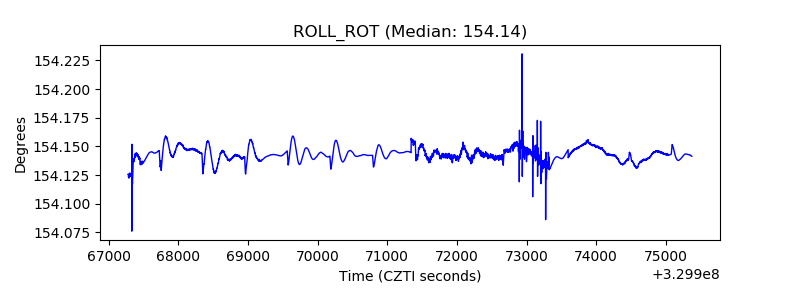 |
| _Roll_DEC | 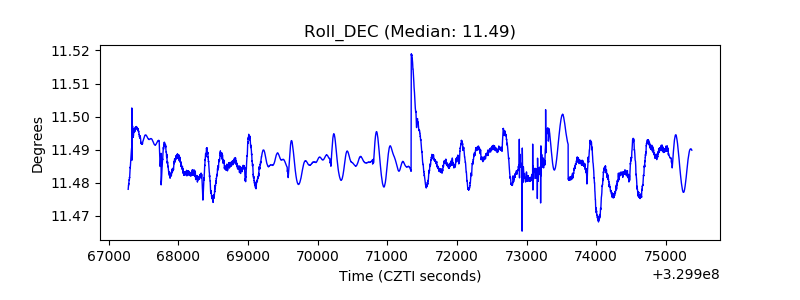 |
| _Roll_RA | 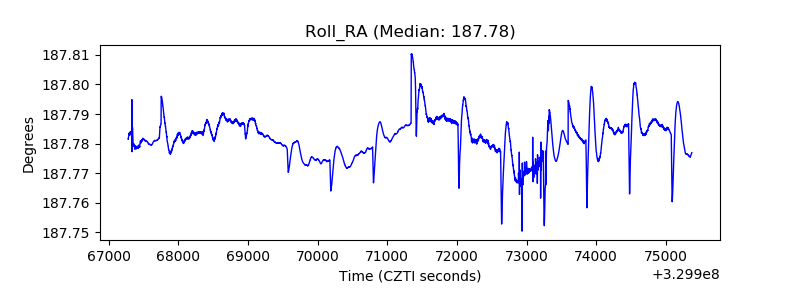 |
| Veto Counter | 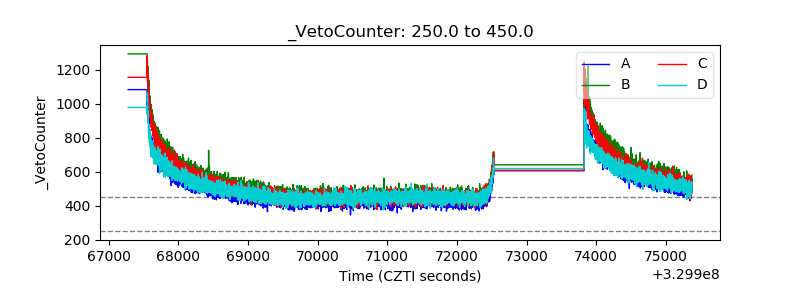 |