| Param | Original file | Final file |
|---|---|---|
| Filename | modeM0/AS1A08_003T17_9000003720_25505cztM0_level2.evt | modeM0/AS1A08_003T17_9000003720_25505cztM0_level2_quad_clean.evt |
| Size (bytes) | 492,598,080 | 75,461,760 |
| Size | 469.8 MB | 72.0 MB |
| Events in quadrant A | 3,509,158 | 480,096 |
| Events in quadrant B | 3,597,922 | 486,393 |
| Events in quadrant C | 3,463,916 | 447,121 |
| Events in quadrant D | 3,925,265 | 436,917 |
| Mode M0 | |||
|---|---|---|---|
| Quadrant | BADHDUFLAG | Total packets | Discarded packets |
| A | 0 | 14098 | 0 |
| B | 0 | 14535 | 0 |
| C | 0 | 13912 | 0 |
| D | 0 | 15526 | 0 |
| Mode M9 | |||
|---|---|---|---|
| Quadrant | BADHDUFLAG | Total packets | Discarded packets |
| A | 0 | 15 | 0 |
| B | 0 | 16 | 0 |
| C | 0 | 16 | 0 |
| D | 0 | 16 | 0 |
| Quadrant | Total seconds | Saturated seconds | Saturation percentage |
|---|---|---|---|
| A | 6216 | 95 | 1.528314% |
| B | 6216 | 132 | 2.123552% |
| C | 6216 | 145 | 2.332690% |
| D | 6216 | 108 | 1.737452% |
Noise dominated data is calculated using 1-second bins in cleaned event files. If a bin has >2000 counts, and if more than 50% of those come from <1% of pixels, then it is considered to be noise-dominated and hence unusable.
| Quadrant | # 1 sec bins | Bins with >0 counts | Bins with >2000 counts | High rate bins dominated by noise | Noise dominated (total time) | Noise dominated (detector-on time) | Marked lightcurve |
|---|---|---|---|---|---|---|---|
| A | 7546 | 6217 | 0 | 0 | 0.00% | 0.00% | 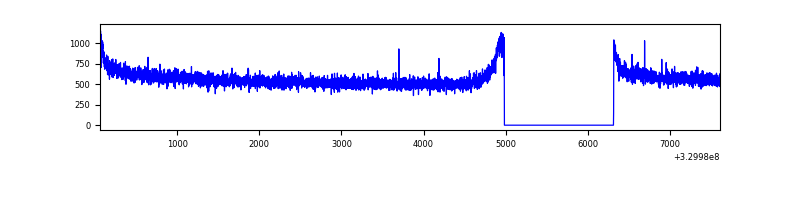 |
| B | 7546 | 6217 | 0 | 0 | 0.00% | 0.00% | 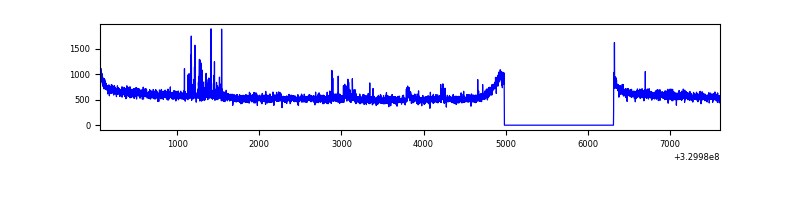 |
| C | 7546 | 6217 | 0 | 0 | 0.00% | 0.00% | 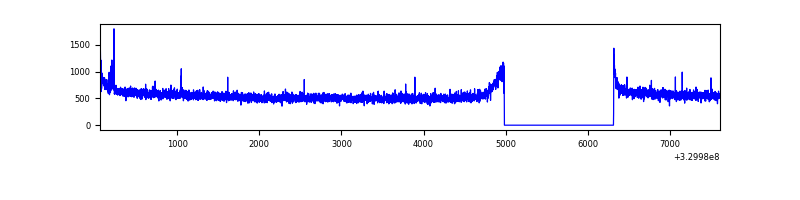 |
| D | 7546 | 6217 | 28 | 28 | 0.37% | 0.45% | 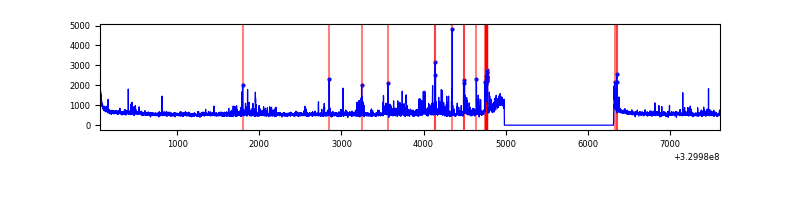 |
Top three noisy pixels from each quadrant. If the there are fewer than three noisy pixels in the level2.evt file, extra rows are filled as -1
| Pixel properties | Quadrant properties | ||||||
|---|---|---|---|---|---|---|---|
| Quadrant | DetID | PixID | Counts | Sigma | Mean | Median | Sigma |
| A | 13 | 254 | 8334 | 41.46 | 910 | 898 | 179.3 |
| A | 0 | 226 | 7844 | 38.73 | 910 | 898 | 179.3 |
| A | 3 | 137 | 7523 | 36.94 | 910 | 898 | 179.3 |
| B | 5 | 235 | 59361 | 346.74 | 898 | 882 | 168.7 |
| B | 0 | 190 | 29451 | 169.4 | 898 | 882 | 168.7 |
| B | 12 | 111 | 19722 | 111.71 | 898 | 882 | 168.7 |
| C | 14 | 238 | 137532 | 704.82 | 843 | 852 | 193.9 |
| C | 3 | 233 | 24866 | 123.83 | 843 | 852 | 193.9 |
| C | 0 | 10 | 11802 | 56.47 | 843 | 852 | 193.9 |
| D | 1 | 52 | 422877 | 2024.05 | 861 | 840 | 208.5 |
| D | 8 | 195 | 196142 | 936.65 | 861 | 840 | 208.5 |
| D | 7 | 238 | 38326 | 179.78 | 861 | 840 | 208.5 |
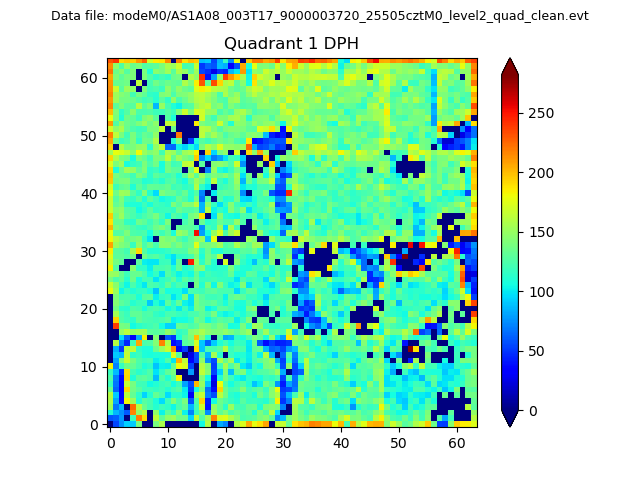
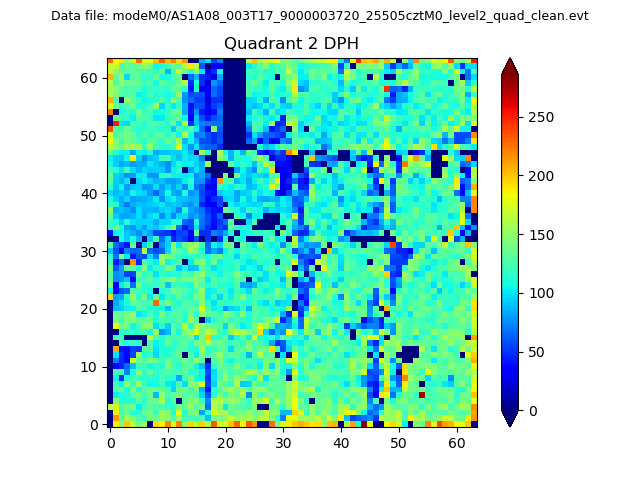
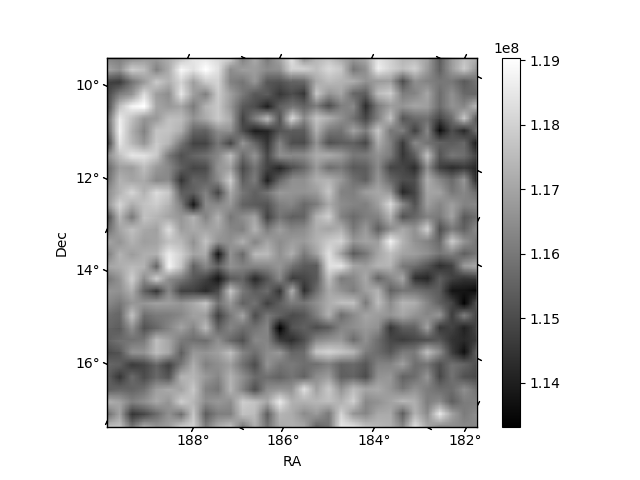
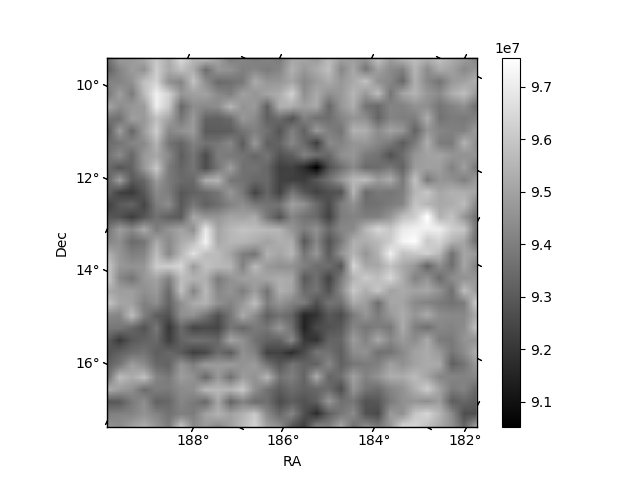
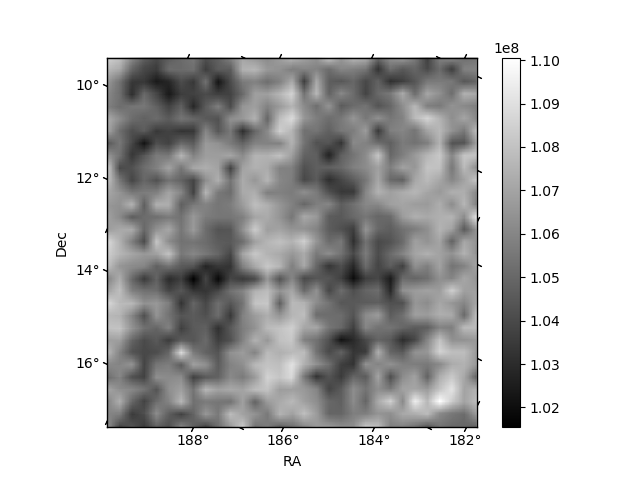
Histogram calculated using DETX and DETY for each event in the final _common_clean file
| Quadrant A |  |
 |
Quadrant B |
|---|---|---|---|
| Quadrant D | 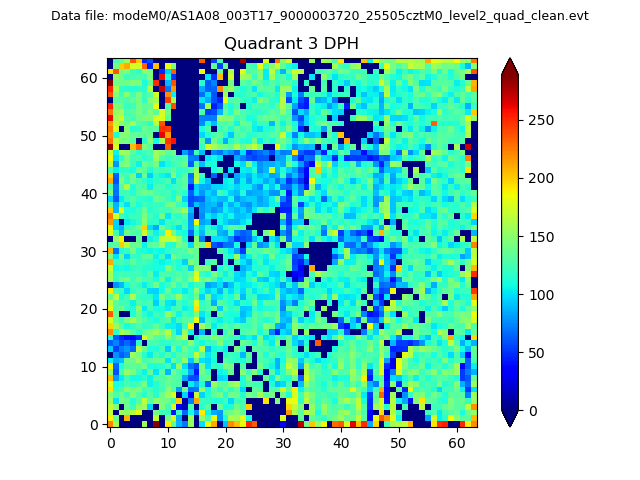 |
 |
Quadrant C |
| Plot type | Count rate plots | Images |
|---|---|---|
| Comparison with Poisson distribution Blue bars denote a histogram of data divided into 1 sec bins. Red curve is a Poisson curve with rate = median count rate of data. |
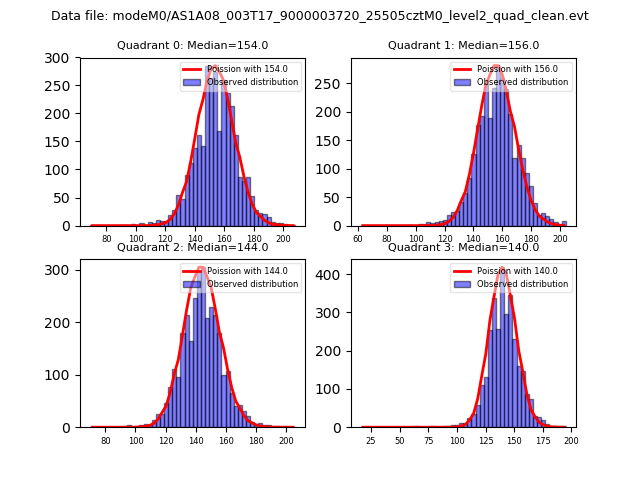 |
 |
| Quadrant-wise count rates Data is divided into 100 sec bins |
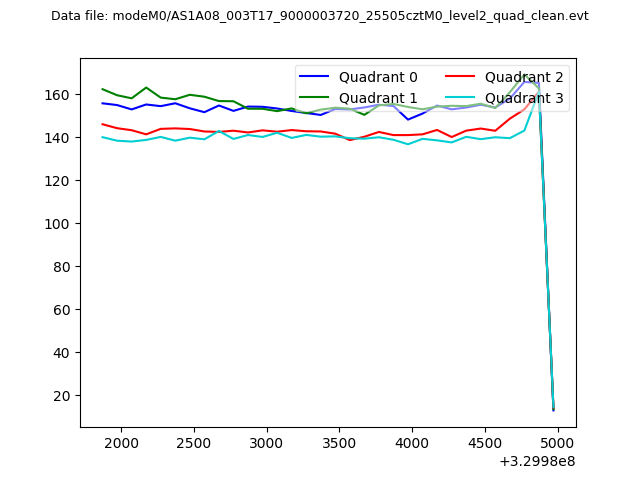 |
|
| Module-wise count rates for Quadrant A Data is divided into 100 sec bins |
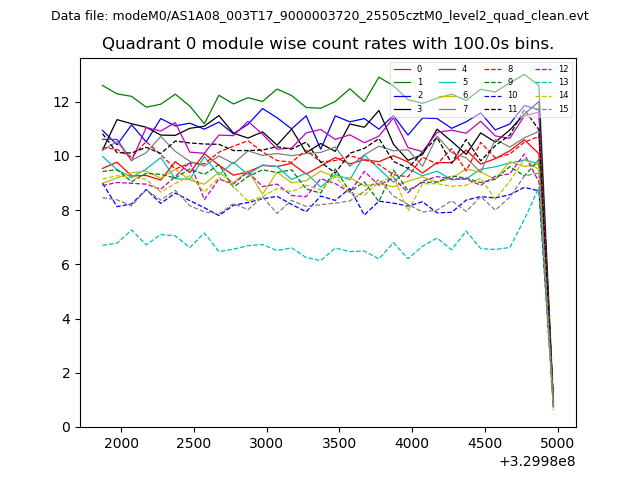 |
 |
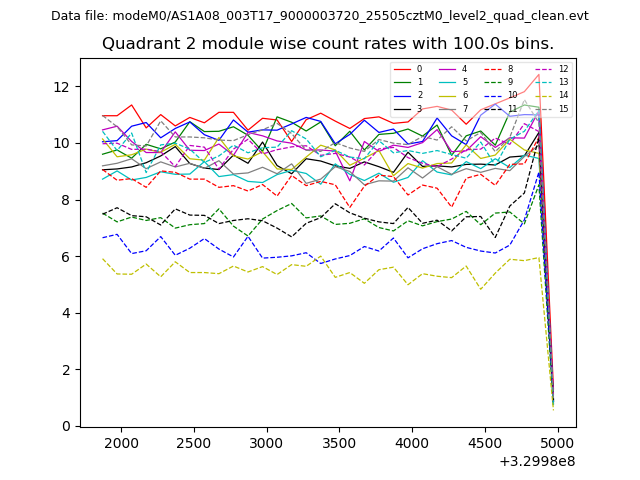
| Module-wise count rates for Quadrant B Data is divided into 100 sec bins |
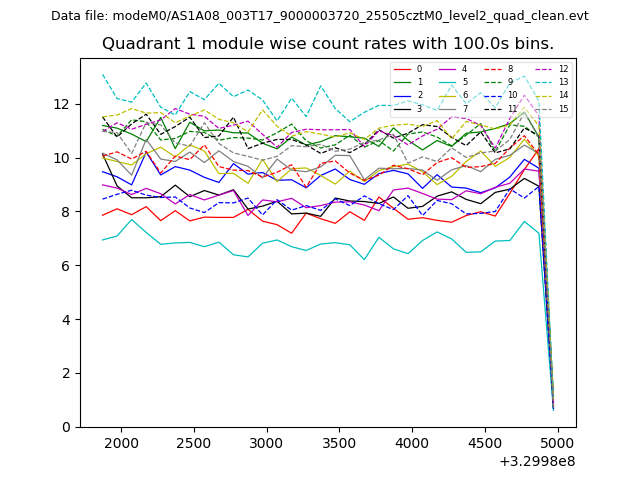 |
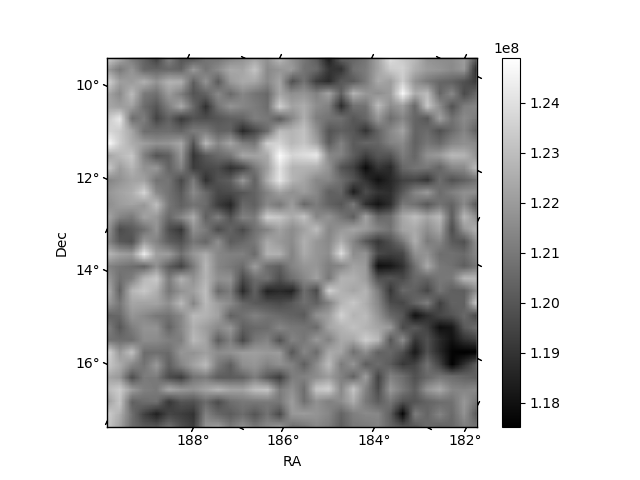 |
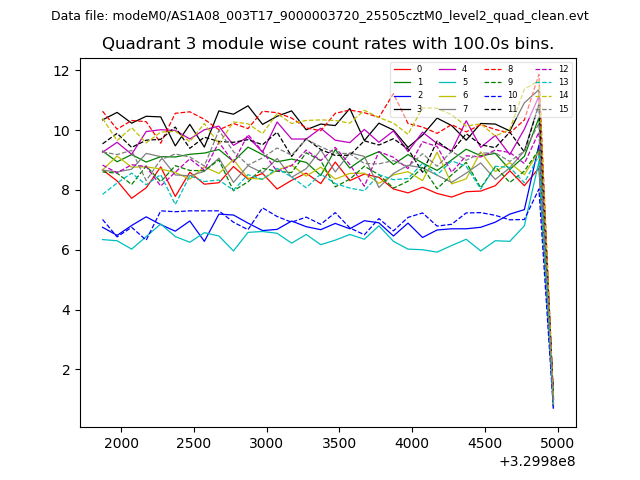
| Module-wise count rates for Quadrant C Data is divided into 100 sec bins |
 |
 |
| Module-wise count rates for Quadrant D Data is divided into 100 sec bins |
 |
 |
| Parameter | Plot |
|---|---|
| CZT HV Monitor | 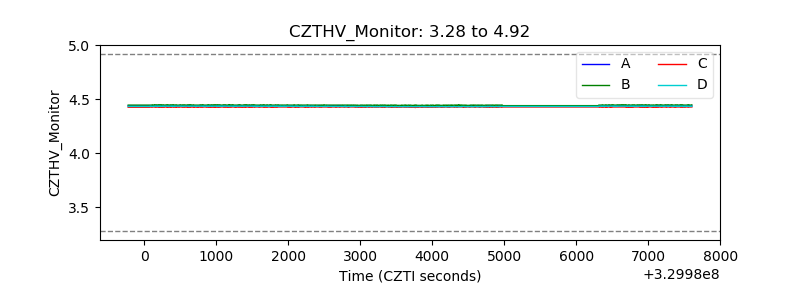 |
| D_VDD | 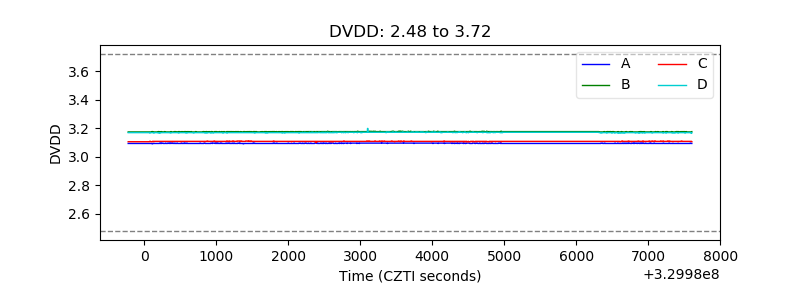 |
| Temperature 1 | 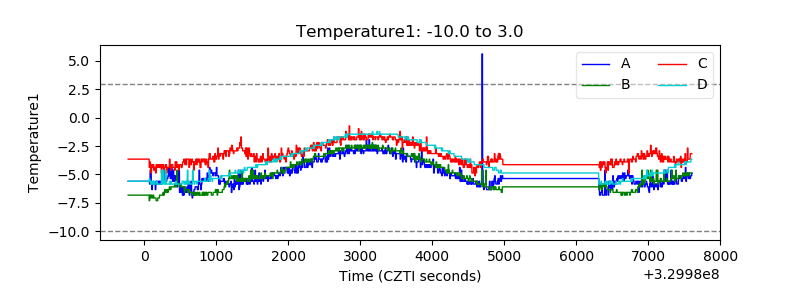 |
| Veto HV Monitor | 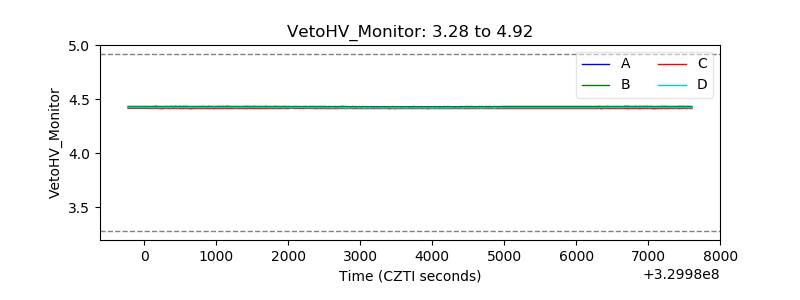 |
| Veto LLD | 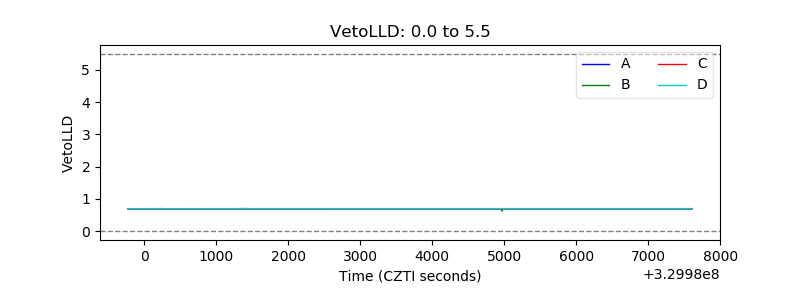 |
| Alpha Counter | 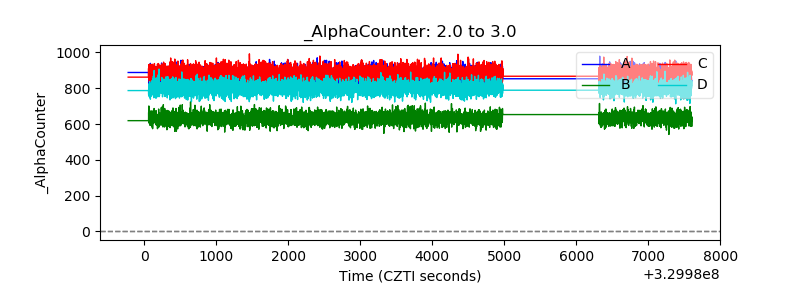 |
| _CPM_Rate | 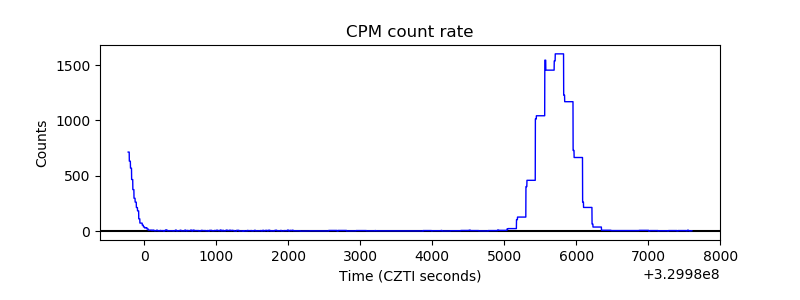 |
| CZT Counter |  |
| +2.5 Volts monitor |  |
| +5 Volts monitor |  |
| _ROLL_ROT |  |
| _Roll_DEC | 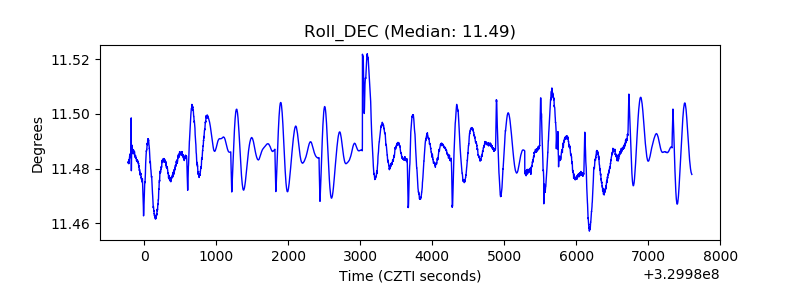 |
| _Roll_RA | 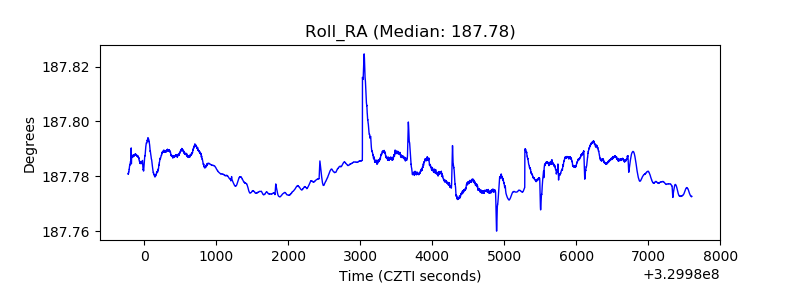 |
| Veto Counter | 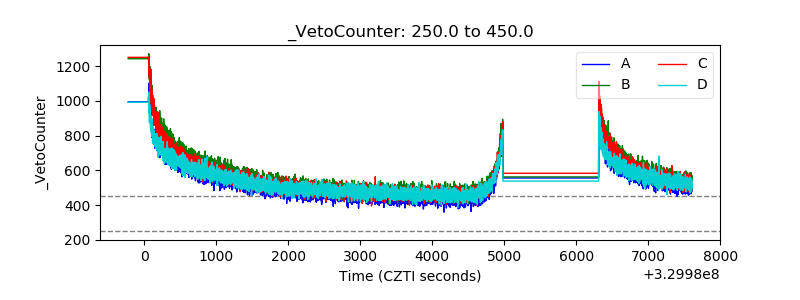 |