| Param | Original file | Final file |
|---|---|---|
| Filename | modeM0/AS1A08_003T17_9000003720_25506cztM0_level2.evt | modeM0/AS1A08_003T17_9000003720_25506cztM0_level2_quad_clean.evt |
| Size (bytes) | 328,968,000 | 65,522,880 |
| Size | 313.7 MB | 62.5 MB |
| Events in quadrant A | 2,277,401 | 437,258 |
| Events in quadrant B | 2,362,775 | 439,350 |
| Events in quadrant C | 2,243,740 | 404,644 |
| Events in quadrant D | 2,785,009 | 399,044 |
| Mode M0 | |||
|---|---|---|---|
| Quadrant | BADHDUFLAG | Total packets | Discarded packets |
| A | 0 | 9243 | 0 |
| B | 0 | 9525 | 0 |
| C | 0 | 9188 | 0 |
| D | 0 | 11014 | 0 |
| Mode M9 | |||
|---|---|---|---|
| Quadrant | BADHDUFLAG | Total packets | Discarded packets |
| A | 0 | 9 | 0 |
| B | 0 | 10 | 0 |
| C | 0 | 10 | 0 |
| D | 0 | 10 | 0 |
| Quadrant | Total seconds | Saturated seconds | Saturation percentage |
|---|---|---|---|
| A | 4315 | 26 | 0.602549% |
| B | 4315 | 40 | 0.926999% |
| C | 4315 | 47 | 1.089224% |
| D | 4315 | 61 | 1.413673% |
Noise dominated data is calculated using 1-second bins in cleaned event files. If a bin has >2000 counts, and if more than 50% of those come from <1% of pixels, then it is considered to be noise-dominated and hence unusable.
| Quadrant | # 1 sec bins | Bins with >0 counts | Bins with >2000 counts | High rate bins dominated by noise | Noise dominated (total time) | Noise dominated (detector-on time) | Marked lightcurve |
|---|---|---|---|---|---|---|---|
| A | 4315 | 4315 | 0 | 0 | 0.00% | 0.00% | 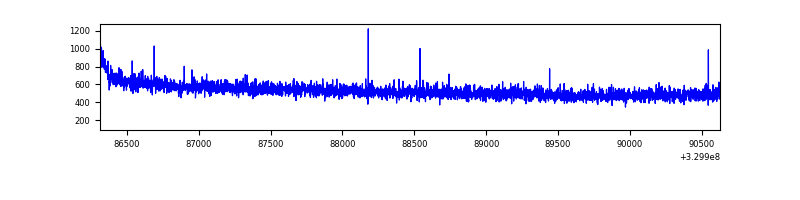 |
| B | 4315 | 4315 | 13 | 13 | 0.30% | 0.30% | 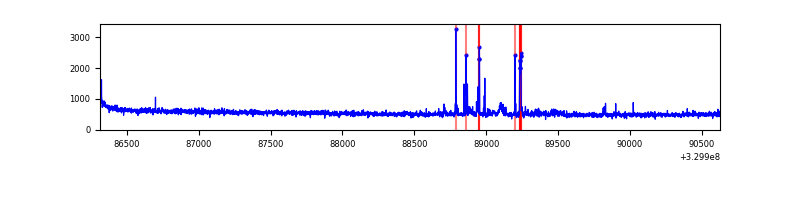 |
| C | 4315 | 4315 | 0 | 0 | 0.00% | 0.00% | 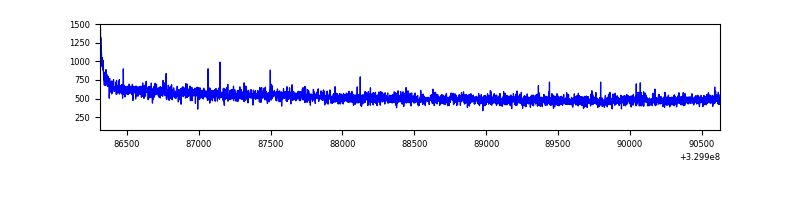 |
| D | 4315 | 4315 | 47 | 47 | 1.09% | 1.09% | 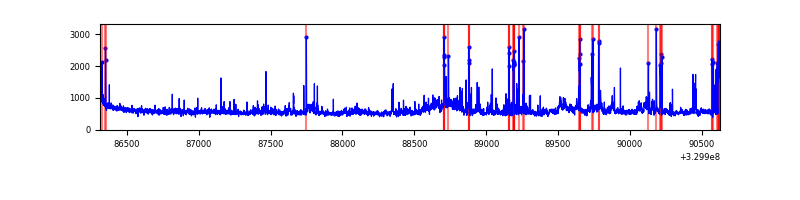 |
Top three noisy pixels from each quadrant. If the there are fewer than three noisy pixels in the level2.evt file, extra rows are filled as -1
| Pixel properties | Quadrant properties | ||||||
|---|---|---|---|---|---|---|---|
| Quadrant | DetID | PixID | Counts | Sigma | Mean | Median | Sigma |
| A | 13 | 254 | 6395 | 49.41 | 591 | 582 | 117.7 |
| A | 0 | 226 | 5116 | 38.54 | 591 | 582 | 117.7 |
| A | 3 | 137 | 4918 | 36.85 | 591 | 582 | 117.7 |
| B | 0 | 229 | 70879 | 652.09 | 578 | 567 | 107.8 |
| B | 0 | 190 | 32413 | 295.35 | 578 | 567 | 107.8 |
| B | 12 | 111 | 12506 | 110.73 | 578 | 567 | 107.8 |
| C | 14 | 238 | 90560 | 708.33 | 548 | 551 | 127.1 |
| C | 3 | 233 | 9951 | 73.97 | 548 | 551 | 127.1 |
| C | 0 | 10 | 6608 | 47.67 | 548 | 551 | 127.1 |
| D | 1 | 52 | 328554 | 2405.19 | 560 | 545 | 136.4 |
| D | 7 | 238 | 157544 | 1151.22 | 560 | 545 | 136.4 |
| D | 8 | 195 | 150885 | 1102.4 | 560 | 545 | 136.4 |
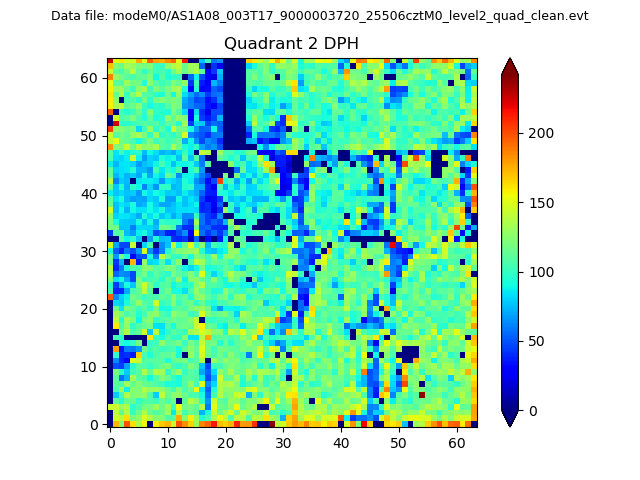
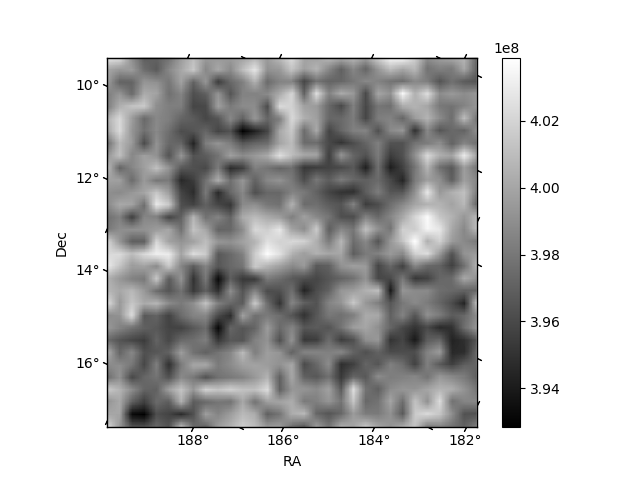
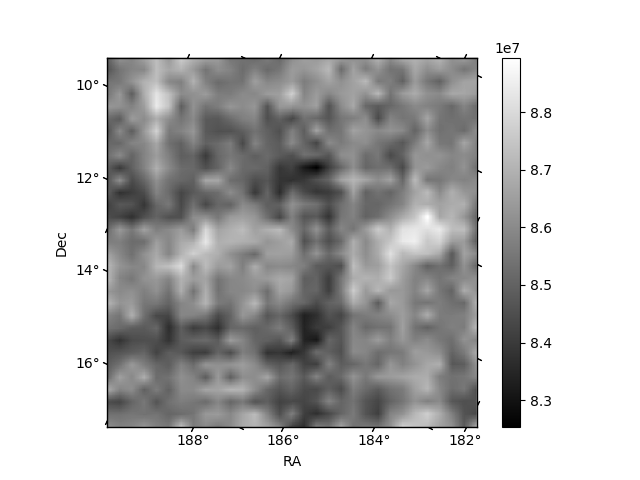
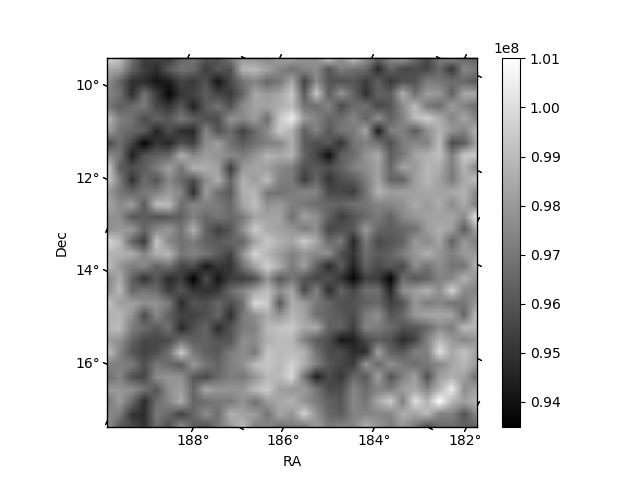
Histogram calculated using DETX and DETY for each event in the final _common_clean file
| Quadrant A | 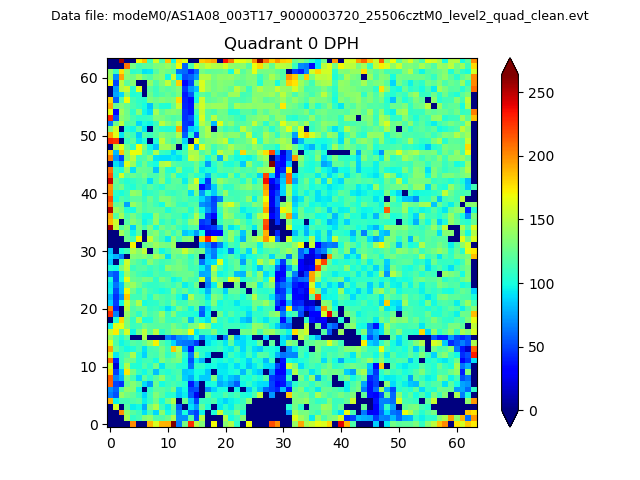 |
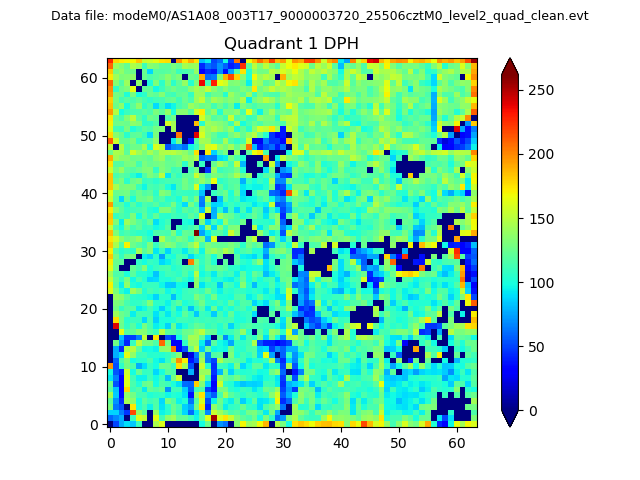 |
Quadrant B |
|---|---|---|---|
| Quadrant D | 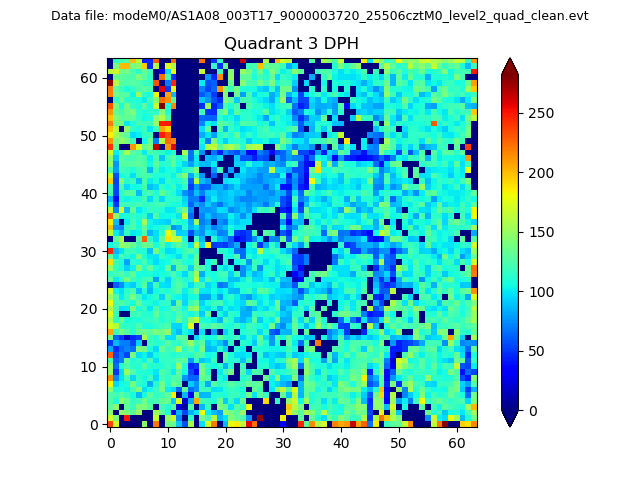 |
 |
Quadrant C |
| Plot type | Count rate plots | Images |
|---|---|---|
| Comparison with Poisson distribution Blue bars denote a histogram of data divided into 1 sec bins. Red curve is a Poisson curve with rate = median count rate of data. |
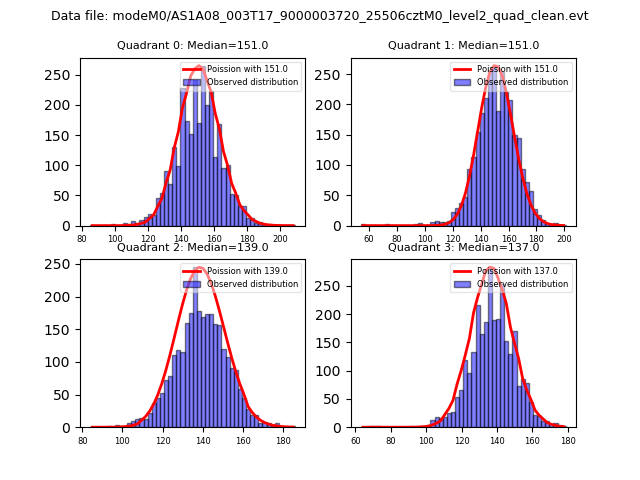 |
 |
| Quadrant-wise count rates Data is divided into 100 sec bins |
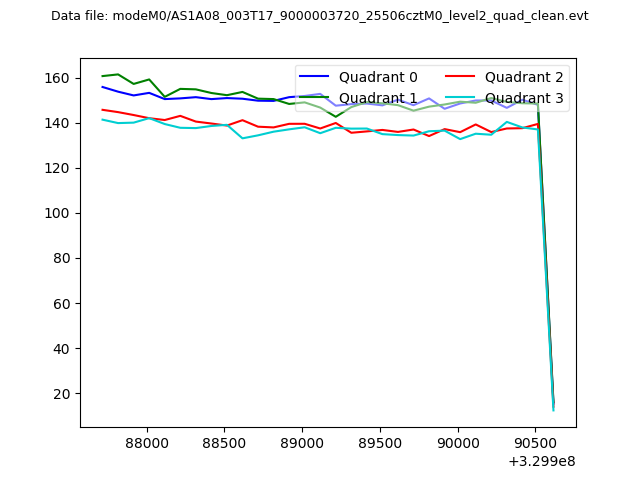 |
|
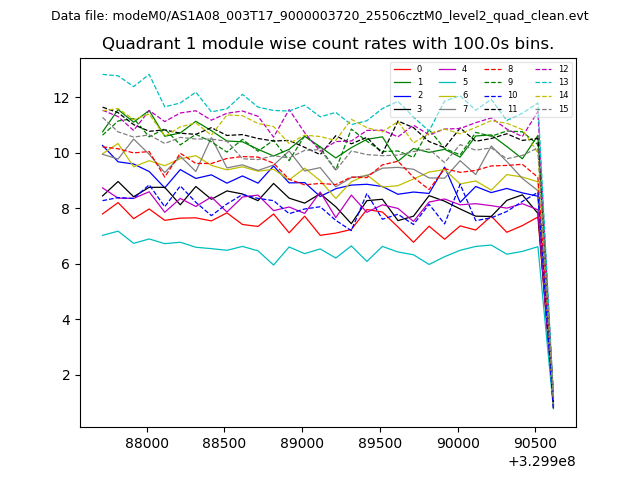
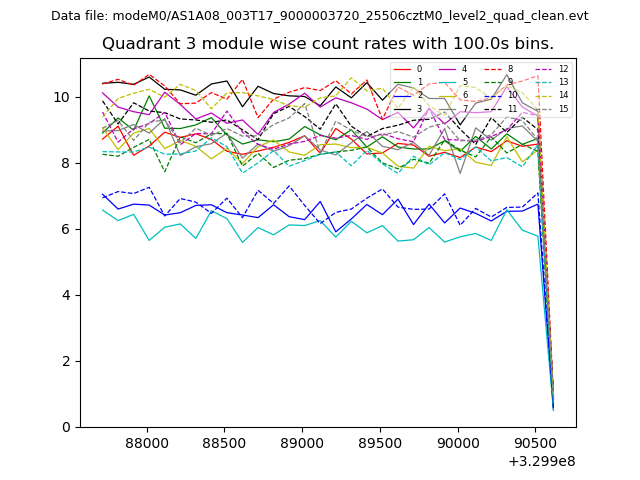
| Module-wise count rates for Quadrant A Data is divided into 100 sec bins |
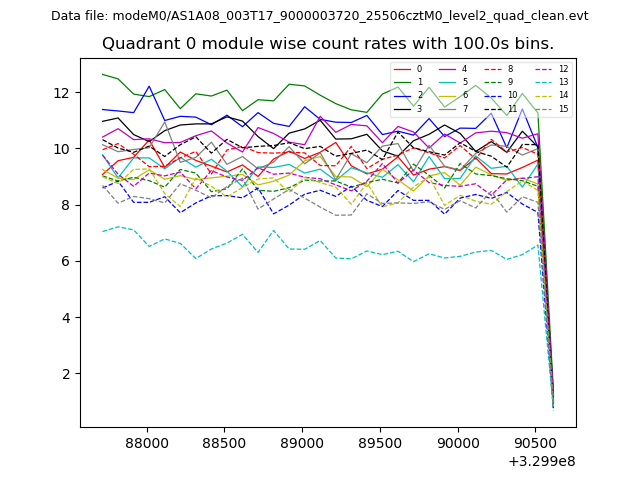 |
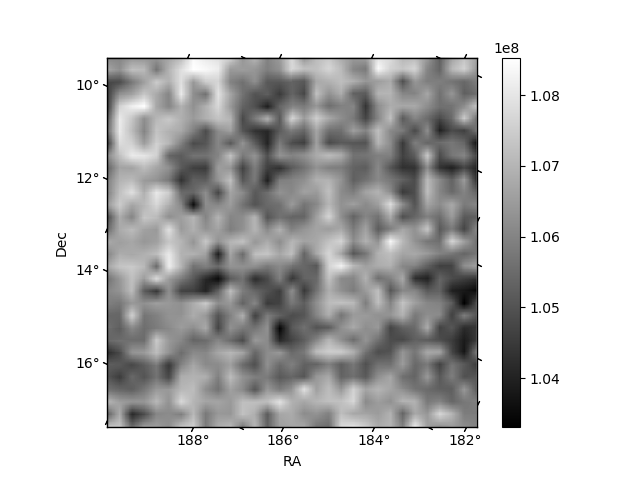 |
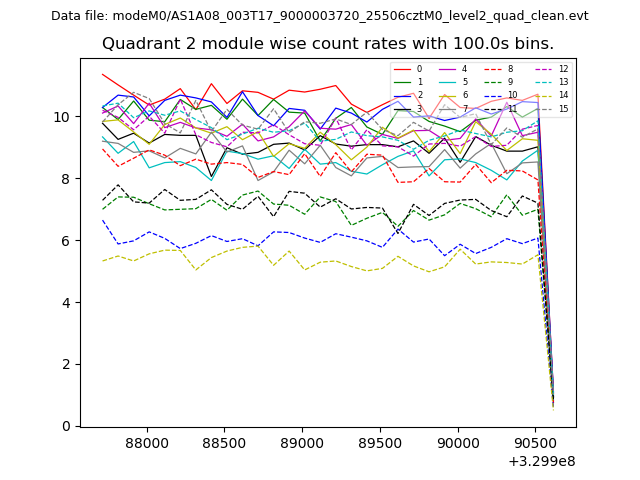
| Module-wise count rates for Quadrant B Data is divided into 100 sec bins |
 |
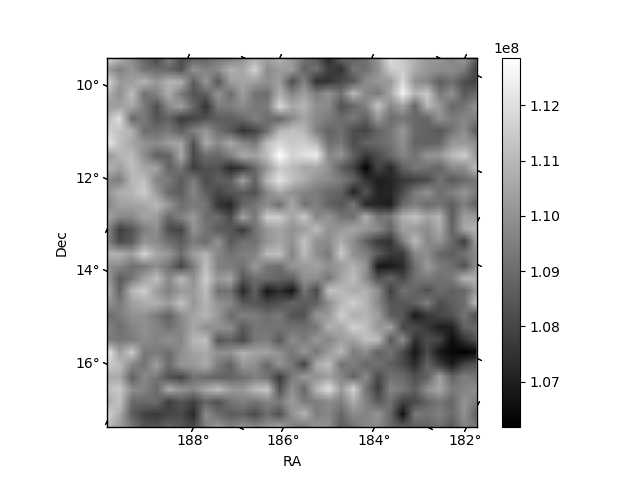 |
| Module-wise count rates for Quadrant C Data is divided into 100 sec bins |
 |
 |
| Module-wise count rates for Quadrant D Data is divided into 100 sec bins |
 |
 |
| Parameter | Plot |
|---|---|
| CZT HV Monitor | 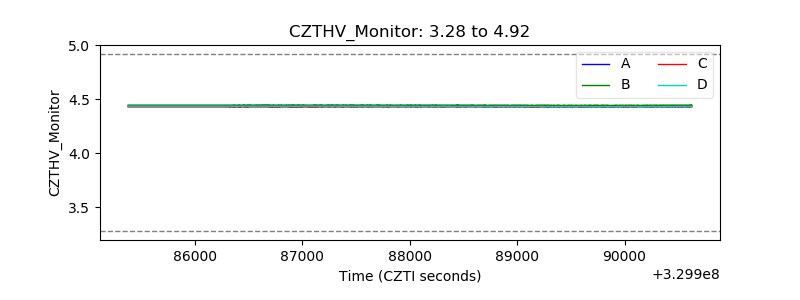 |
| D_VDD | 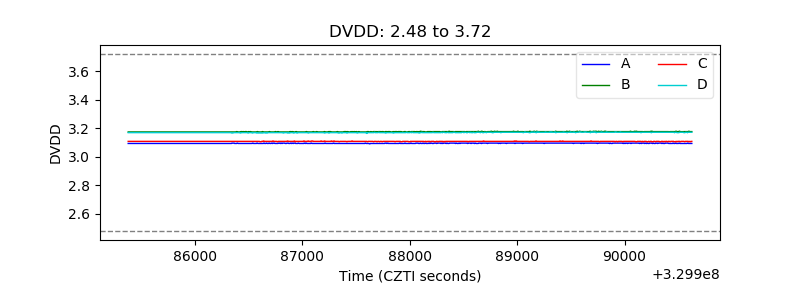 |
| Temperature 1 | 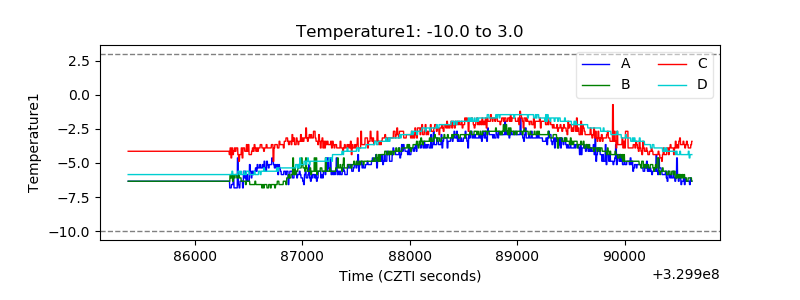 |
| Veto HV Monitor | 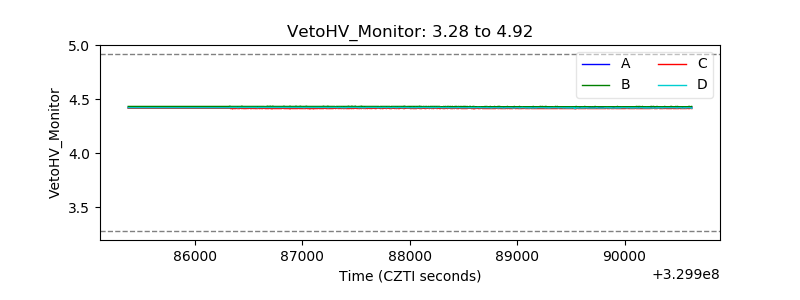 |
| Veto LLD | 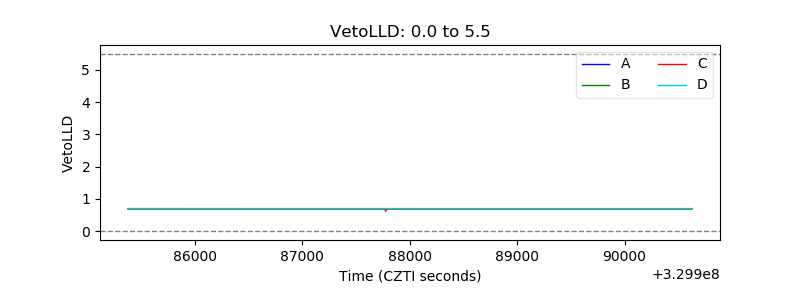 |
| Alpha Counter | 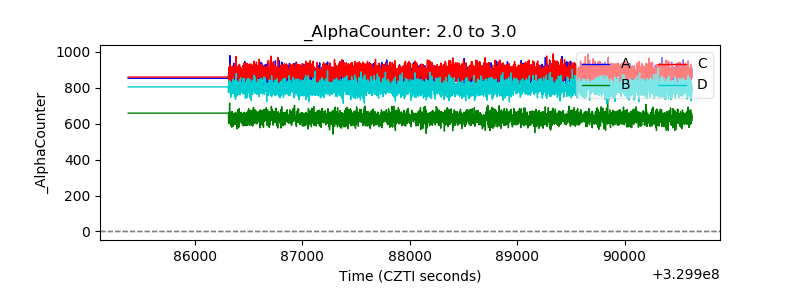 |
| _CPM_Rate | 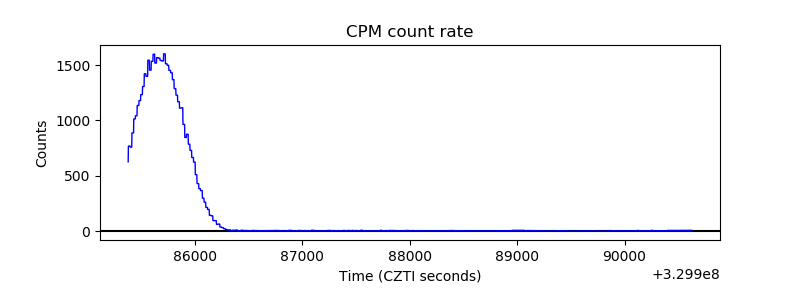 |
| CZT Counter | 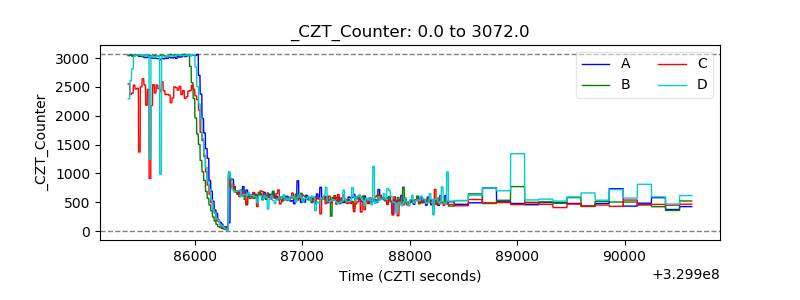 |
| +2.5 Volts monitor |  |
| +5 Volts monitor |  |
| _ROLL_ROT | 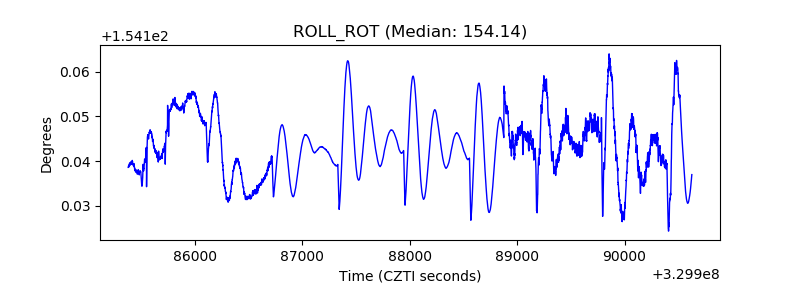 |
| _Roll_DEC | 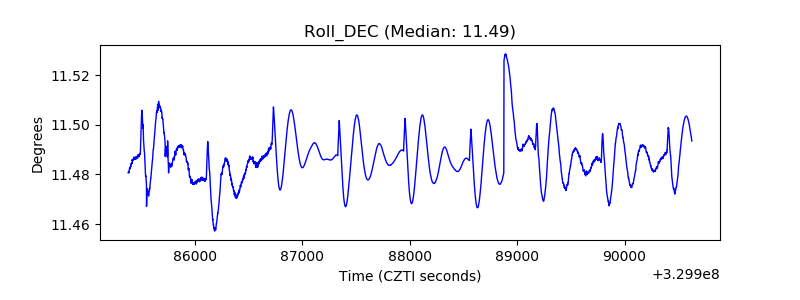 |
| _Roll_RA | 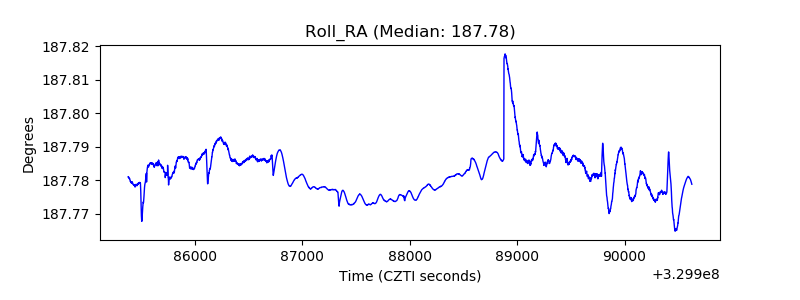 |
| Veto Counter | 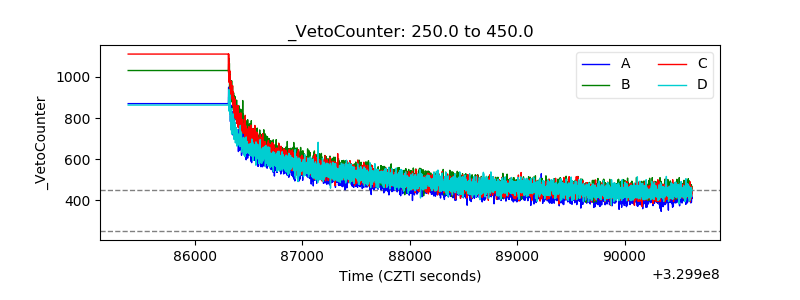 |