| Param | Original file | Final file |
|---|---|---|
| Filename | modeM0/AS1A07_147T01_9000003722_25506cztM0_level2.evt | modeM0/AS1A07_147T01_9000003722_25506cztM0_level2_quad_clean.evt |
| Size (bytes) | 141,217,920 | 17,187,840 |
| Size | 134.7 MB | 16.4 MB |
| Events in quadrant A | 1,030,036 | 100,665 |
| Events in quadrant B | 1,028,651 | 103,261 |
| Events in quadrant C | 1,011,725 | 94,911 |
| Events in quadrant D | 1,086,773 | 94,472 |
| Mode M0 | |||
|---|---|---|---|
| Quadrant | BADHDUFLAG | Total packets | Discarded packets |
| A | 0 | 4053 | 0 |
| B | 0 | 4060 | 0 |
| C | 0 | 4011 | 0 |
| D | 0 | 4253 | 0 |
| Mode M9 | |||
|---|---|---|---|
| Quadrant | BADHDUFLAG | Total packets | Discarded packets |
| A | 0 | 12 | 0 |
| B | 0 | 12 | 0 |
| C | 0 | 12 | 0 |
| D | 0 | 12 | 0 |
| Quadrant | Total seconds | Saturated seconds | Saturation percentage |
|---|---|---|---|
| A | 1726 | 107 | 6.199305% |
| B | 1725 | 117 | 6.782609% |
| C | 1725 | 124 | 7.188406% |
| D | 1725 | 82 | 4.753623% |
Noise dominated data is calculated using 1-second bins in cleaned event files. If a bin has >2000 counts, and if more than 50% of those come from <1% of pixels, then it is considered to be noise-dominated and hence unusable.
| Quadrant | # 1 sec bins | Bins with >0 counts | Bins with >2000 counts | High rate bins dominated by noise | Noise dominated (total time) | Noise dominated (detector-on time) | Marked lightcurve |
|---|---|---|---|---|---|---|---|
| A | 2921 | 1728 | 0 | 0 | 0.00% | 0.00% | 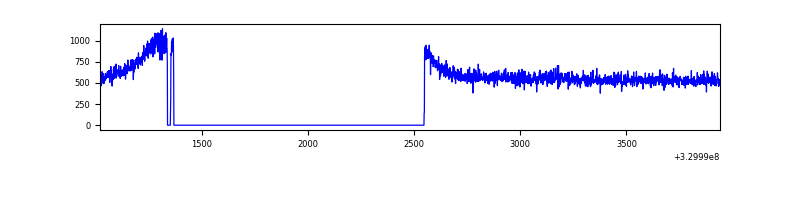 |
| B | 2920 | 1727 | 0 | 0 | 0.00% | 0.00% | 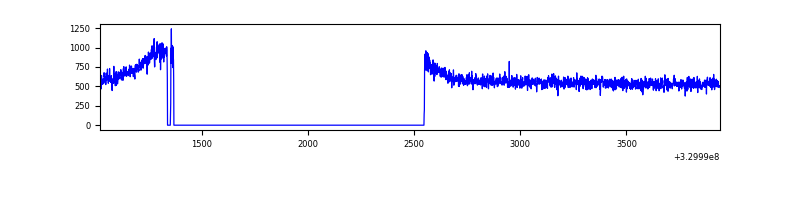 |
| C | 2920 | 1727 | 0 | 0 | 0.00% | 0.00% | 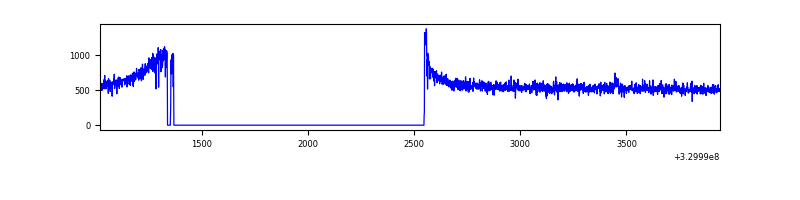 |
| D | 2920 | 1727 | 4 | 4 | 0.14% | 0.23% | 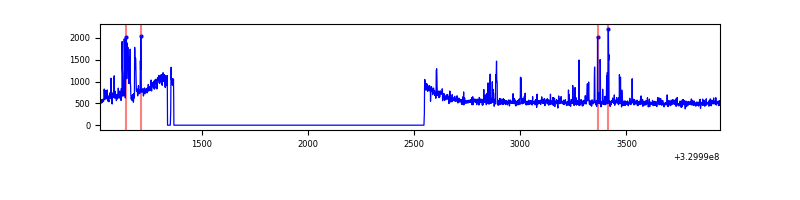 |
Top three noisy pixels from each quadrant. If the there are fewer than three noisy pixels in the level2.evt file, extra rows are filled as -1
| Pixel properties | Quadrant properties | ||||||
|---|---|---|---|---|---|---|---|
| Quadrant | DetID | PixID | Counts | Sigma | Mean | Median | Sigma |
| A | 13 | 254 | 2513 | 40.54 | 266 | 261 | 55.5 |
| A | 3 | 137 | 2426 | 38.98 | 266 | 261 | 55.5 |
| A | 0 | 226 | 2306 | 36.82 | 266 | 261 | 55.5 |
| B | 12 | 111 | 6461 | 117.01 | 261 | 254 | 53.0 |
| B | 11 | 111 | 6028 | 108.85 | 261 | 254 | 53.0 |
| B | 14 | 111 | 5575 | 100.31 | 261 | 254 | 53.0 |
| C | 14 | 238 | 38719 | 642.37 | 247 | 247 | 59.9 |
| C | 0 | 10 | 8105 | 131.21 | 247 | 247 | 59.9 |
| C | 3 | 233 | 2800 | 42.63 | 247 | 247 | 59.9 |
| D | 1 | 52 | 90397 | 1398.29 | 255 | 247 | 64.5 |
| D | 8 | 195 | 33816 | 520.68 | 255 | 247 | 64.5 |
| D | 2 | 234 | 5521 | 81.8 | 255 | 247 | 64.5 |
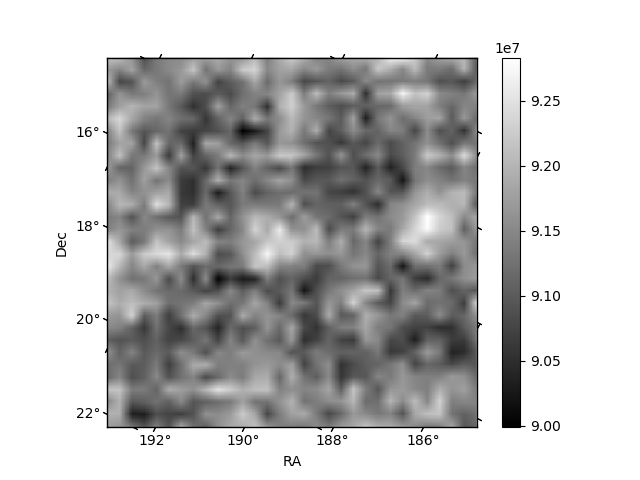
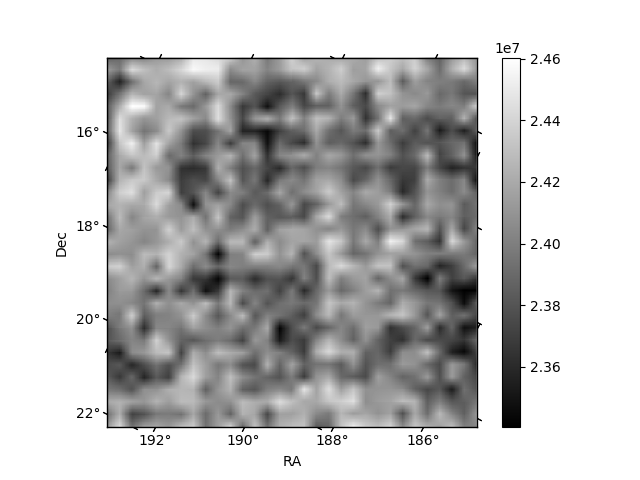
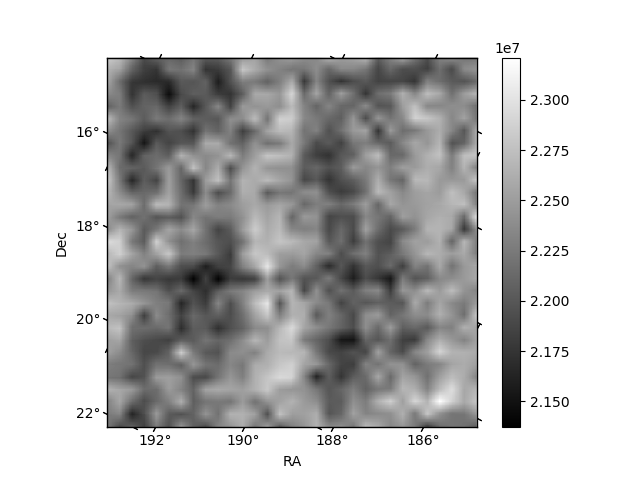
Histogram calculated using DETX and DETY for each event in the final _common_clean file
| Quadrant A | 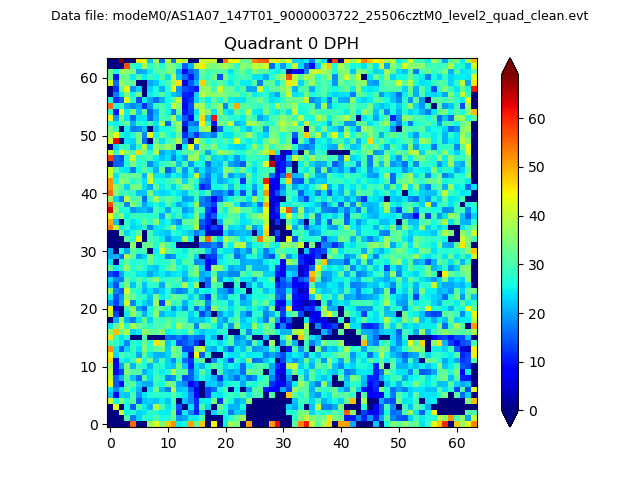 |
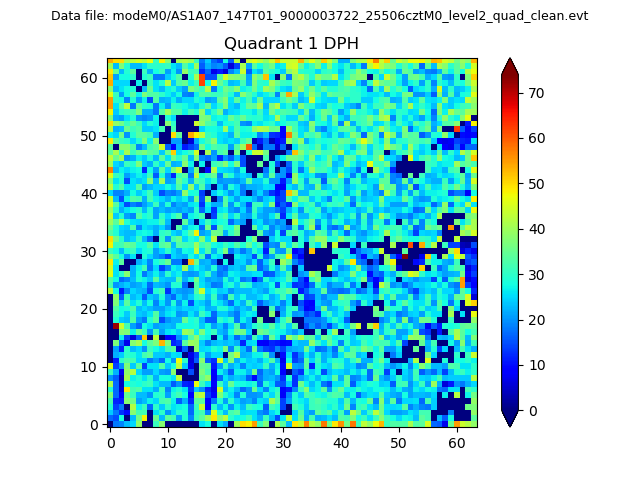 |
Quadrant B |
|---|---|---|---|
| Quadrant D | 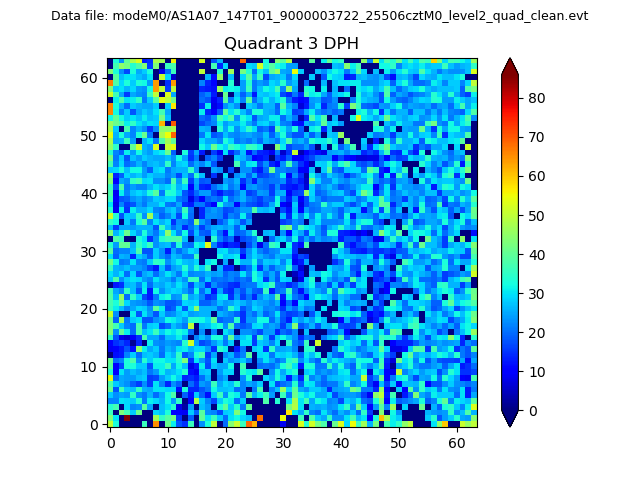 |
 |
Quadrant C |
| Plot type | Count rate plots | Images |
|---|---|---|
| Comparison with Poisson distribution Blue bars denote a histogram of data divided into 1 sec bins. Red curve is a Poisson curve with rate = median count rate of data. |
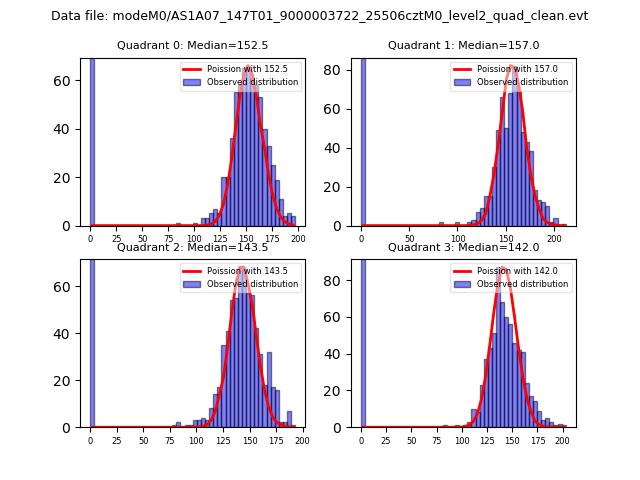 |
 |
| Quadrant-wise count rates Data is divided into 100 sec bins |
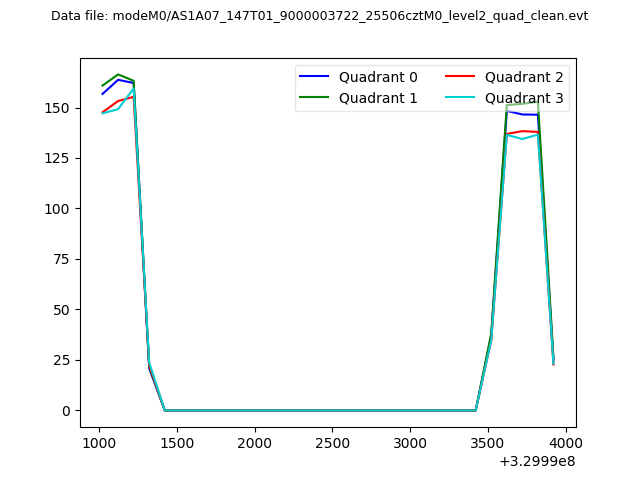 |
|
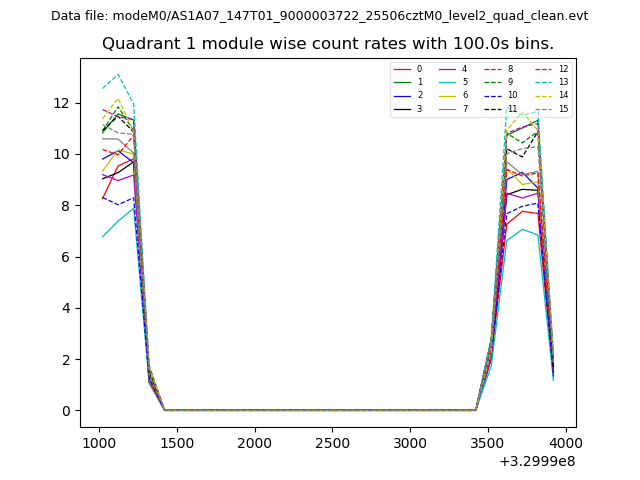
| Module-wise count rates for Quadrant A Data is divided into 100 sec bins |
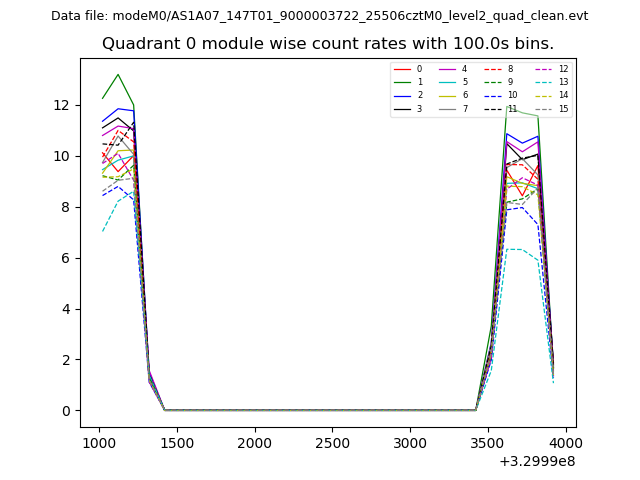 |
 |
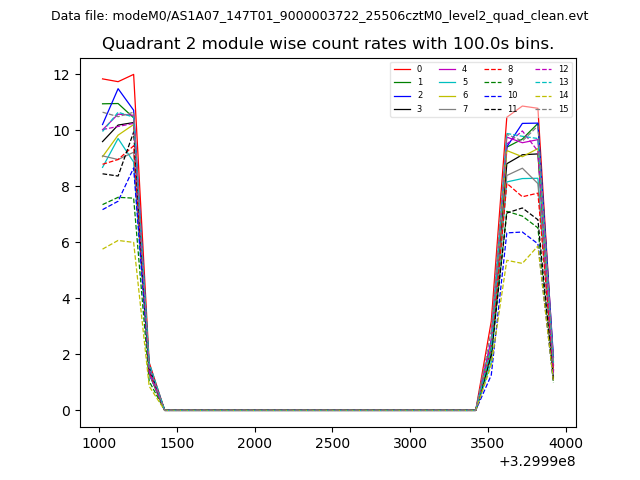
| Module-wise count rates for Quadrant B Data is divided into 100 sec bins |
 |
 |
| Module-wise count rates for Quadrant C Data is divided into 100 sec bins |
 |
 |
| Module-wise count rates for Quadrant D Data is divided into 100 sec bins |
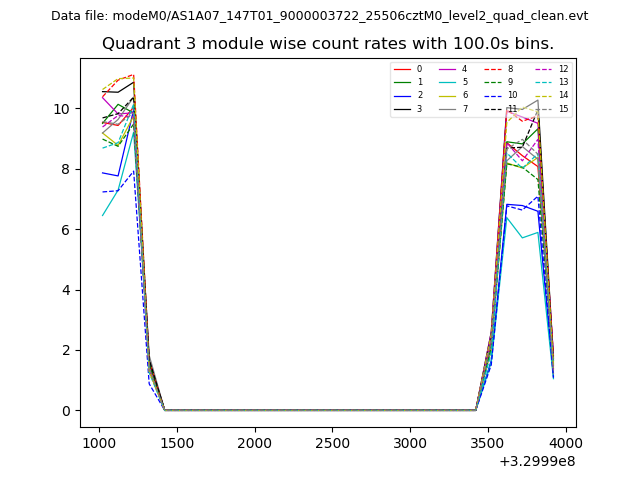 |
 |
| Parameter | Plot |
|---|---|
| CZT HV Monitor | 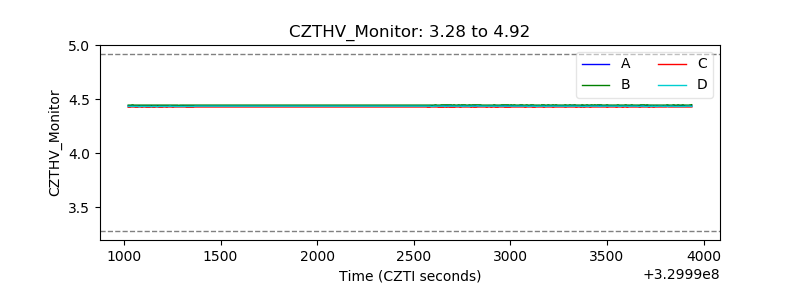 |
| D_VDD | 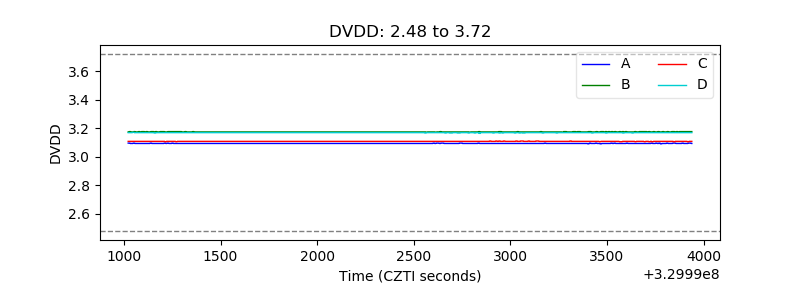 |
| Temperature 1 | 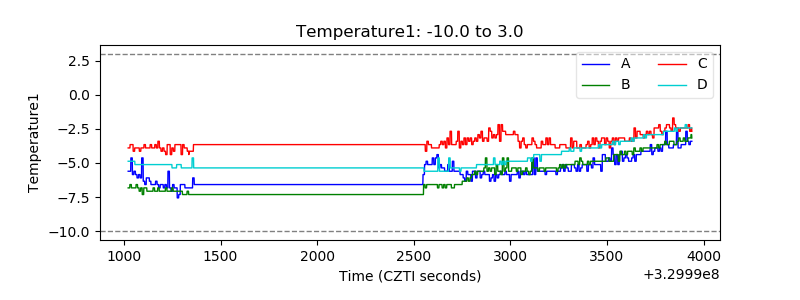 |
| Veto HV Monitor | 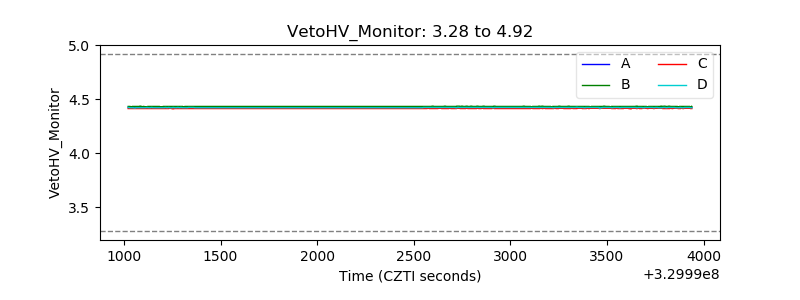 |
| Veto LLD | 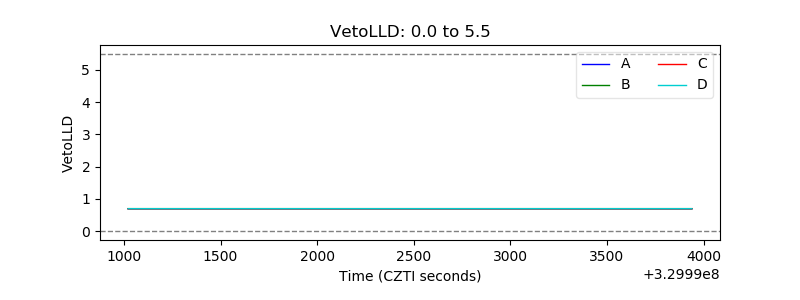 |
| Alpha Counter | 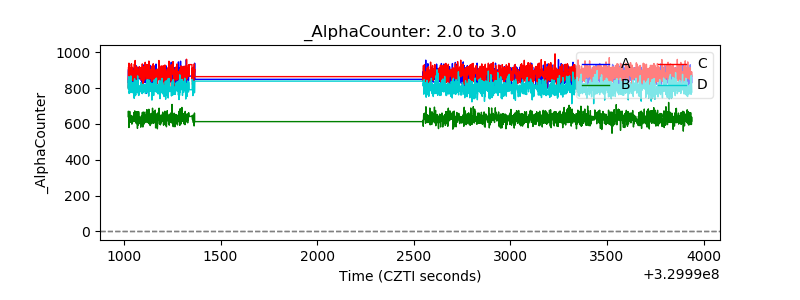 |
| _CPM_Rate | 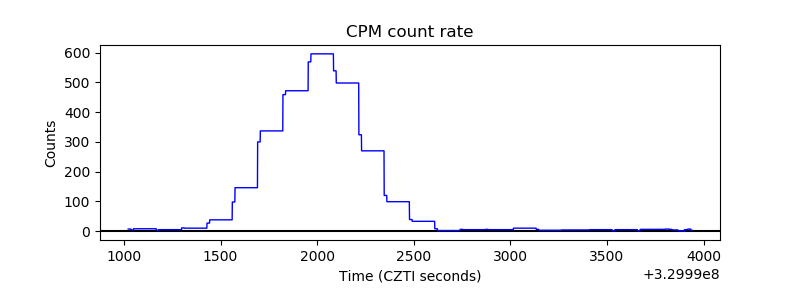 |
| CZT Counter | 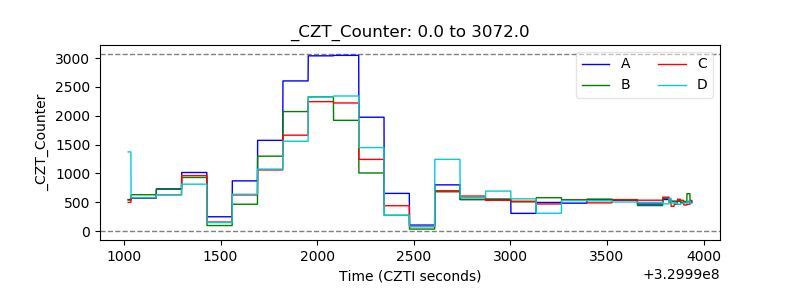 |
| +2.5 Volts monitor |  |
| +5 Volts monitor | 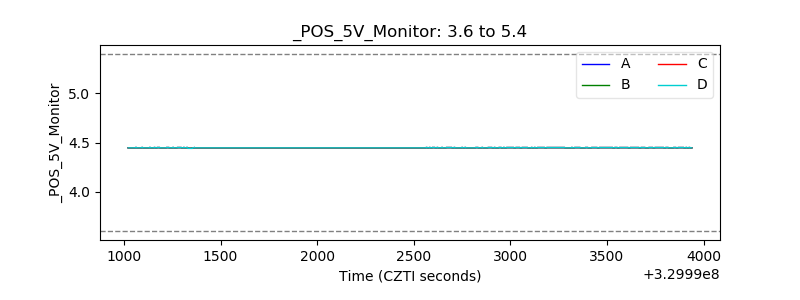 |
| _ROLL_ROT | 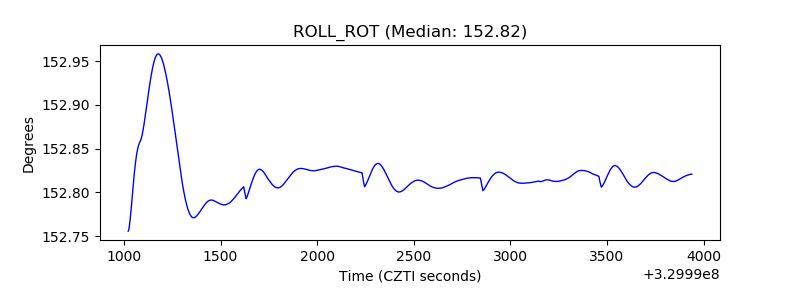 |
| _Roll_DEC |  |
| _Roll_RA | 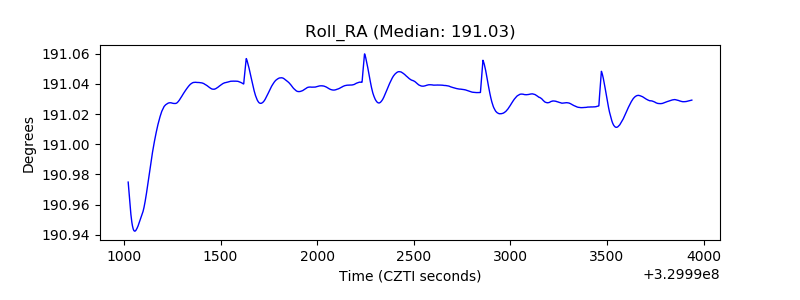 |
| Veto Counter | 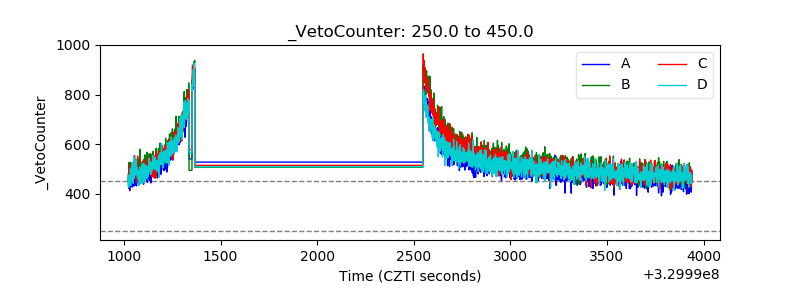 |