| Param | Original file | Final file |
|---|---|---|
| Filename | modeM0/AS1A07_147T01_9000003722_25507cztM0_level2.evt | modeM0/AS1A07_147T01_9000003722_25507cztM0_level2_quad_clean.evt |
| Size (bytes) | 497,033,280 | 93,781,440 |
| Size | 474.0 MB | 89.4 MB |
| Events in quadrant A | 3,463,767 | 613,172 |
| Events in quadrant B | 3,511,853 | 616,223 |
| Events in quadrant C | 3,427,071 | 575,193 |
| Events in quadrant D | 4,191,701 | 565,129 |
| Mode M0 | |||
|---|---|---|---|
| Quadrant | BADHDUFLAG | Total packets | Discarded packets |
| A | 0 | 14158 | 0 |
| B | 0 | 14369 | 0 |
| C | 0 | 14117 | 0 |
| D | 0 | 16475 | 0 |
| Mode M9 | |||
|---|---|---|---|
| Quadrant | BADHDUFLAG | Total packets | Discarded packets |
| A | 0 | 11 | 0 |
| B | 0 | 12 | 0 |
| C | 0 | 12 | 0 |
| D | 0 | 12 | 0 |
| Quadrant | Total seconds | Saturated seconds | Saturation percentage |
|---|---|---|---|
| A | 6746 | 143 | 2.119775% |
| B | 6746 | 165 | 2.445894% |
| C | 6746 | 185 | 2.742366% |
| D | 6746 | 161 | 2.386599% |
Noise dominated data is calculated using 1-second bins in cleaned event files. If a bin has >2000 counts, and if more than 50% of those come from <1% of pixels, then it is considered to be noise-dominated and hence unusable.
| Quadrant | # 1 sec bins | Bins with >0 counts | Bins with >2000 counts | High rate bins dominated by noise | Noise dominated (total time) | Noise dominated (detector-on time) | Marked lightcurve |
|---|---|---|---|---|---|---|---|
| A | 7641 | 6747 | 0 | 0 | 0.00% | 0.00% | 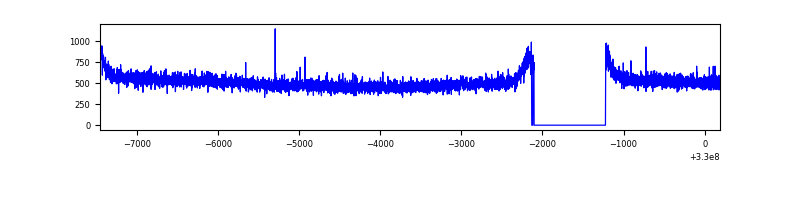 |
| B | 7641 | 6747 | 6 | 6 | 0.08% | 0.09% | 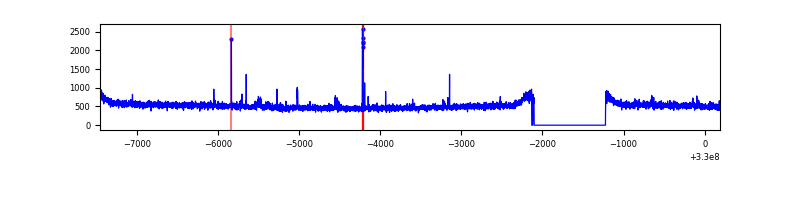 |
| C | 7641 | 6747 | 0 | 0 | 0.00% | 0.00% | 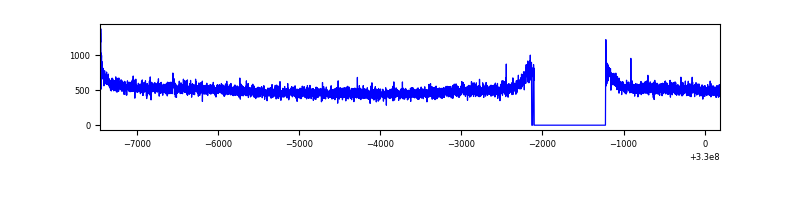 |
| D | 7641 | 6747 | 63 | 63 | 0.82% | 0.93% | 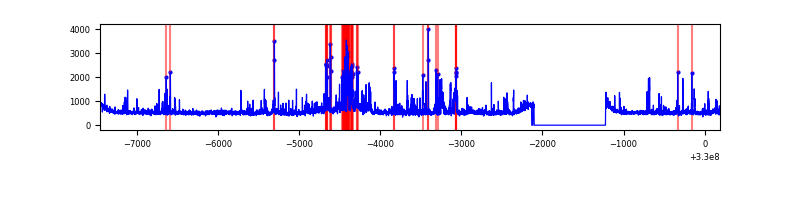 |
Top three noisy pixels from each quadrant. If the there are fewer than three noisy pixels in the level2.evt file, extra rows are filled as -1
| Pixel properties | Quadrant properties | ||||||
|---|---|---|---|---|---|---|---|
| Quadrant | DetID | PixID | Counts | Sigma | Mean | Median | Sigma |
| A | 13 | 254 | 10595 | 54.09 | 896 | 878 | 179.6 |
| A | 3 | 137 | 7945 | 39.34 | 896 | 878 | 179.6 |
| A | 0 | 226 | 7625 | 37.56 | 896 | 878 | 179.6 |
| B | 3 | 112 | 26804 | 155.27 | 881 | 860 | 167.1 |
| B | 12 | 111 | 20492 | 117.49 | 881 | 860 | 167.1 |
| B | 15 | 36 | 18724 | 106.91 | 881 | 860 | 167.1 |
| C | 14 | 238 | 136798 | 692.76 | 840 | 845 | 196.2 |
| C | 0 | 10 | 10223 | 47.79 | 840 | 845 | 196.2 |
| C | 3 | 233 | 6237 | 27.48 | 840 | 845 | 196.2 |
| D | 12 | 233 | 329470 | 1577.85 | 860 | 834 | 208.3 |
| D | 1 | 52 | 263354 | 1260.41 | 860 | 834 | 208.3 |
| D | 8 | 195 | 197224 | 942.91 | 860 | 834 | 208.3 |
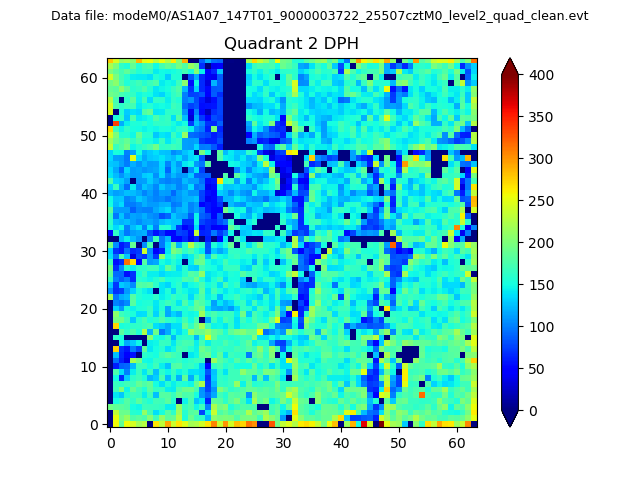
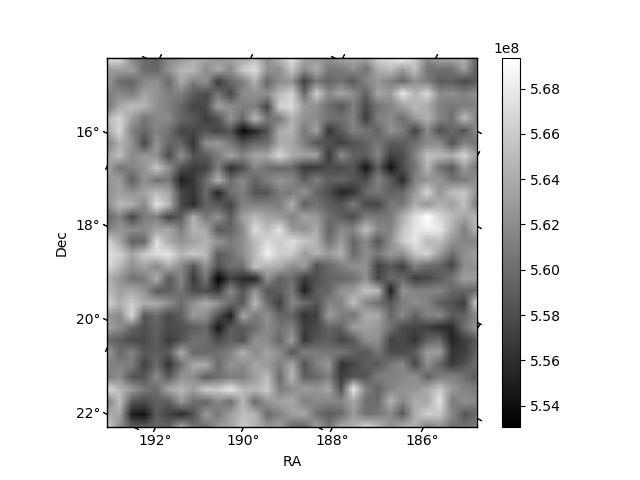
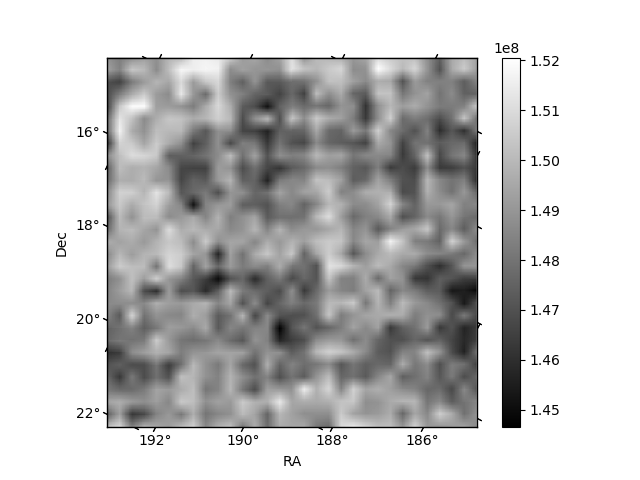
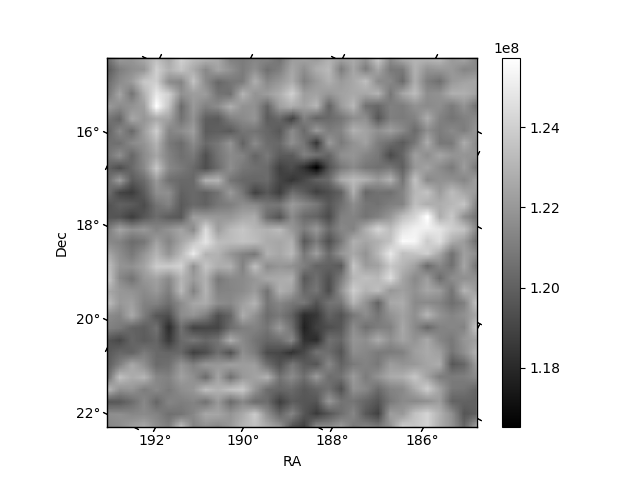
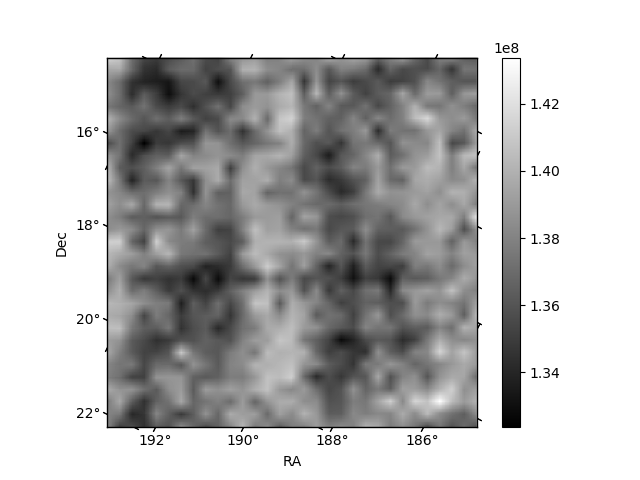
Histogram calculated using DETX and DETY for each event in the final _common_clean file
| Quadrant A | 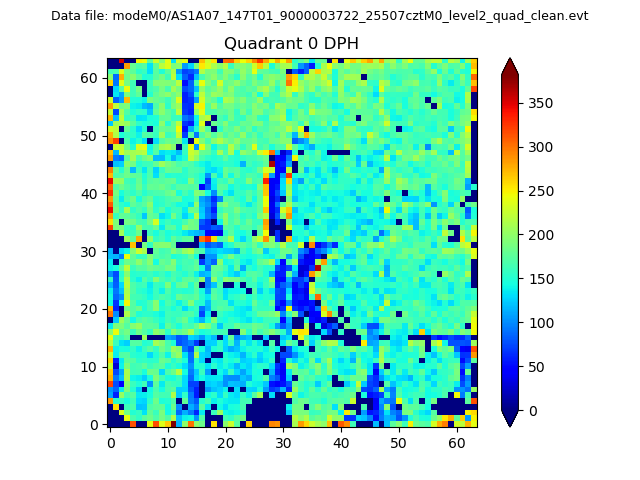 |
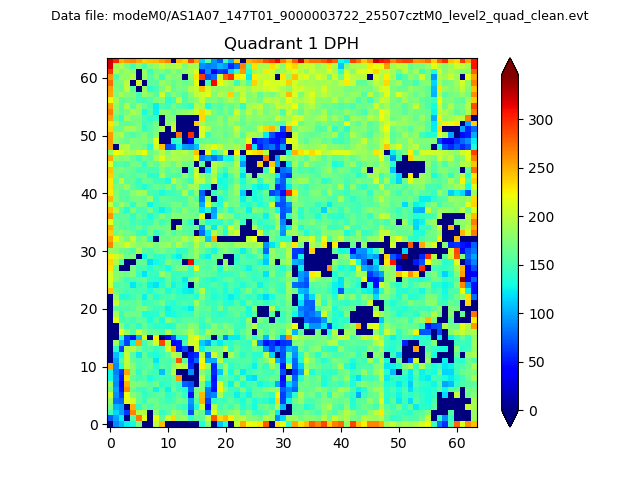 |
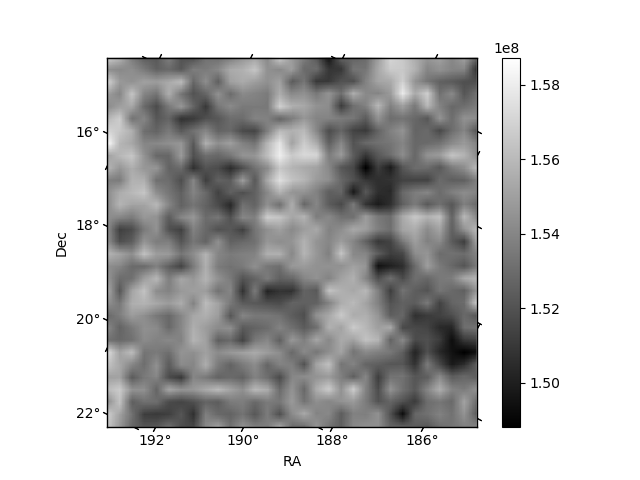
Quadrant B |
|---|---|---|---|
| Quadrant D | 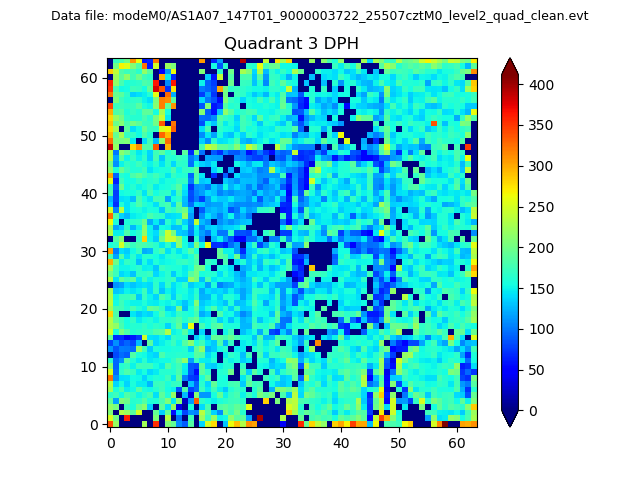 |
 |
Quadrant C |
| Plot type | Count rate plots | Images |
|---|---|---|
| Comparison with Poisson distribution Blue bars denote a histogram of data divided into 1 sec bins. Red curve is a Poisson curve with rate = median count rate of data. |
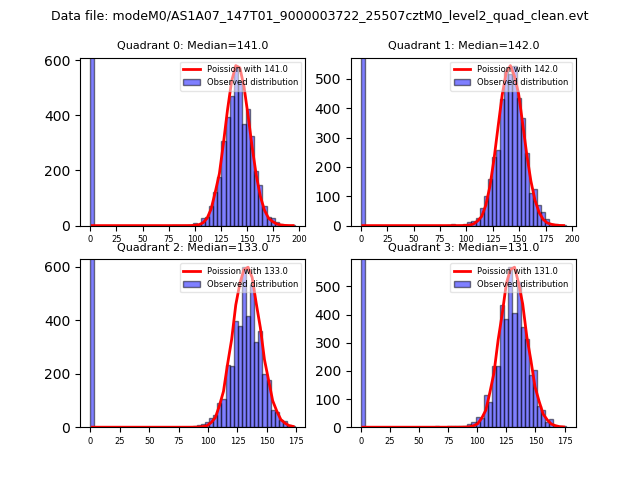 |
 |
| Quadrant-wise count rates Data is divided into 100 sec bins |
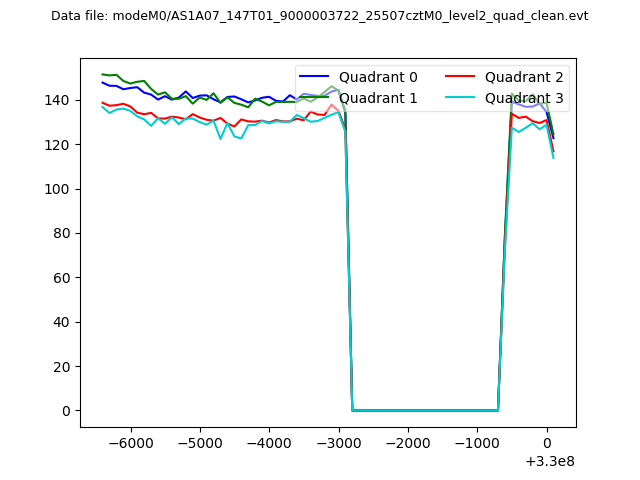 |
|
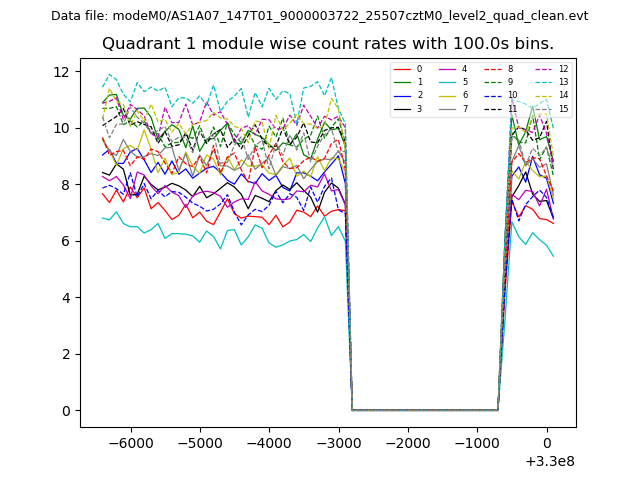
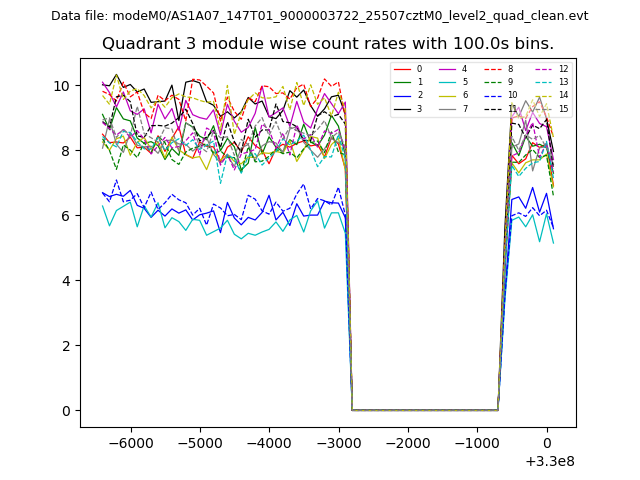
| Module-wise count rates for Quadrant A Data is divided into 100 sec bins |
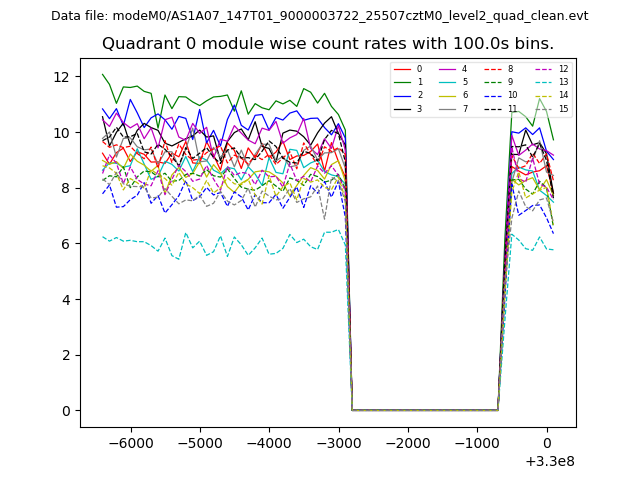 |
 |
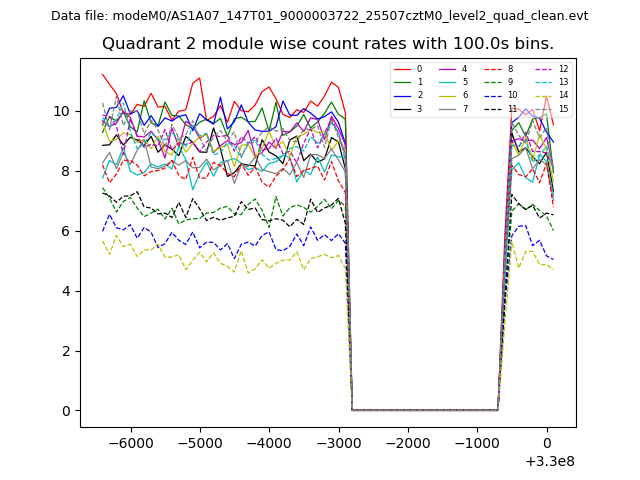
| Module-wise count rates for Quadrant B Data is divided into 100 sec bins |
 |
 |
| Module-wise count rates for Quadrant C Data is divided into 100 sec bins |
 |
 |
| Module-wise count rates for Quadrant D Data is divided into 100 sec bins |
 |
 |
| Parameter | Plot |
|---|---|
| CZT HV Monitor | 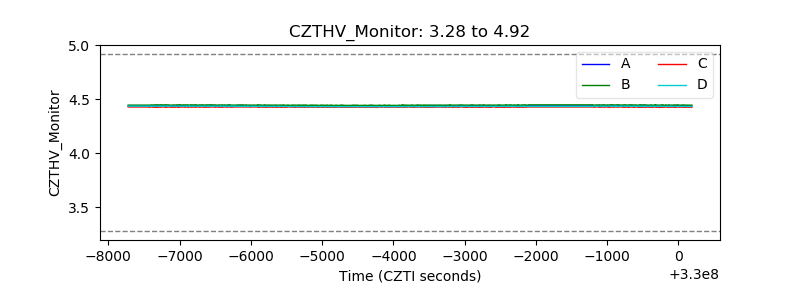 |
| D_VDD |  |
| Temperature 1 | 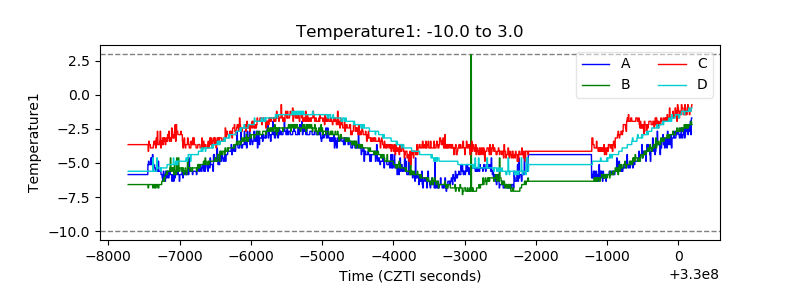 |
| Veto HV Monitor | 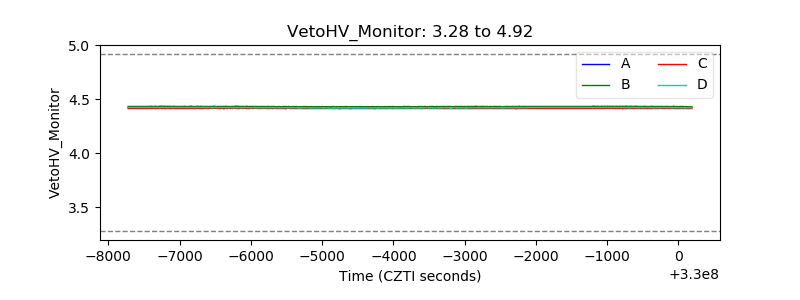 |
| Veto LLD | 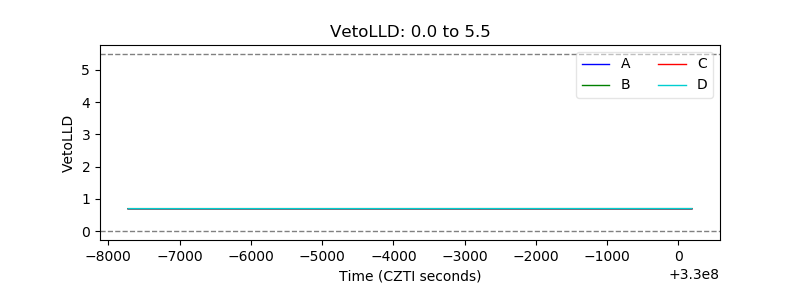 |
| Alpha Counter | 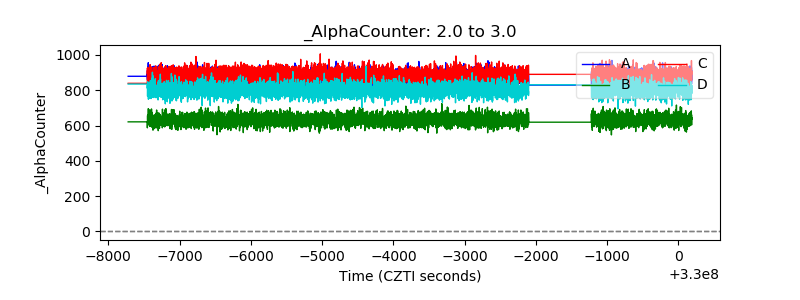 |
| _CPM_Rate | 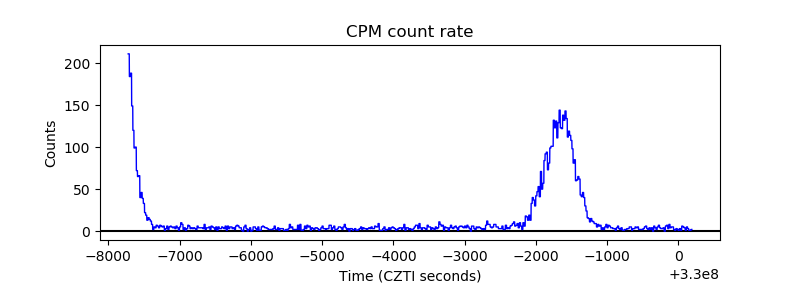 |
| CZT Counter | 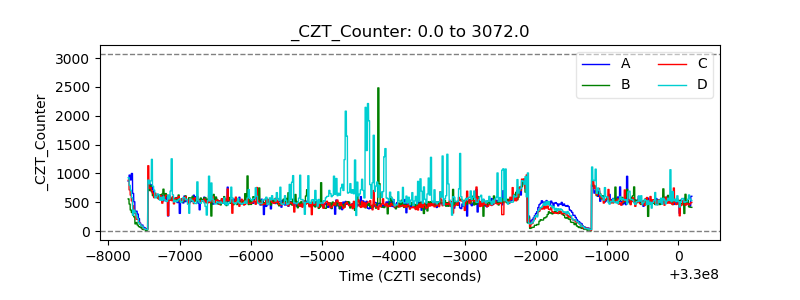 |
| +2.5 Volts monitor | 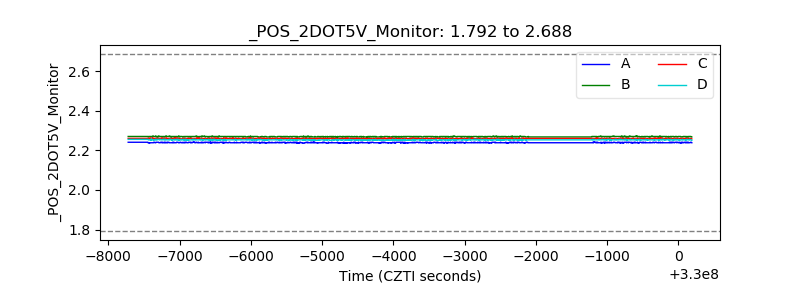 |
| +5 Volts monitor |  |
| _ROLL_ROT | 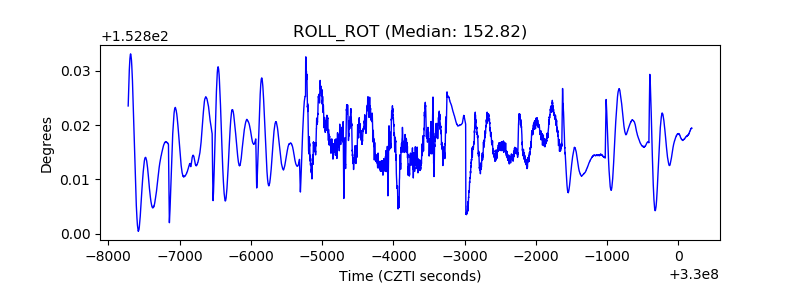 |
| _Roll_DEC | 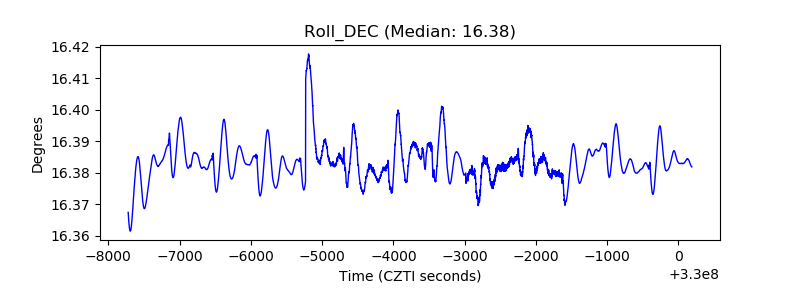 |
| _Roll_RA | 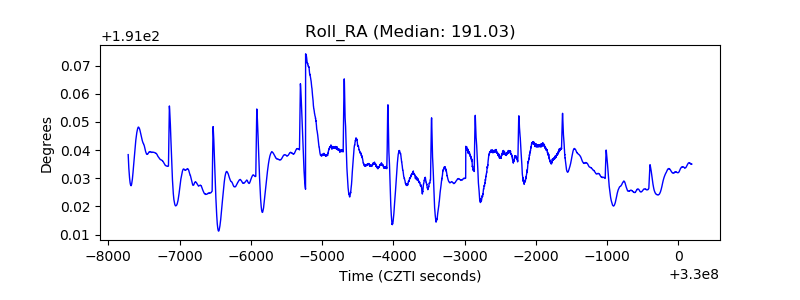 |
| Veto Counter | 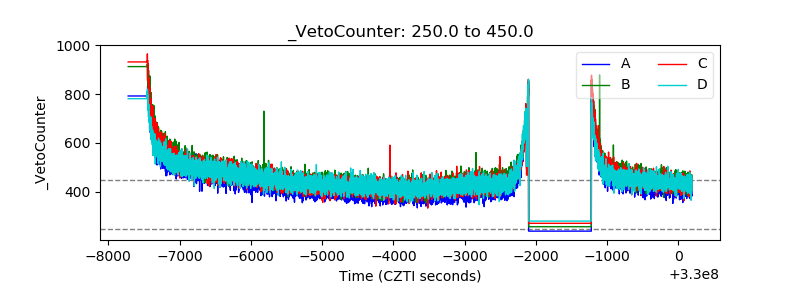 |