| Param | Original file | Final file |
|---|---|---|
| Filename | modeM0/AS1A07_147T01_9000003722_25508cztM0_level2.evt | modeM0/AS1A07_147T01_9000003722_25508cztM0_level2_quad_clean.evt |
| Size (bytes) | 551,839,680 | 103,095,360 |
| Size | 526.3 MB | 98.3 MB |
| Events in quadrant A | 3,669,294 | 671,083 |
| Events in quadrant B | 3,720,483 | 676,829 |
| Events in quadrant C | 3,664,346 | 637,661 |
| Events in quadrant D | 5,155,013 | 620,291 |
| Mode M0 | |||
|---|---|---|---|
| Quadrant | BADHDUFLAG | Total packets | Discarded packets |
| A | 0 | 15404 | 0 |
| B | 0 | 15514 | 0 |
| C | 0 | 15410 | 0 |
| D | 0 | 20095 | 0 |
| Mode M9 | |||
|---|---|---|---|
| Quadrant | BADHDUFLAG | Total packets | Discarded packets |
| A | 0 | 8 | 0 |
| B | 0 | 9 | 0 |
| C | 0 | 9 | 0 |
| D | 0 | 9 | 0 |
| Quadrant | Total seconds | Saturated seconds | Saturation percentage |
|---|---|---|---|
| A | 7415 | 123 | 1.658800% |
| B | 7415 | 150 | 2.022927% |
| C | 7415 | 155 | 2.090357% |
| D | 7414 | 198 | 2.670623% |
Noise dominated data is calculated using 1-second bins in cleaned event files. If a bin has >2000 counts, and if more than 50% of those come from <1% of pixels, then it is considered to be noise-dominated and hence unusable.
| Quadrant | # 1 sec bins | Bins with >0 counts | Bins with >2000 counts | High rate bins dominated by noise | Noise dominated (total time) | Noise dominated (detector-on time) | Marked lightcurve |
|---|---|---|---|---|---|---|---|
| A | 7939 | 7416 | 0 | 0 | 0.00% | 0.00% | 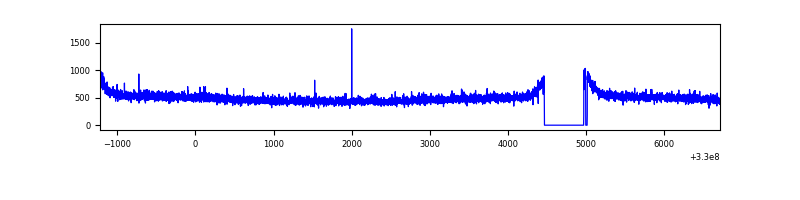 |
| B | 7939 | 7416 | 0 | 0 | 0.00% | 0.00% | 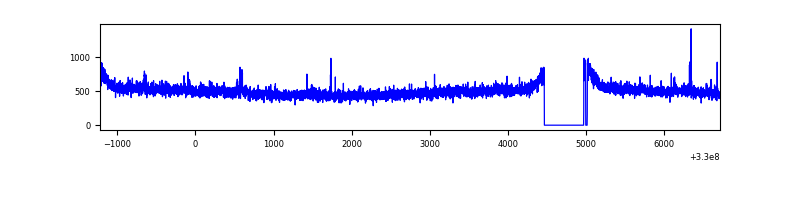 |
| C | 7939 | 7416 | 0 | 0 | 0.00% | 0.00% | 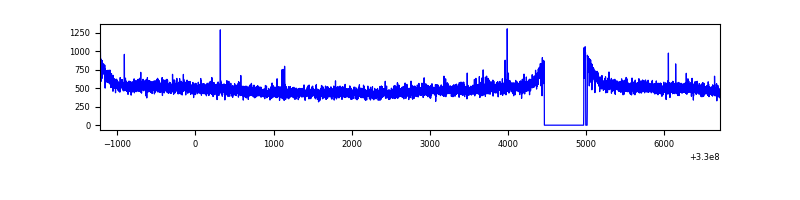 |
| D | 7938 | 7415 | 71 | 71 | 0.89% | 0.96% | 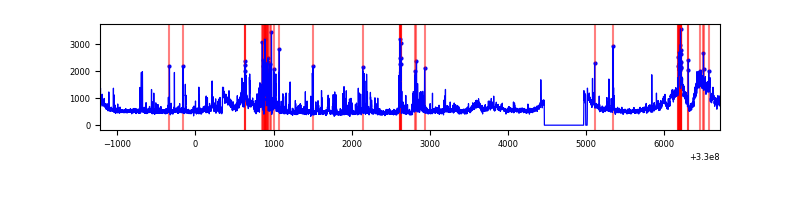 |
Top three noisy pixels from each quadrant. If the there are fewer than three noisy pixels in the level2.evt file, extra rows are filled as -1
| Pixel properties | Quadrant properties | ||||||
|---|---|---|---|---|---|---|---|
| Quadrant | DetID | PixID | Counts | Sigma | Mean | Median | Sigma |
| A | 13 | 254 | 11893 | 56.92 | 949 | 928 | 192.6 |
| A | 3 | 137 | 8765 | 40.69 | 949 | 928 | 192.6 |
| A | 0 | 226 | 8189 | 37.7 | 949 | 928 | 192.6 |
| B | 3 | 112 | 25504 | 135.41 | 937 | 915 | 181.6 |
| B | 12 | 111 | 22305 | 117.79 | 937 | 915 | 181.6 |
| B | 0 | 190 | 21778 | 114.89 | 937 | 915 | 181.6 |
| C | 14 | 238 | 144202 | 681.3 | 898 | 903 | 210.3 |
| C | 2 | 16 | 7478 | 31.26 | 898 | 903 | 210.3 |
| C | 13 | 61 | 6127 | 24.84 | 898 | 903 | 210.3 |
| D | 7 | 238 | 860474 | 3790.58 | 917 | 889 | 226.8 |
| D | 12 | 233 | 349467 | 1537.15 | 917 | 889 | 226.8 |
| D | 1 | 52 | 316240 | 1390.63 | 917 | 889 | 226.8 |
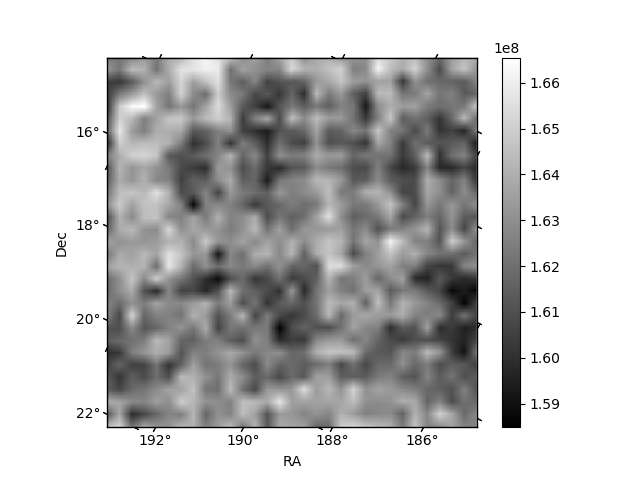
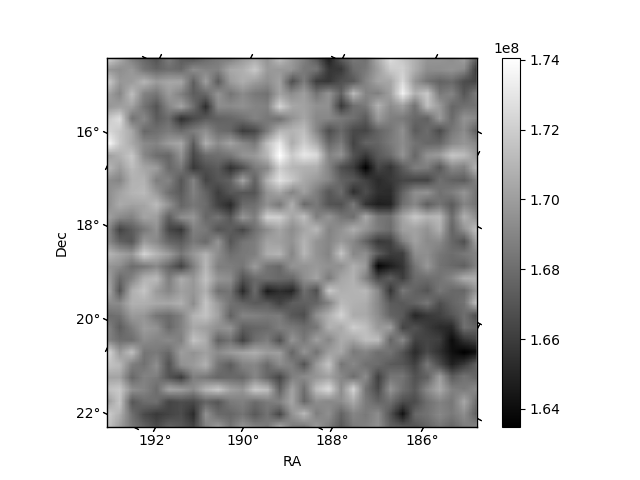
Histogram calculated using DETX and DETY for each event in the final _common_clean file
| Quadrant A |  |
 |
Quadrant B |
|---|---|---|---|
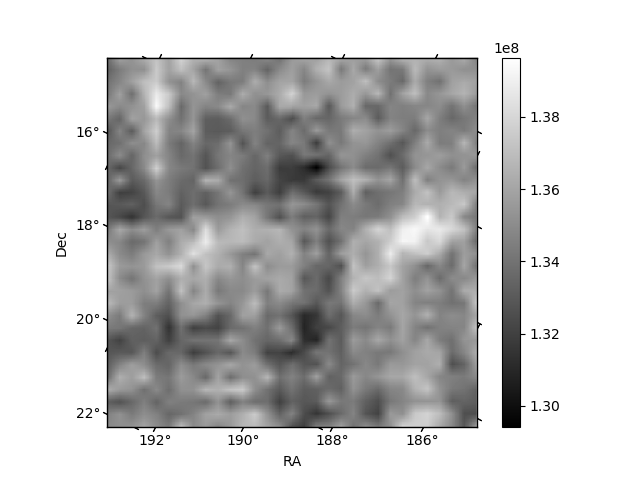
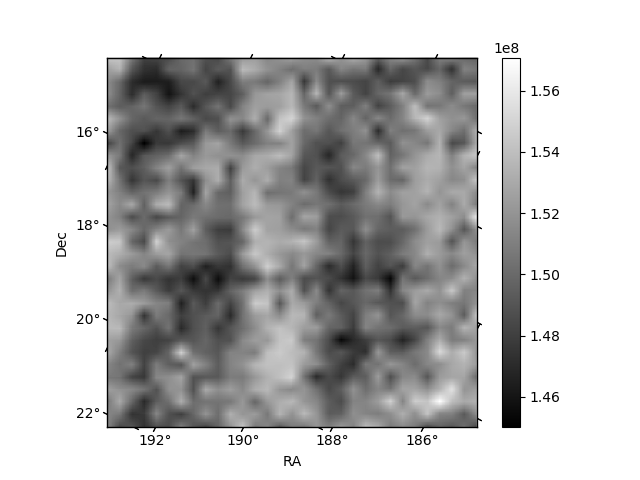
| Quadrant D |  |
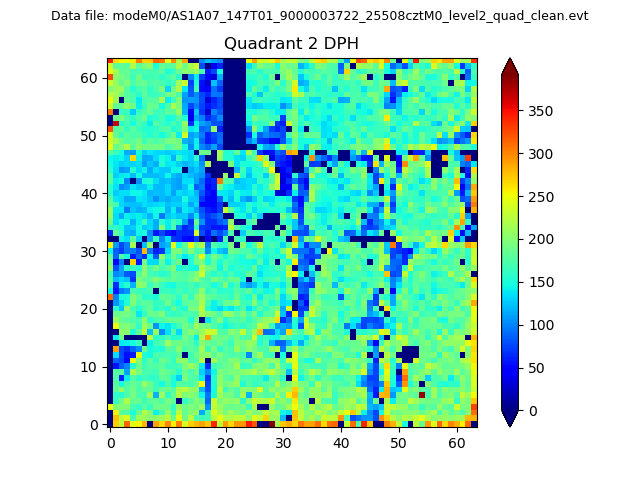 |
Quadrant C |
| Plot type | Count rate plots | Images |
|---|---|---|
| Comparison with Poisson distribution Blue bars denote a histogram of data divided into 1 sec bins. Red curve is a Poisson curve with rate = median count rate of data. |
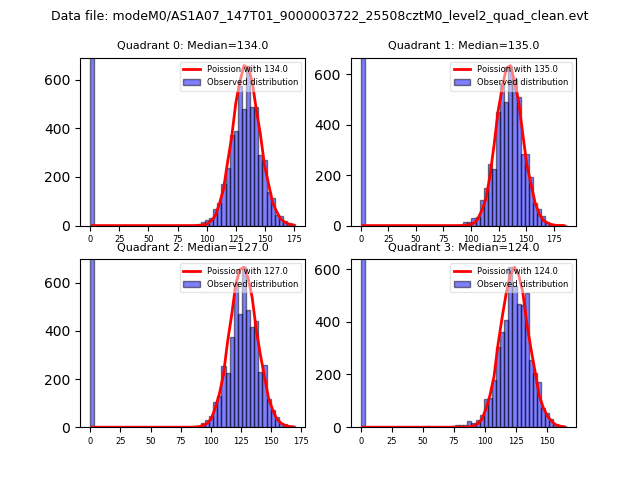 |
 |
| Quadrant-wise count rates Data is divided into 100 sec bins |
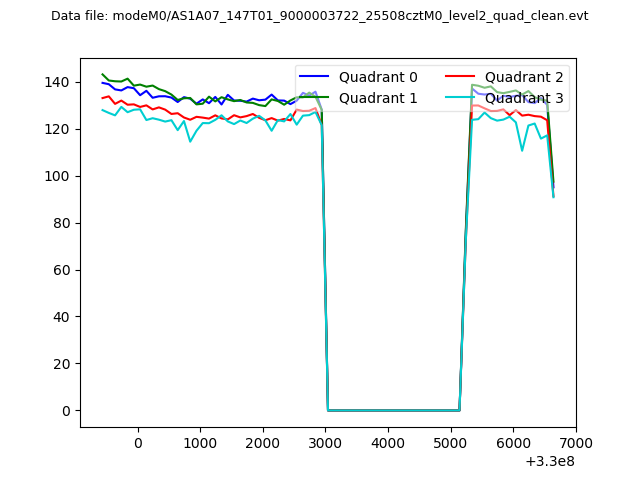 |
|
| Module-wise count rates for Quadrant A Data is divided into 100 sec bins |
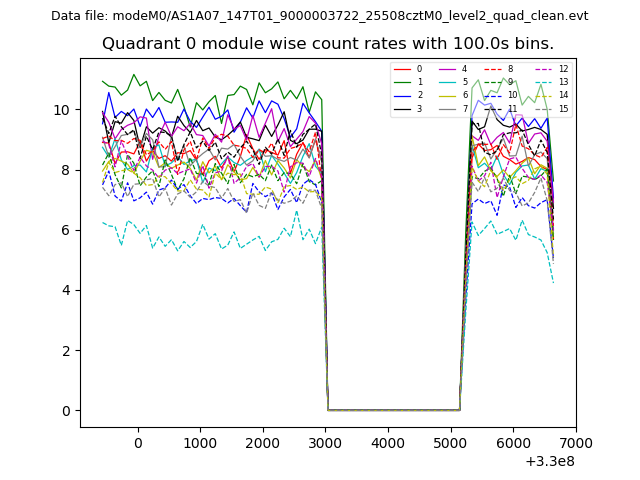 |
 |
| Module-wise count rates for Quadrant B Data is divided into 100 sec bins |
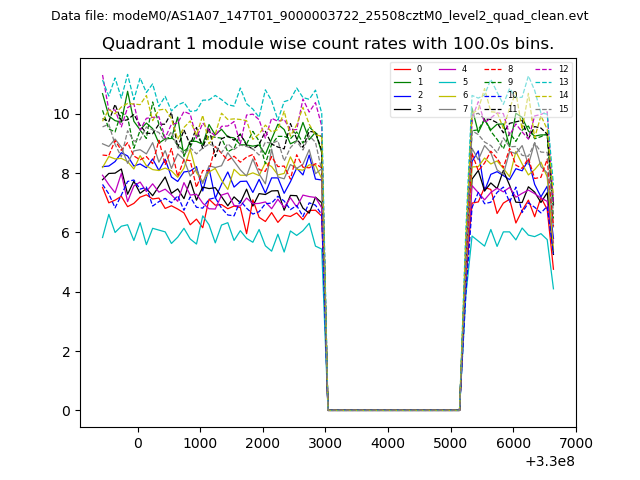 |
 |
| Module-wise count rates for Quadrant C Data is divided into 100 sec bins |
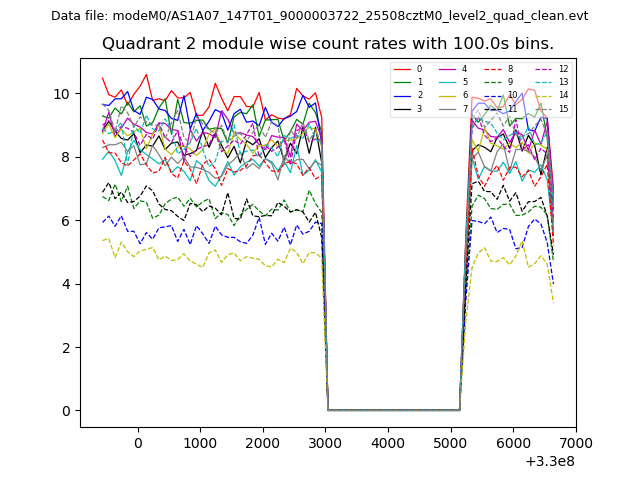 |
 |
| Module-wise count rates for Quadrant D Data is divided into 100 sec bins |
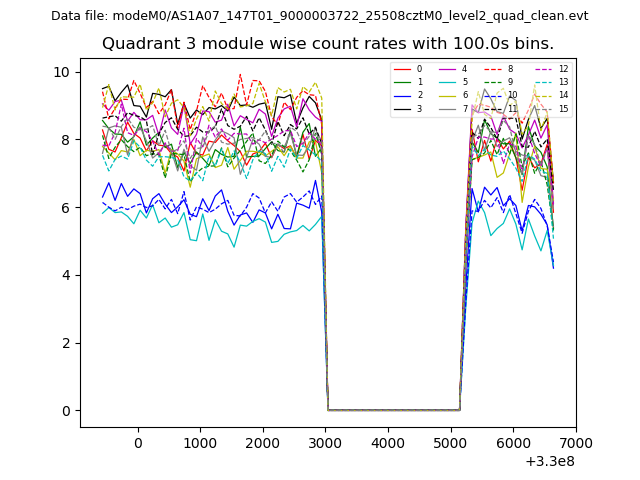 |
 |
| Parameter | Plot |
|---|---|
| CZT HV Monitor | 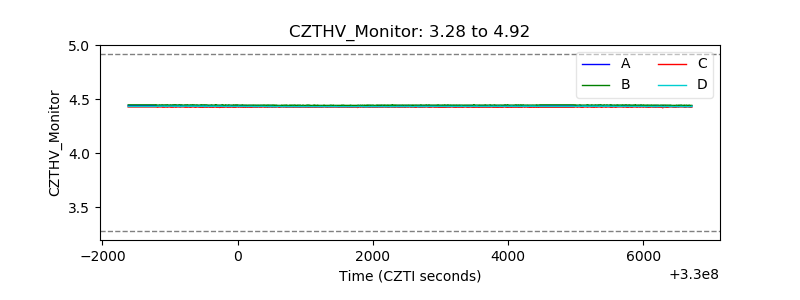 |
| D_VDD | 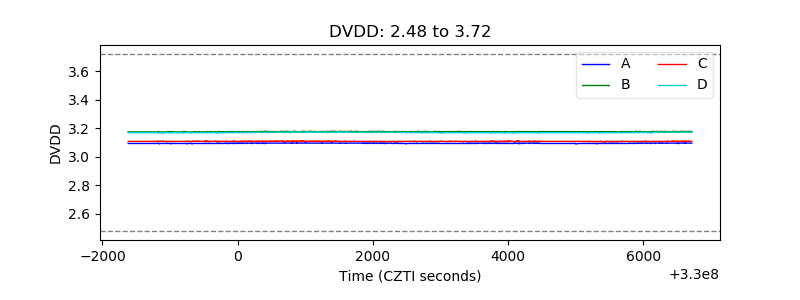 |
| Temperature 1 | 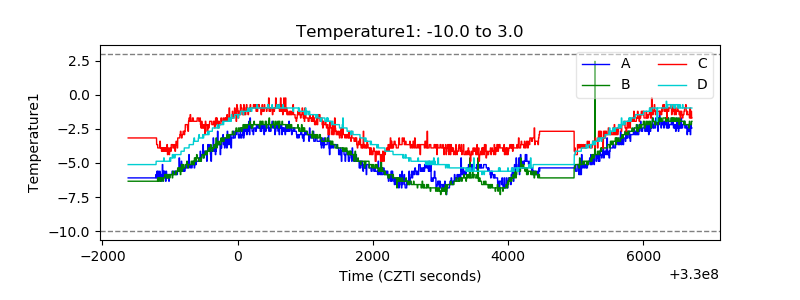 |
| Veto HV Monitor | 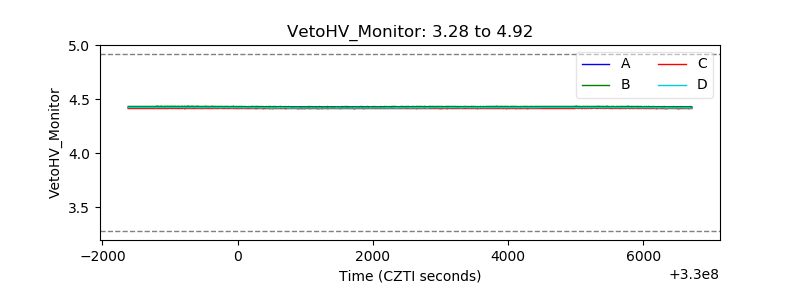 |
| Veto LLD | 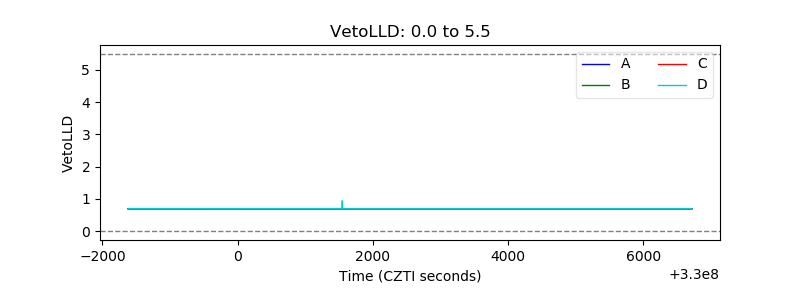 |
| Alpha Counter | 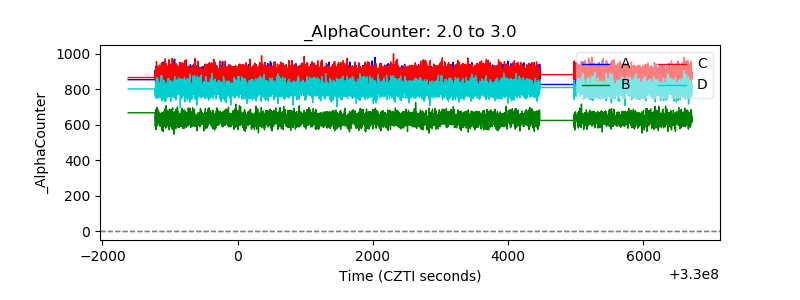 |
| _CPM_Rate |  |
| CZT Counter | 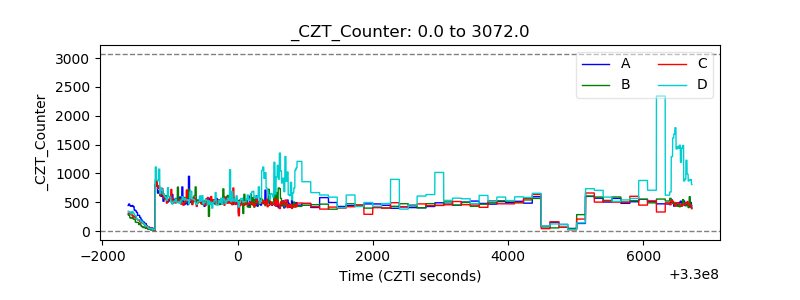 |
| +2.5 Volts monitor | 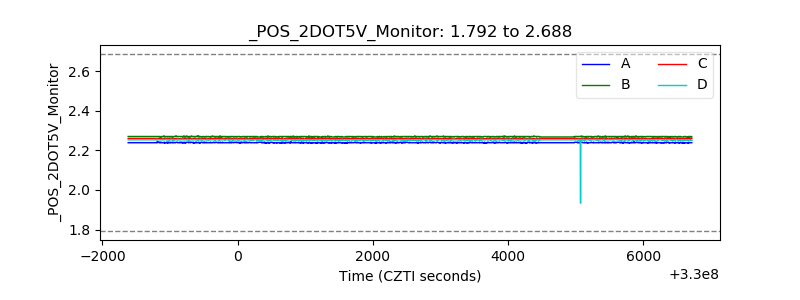 |
| +5 Volts monitor |  |
| _ROLL_ROT | 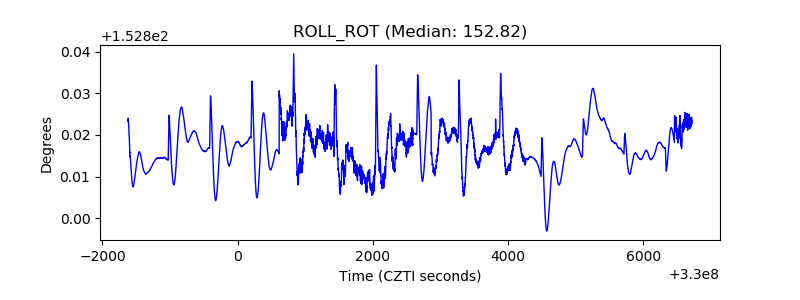 |
| _Roll_DEC | 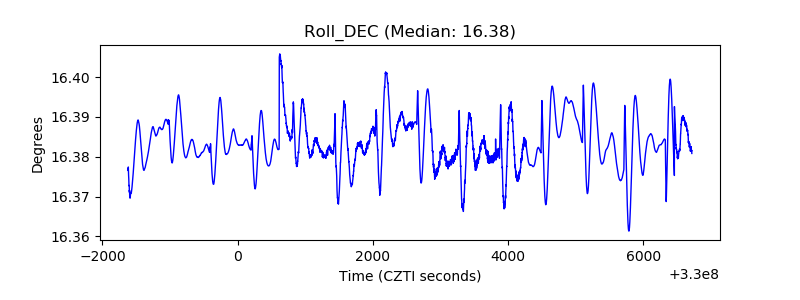 |
| _Roll_RA | 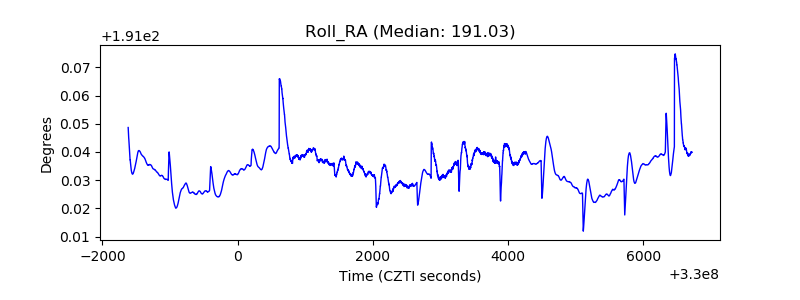 |
| Veto Counter | 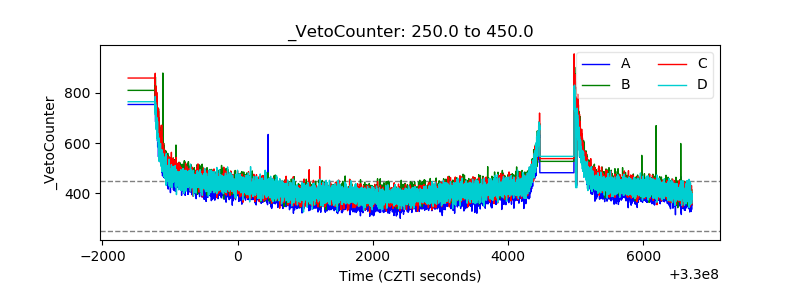 |