| Param | Original file | Final file |
|---|---|---|
| Filename | modeM0/AS1A07_147T01_9000003722_25510cztM0_level2.evt | modeM0/AS1A07_147T01_9000003722_25510cztM0_level2_quad_clean.evt |
| Size (bytes) | 481,003,200 | 98,395,200 |
| Size | 458.7 MB | 93.8 MB |
| Events in quadrant A | 3,424,269 | 636,201 |
| Events in quadrant B | 3,547,618 | 639,173 |
| Events in quadrant C | 3,435,836 | 605,969 |
| Events in quadrant D | 3,674,180 | 600,969 |
| Mode M0 | |||
|---|---|---|---|
| Quadrant | BADHDUFLAG | Total packets | Discarded packets |
| A | 0 | 14748 | 0 |
| B | 0 | 15021 | 0 |
| C | 0 | 14757 | 0 |
| D | 0 | 15428 | 0 |
| Mode M9 | |||
|---|---|---|---|
| Quadrant | BADHDUFLAG | Total packets | Discarded packets |
| A | 0 | 4 | 0 |
| B | 0 | 4 | 0 |
| C | 0 | 4 | 0 |
| D | 0 | 4 | 0 |
| Quadrant | Total seconds | Saturated seconds | Saturation percentage |
|---|---|---|---|
| A | 7148 | 84 | 1.175154% |
| B | 7149 | 102 | 1.426773% |
| C | 7149 | 100 | 1.398797% |
| D | 7149 | 99 | 1.384809% |
Noise dominated data is calculated using 1-second bins in cleaned event files. If a bin has >2000 counts, and if more than 50% of those come from <1% of pixels, then it is considered to be noise-dominated and hence unusable.
| Quadrant | # 1 sec bins | Bins with >0 counts | Bins with >2000 counts | High rate bins dominated by noise | Noise dominated (total time) | Noise dominated (detector-on time) | Marked lightcurve |
|---|---|---|---|---|---|---|---|
| A | 7508 | 7150 | 1 | 1 | 0.01% | 0.01% | 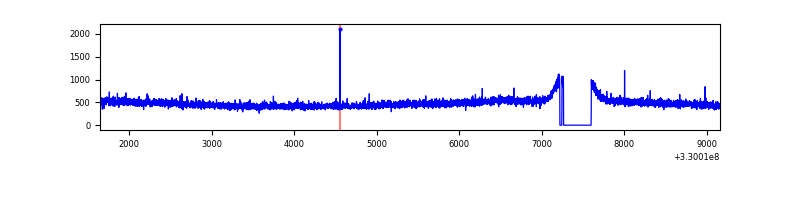 |
| B | 7509 | 7151 | 1 | 1 | 0.01% | 0.01% | 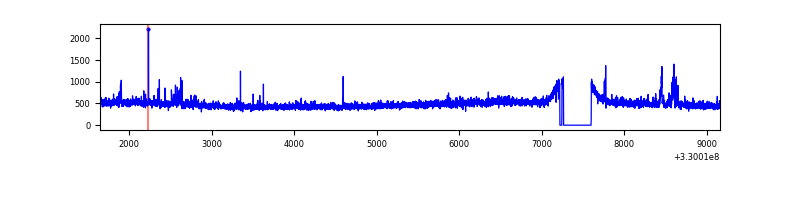 |
| C | 7509 | 7151 | 0 | 0 | 0.00% | 0.00% | 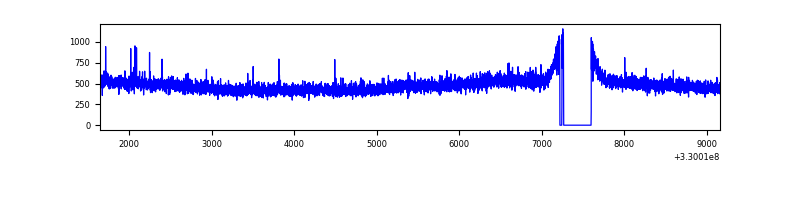 |
| D | 7509 | 7151 | 45 | 45 | 0.60% | 0.63% | 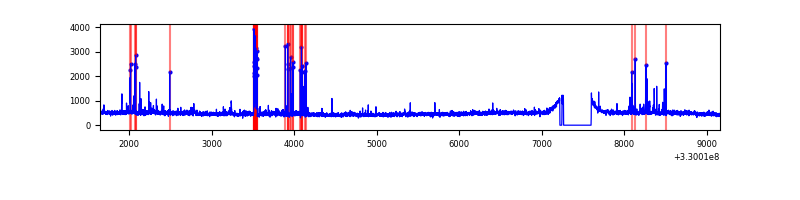 |
Top three noisy pixels from each quadrant. If the there are fewer than three noisy pixels in the level2.evt file, extra rows are filled as -1
| Pixel properties | Quadrant properties | ||||||
|---|---|---|---|---|---|---|---|
| Quadrant | DetID | PixID | Counts | Sigma | Mean | Median | Sigma |
| A | 13 | 254 | 11780 | 60.82 | 886 | 865 | 179.5 |
| A | 3 | 137 | 8448 | 42.26 | 886 | 865 | 179.5 |
| A | 0 | 226 | 7384 | 36.33 | 886 | 865 | 179.5 |
| B | 0 | 190 | 83359 | 486.44 | 875 | 850 | 169.6 |
| B | 12 | 111 | 20809 | 117.67 | 875 | 850 | 169.6 |
| B | 11 | 111 | 18742 | 105.48 | 875 | 850 | 169.6 |
| C | 14 | 238 | 131731 | 655.88 | 843 | 848 | 199.6 |
| C | 10 | 23 | 7145 | 31.56 | 843 | 848 | 199.6 |
| C | 5 | 112 | 6197 | 26.8 | 843 | 848 | 199.6 |
| D | 12 | 233 | 154853 | 739.81 | 860 | 837 | 208.2 |
| D | 1 | 52 | 154021 | 735.81 | 860 | 837 | 208.2 |
| D | 8 | 195 | 83511 | 397.12 | 860 | 837 | 208.2 |
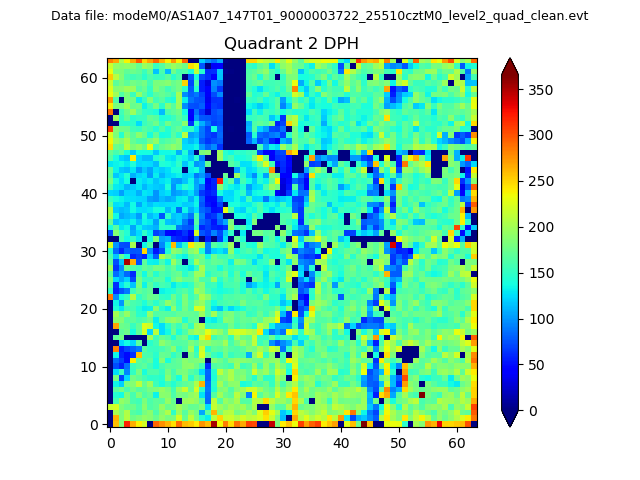
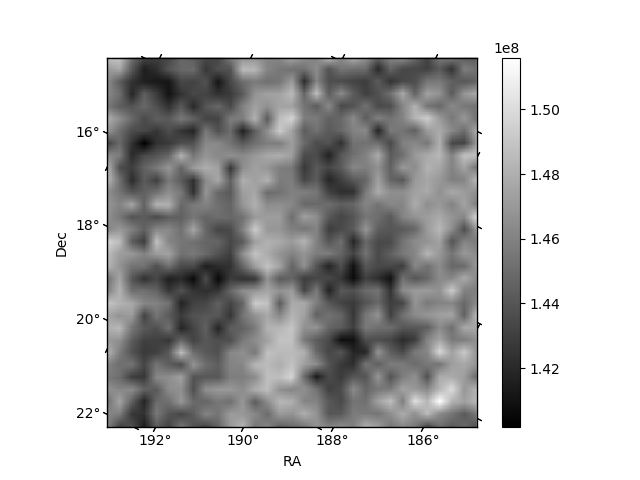
Histogram calculated using DETX and DETY for each event in the final _common_clean file
| Quadrant A |  |
 |
Quadrant B |
|---|---|---|---|
| Quadrant D | 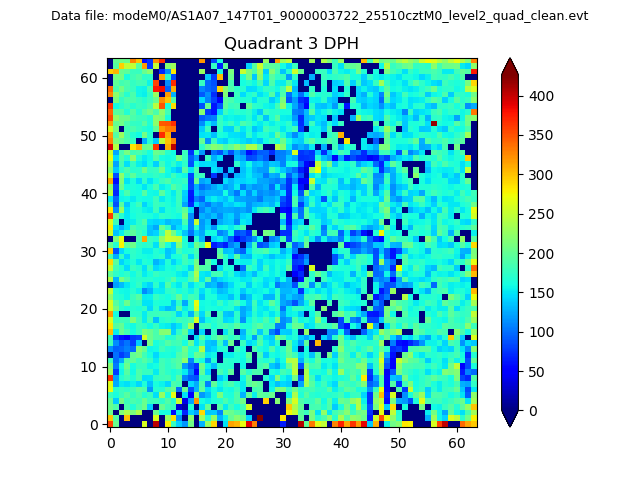 |
 |
Quadrant C |
| Plot type | Count rate plots | Images |
|---|---|---|
| Comparison with Poisson distribution Blue bars denote a histogram of data divided into 1 sec bins. Red curve is a Poisson curve with rate = median count rate of data. |
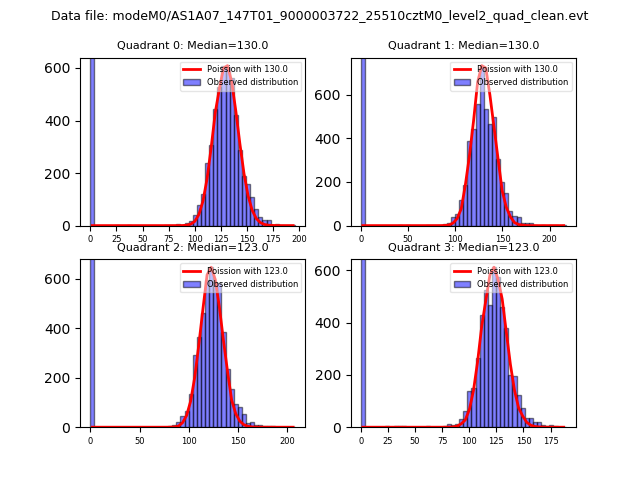 |
 |
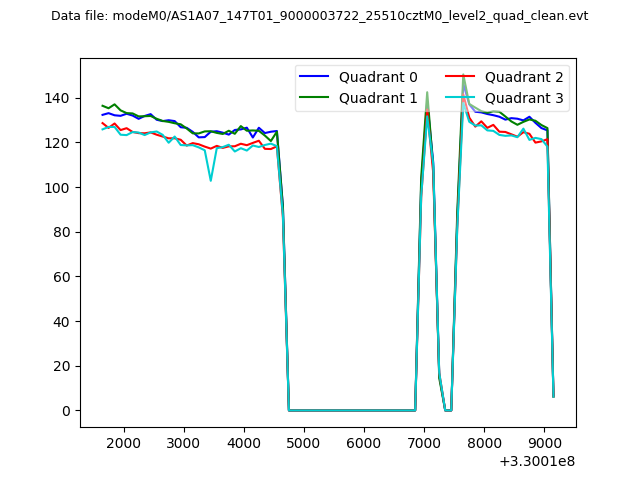
| Quadrant-wise count rates Data is divided into 100 sec bins |
 |
|
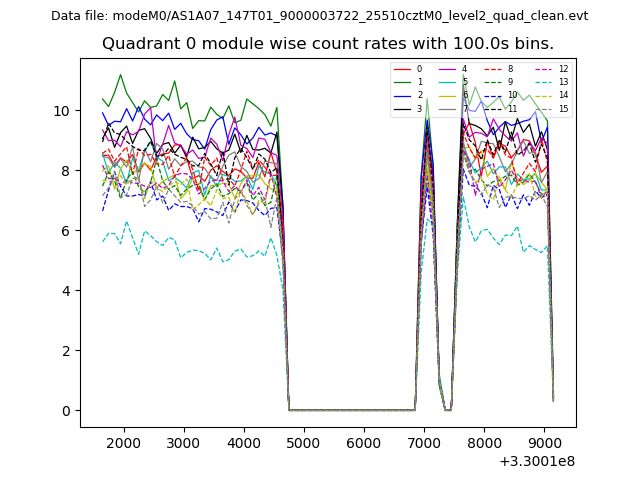
| Module-wise count rates for Quadrant A Data is divided into 100 sec bins |
 |
 |
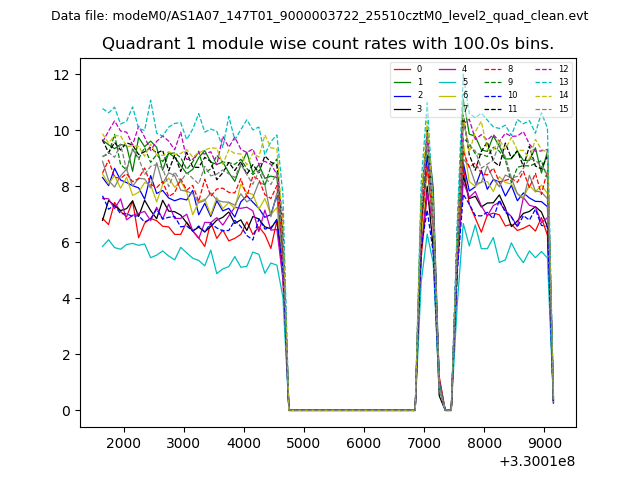
| Module-wise count rates for Quadrant B Data is divided into 100 sec bins |
 |
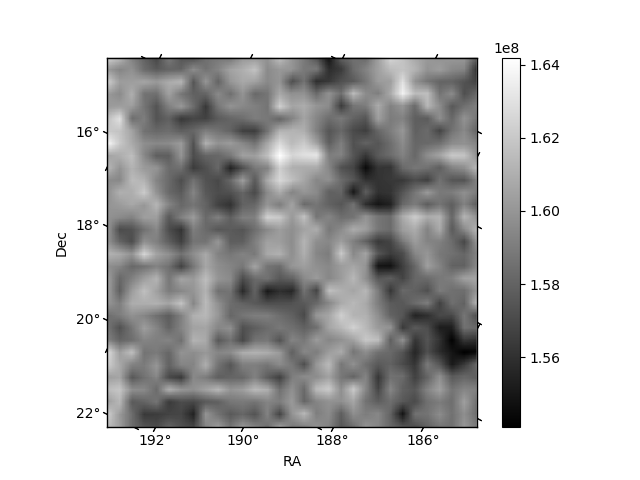 |
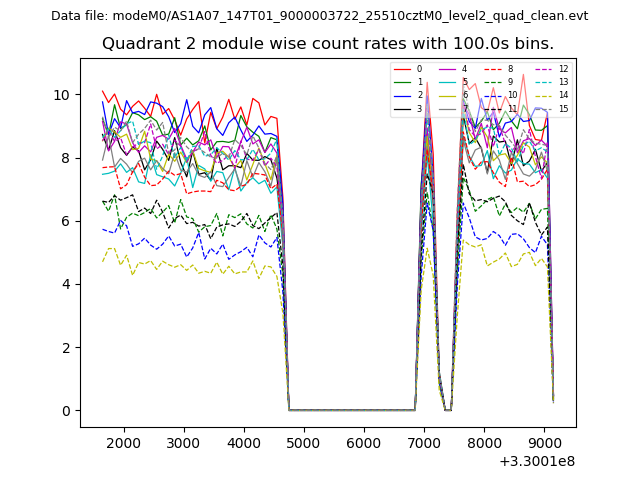
| Module-wise count rates for Quadrant C Data is divided into 100 sec bins |
 |
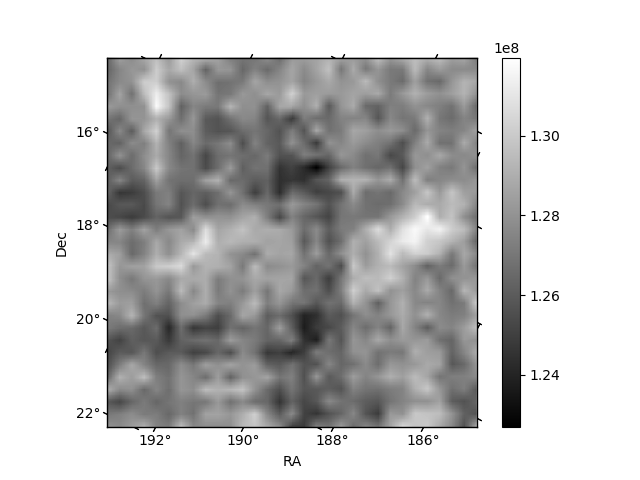 |
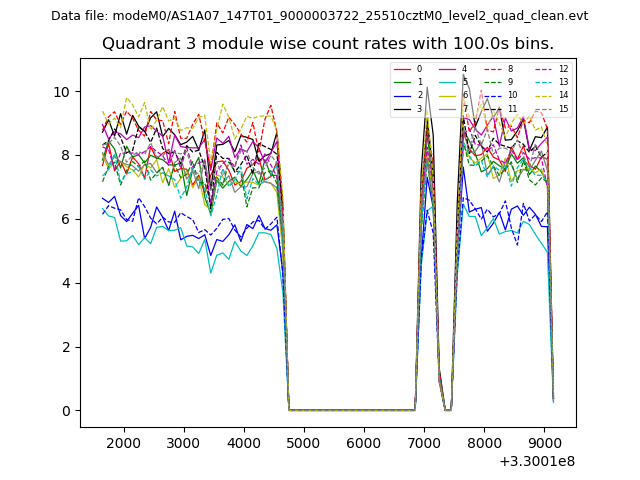
| Module-wise count rates for Quadrant D Data is divided into 100 sec bins |
 |
 |
| Parameter | Plot |
|---|---|
| CZT HV Monitor | 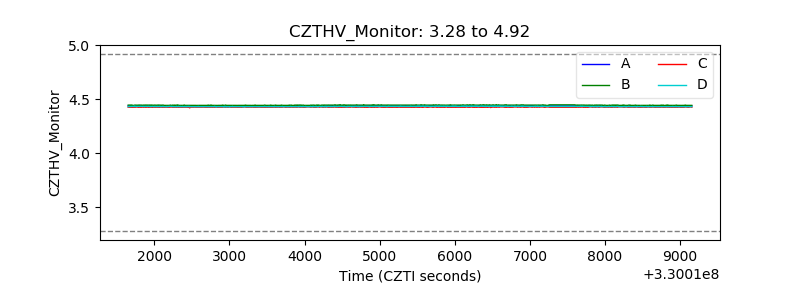 |
| D_VDD | 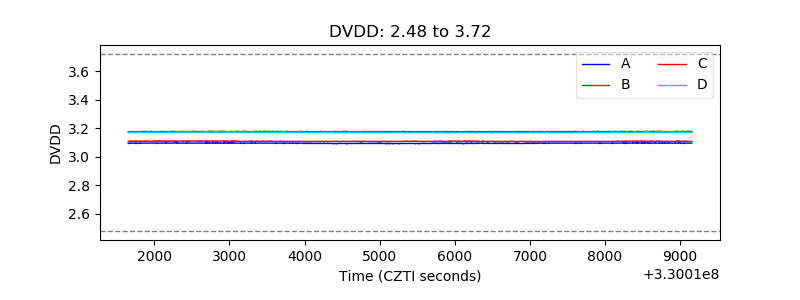 |
| Temperature 1 | 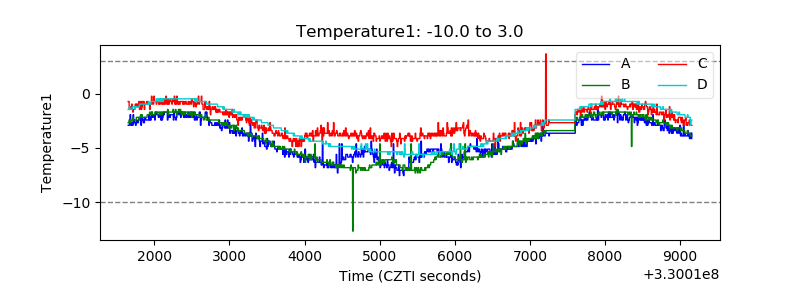 |
| Veto HV Monitor | 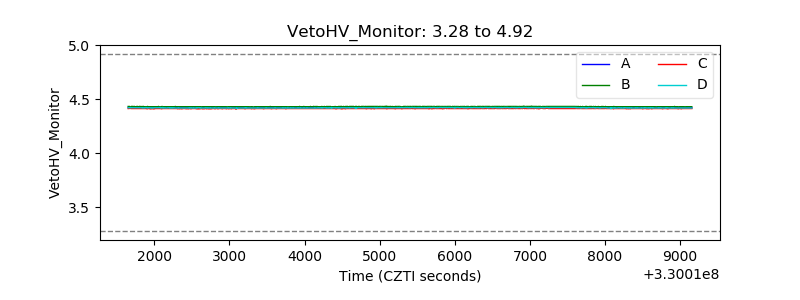 |
| Veto LLD | 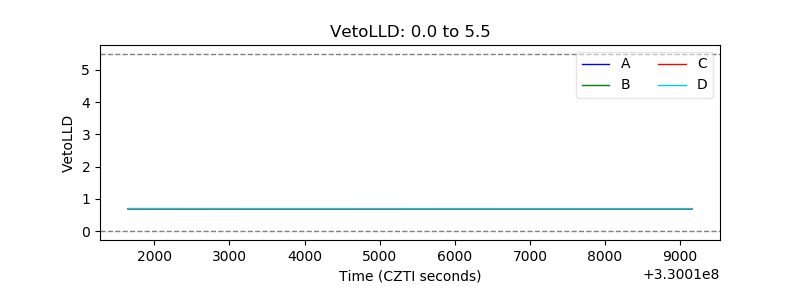 |
| Alpha Counter | 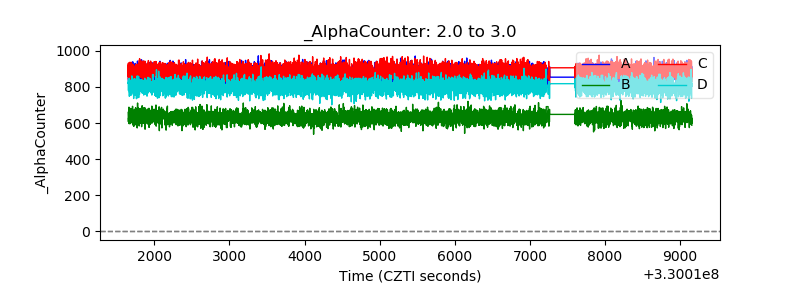 |
| _CPM_Rate | 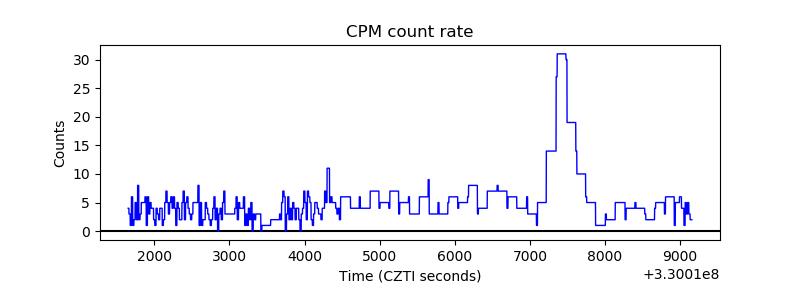 |
| CZT Counter | 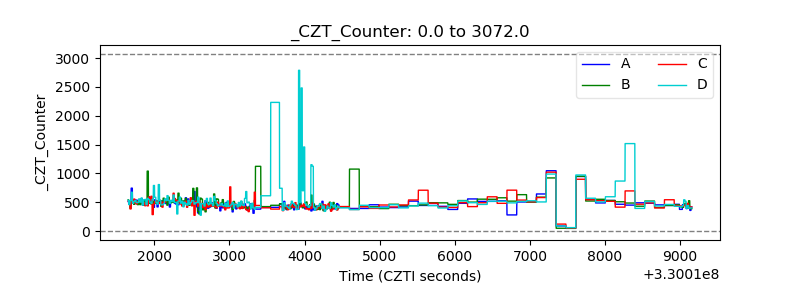 |
| +2.5 Volts monitor |  |
| +5 Volts monitor | 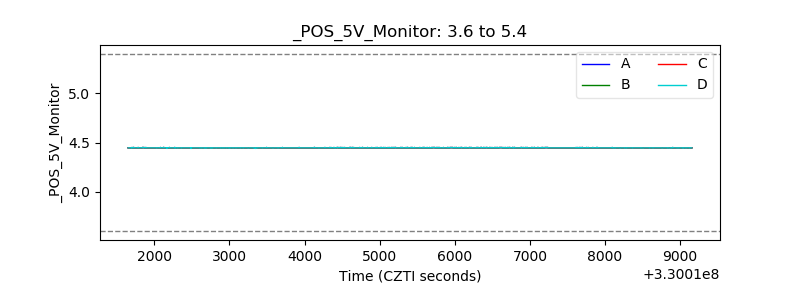 |
| _ROLL_ROT | 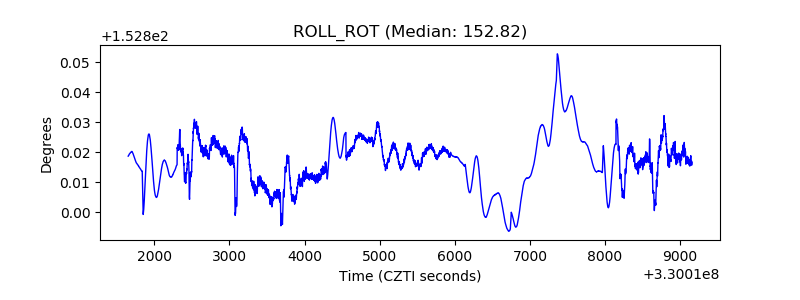 |
| _Roll_DEC | 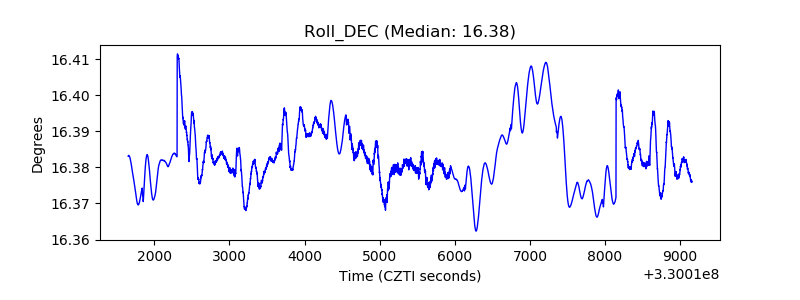 |
| _Roll_RA | 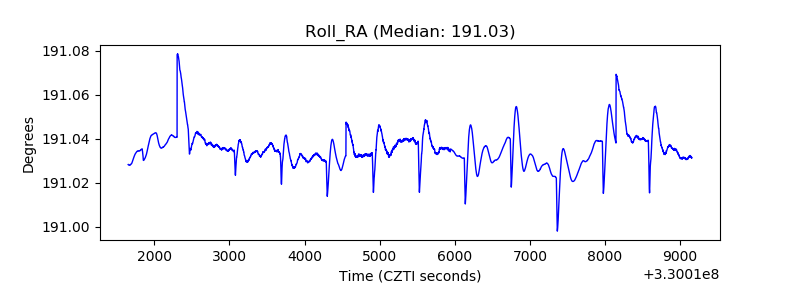 |
| Veto Counter | 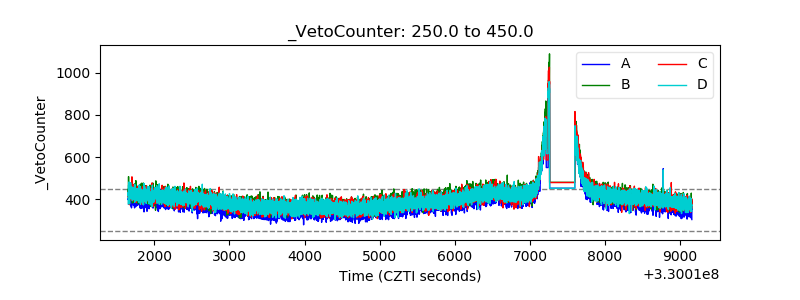 |