| Param | Original file | Final file |
|---|---|---|
| Filename | modeM0/AS1A07_147T01_9000003722_25513cztM0_level2.evt | modeM0/AS1A07_147T01_9000003722_25513cztM0_level2_quad_clean.evt |
| Size (bytes) | 1,223,775,360 | 237,006,720 |
| Size | 1.1 GB | 226.0 MB |
| Events in quadrant A | 8,610,711 | 1,517,779 |
| Events in quadrant B | 8,825,558 | 1,529,048 |
| Events in quadrant C | 8,681,708 | 1,453,717 |
| Events in quadrant D | 9,701,952 | 1,412,287 |
| Mode M0 | |||
|---|---|---|---|
| Quadrant | BADHDUFLAG | Total packets | Discarded packets |
| A | 0 | 37707 | 0 |
| B | 0 | 38021 | 0 |
| C | 0 | 37731 | 0 |
| D | 0 | 41264 | 0 |
| Mode M9 | |||
|---|---|---|---|
| Quadrant | BADHDUFLAG | Total packets | Discarded packets |
| A | 0 | 21 | 0 |
| B | 0 | 21 | 0 |
| C | 0 | 21 | 0 |
| D | 0 | 21 | 0 |
| Quadrant | Total seconds | Saturated seconds | Saturation percentage |
|---|---|---|---|
| A | 18365 | 120 | 0.653417% |
| B | 18366 | 141 | 0.767723% |
| C | 18366 | 211 | 1.148862% |
| D | 18366 | 490 | 2.667973% |
Noise dominated data is calculated using 1-second bins in cleaned event files. If a bin has >2000 counts, and if more than 50% of those come from <1% of pixels, then it is considered to be noise-dominated and hence unusable.
| Quadrant | # 1 sec bins | Bins with >0 counts | Bins with >2000 counts | High rate bins dominated by noise | Noise dominated (total time) | Noise dominated (detector-on time) | Marked lightcurve |
|---|---|---|---|---|---|---|---|
| A | 20390 | 18368 | 0 | 0 | 0.00% | 0.00% | 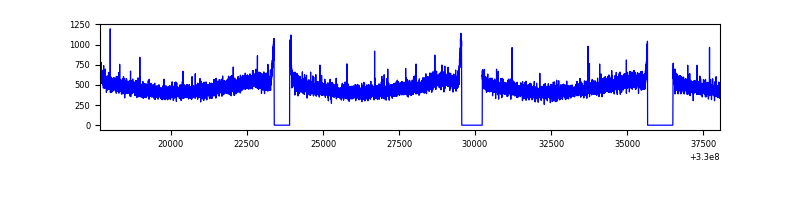 |
| B | 20391 | 18369 | 1 | 1 | 0.00% | 0.01% | 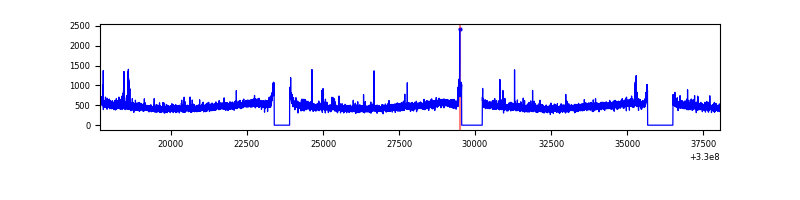 |
| C | 20391 | 18369 | 0 | 0 | 0.00% | 0.00% | 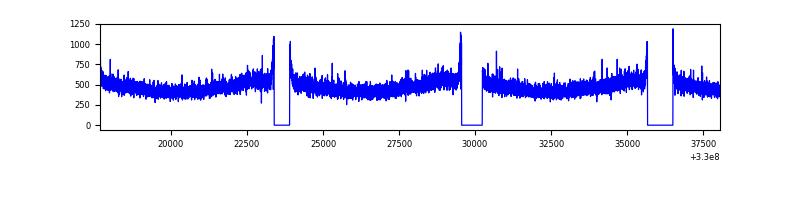 |
| D | 20391 | 18369 | 313 | 313 | 1.53% | 1.70% | 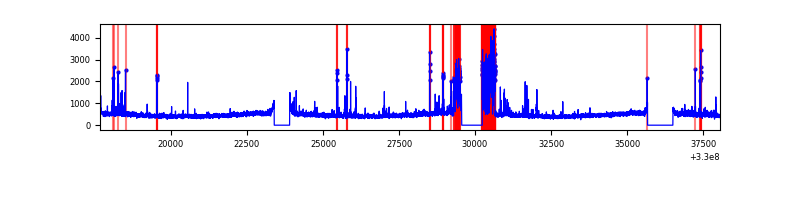 |
Top three noisy pixels from each quadrant. If the there are fewer than three noisy pixels in the level2.evt file, extra rows are filled as -1
| Pixel properties | Quadrant properties | ||||||
|---|---|---|---|---|---|---|---|
| Quadrant | DetID | PixID | Counts | Sigma | Mean | Median | Sigma |
| A | 13 | 254 | 28966 | 59.95 | 2231 | 2181 | 446.8 |
| A | 3 | 137 | 21326 | 42.85 | 2231 | 2181 | 446.8 |
| A | 0 | 226 | 18713 | 37.0 | 2231 | 2181 | 446.8 |
| B | 0 | 190 | 97626 | 224.45 | 2215 | 2158 | 425.3 |
| B | 12 | 111 | 52831 | 119.13 | 2215 | 2158 | 425.3 |
| B | 11 | 111 | 47998 | 107.77 | 2215 | 2158 | 425.3 |
| C | 14 | 238 | 336182 | 669.65 | 2134 | 2150 | 498.8 |
| C | 3 | 233 | 18871 | 33.52 | 2134 | 2150 | 498.8 |
| C | 13 | 61 | 14653 | 25.06 | 2134 | 2150 | 498.8 |
| D | 12 | 233 | 1157000 | 2227.89 | 2145 | 2084 | 518.4 |
| D | 8 | 195 | 269649 | 516.15 | 2145 | 2084 | 518.4 |
| D | 2 | 234 | 80803 | 151.85 | 2145 | 2084 | 518.4 |
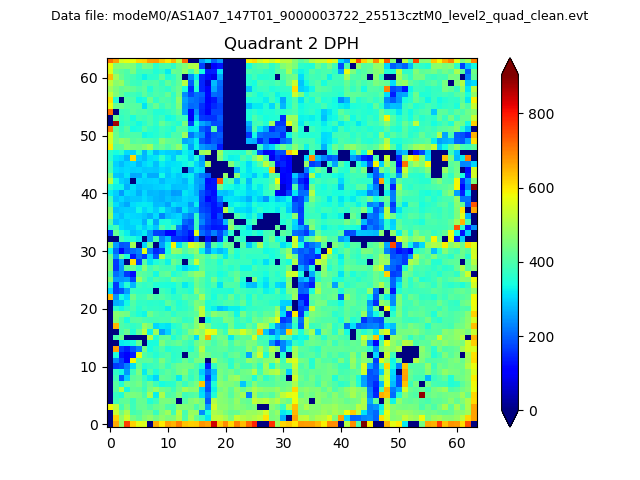
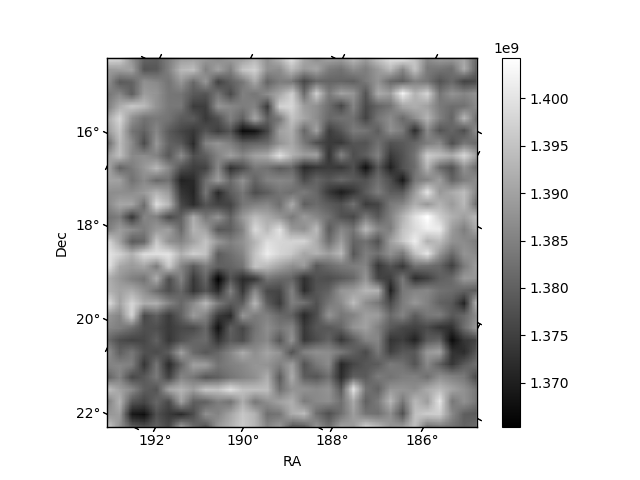
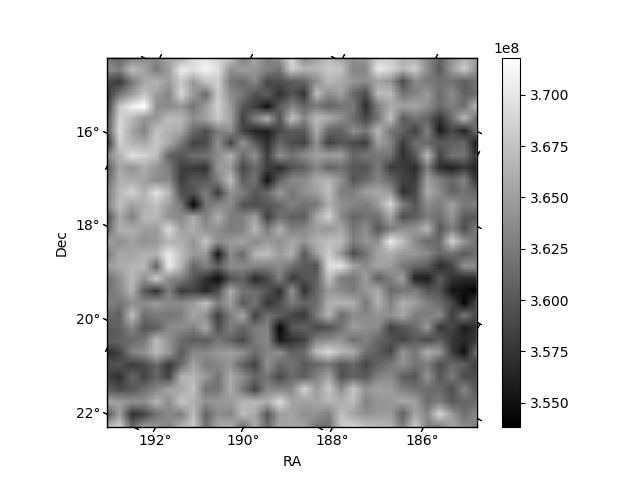
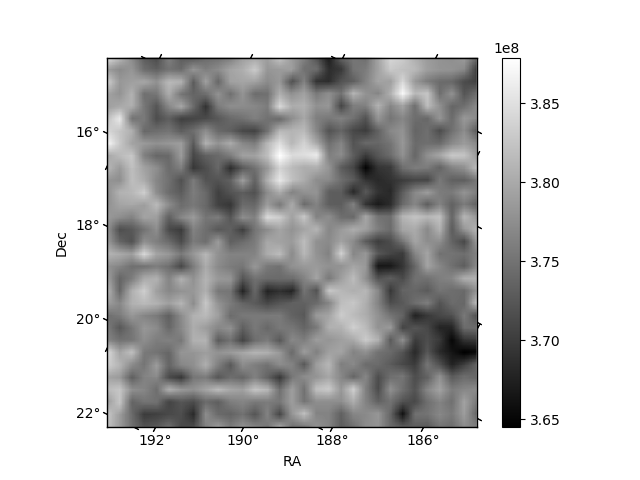
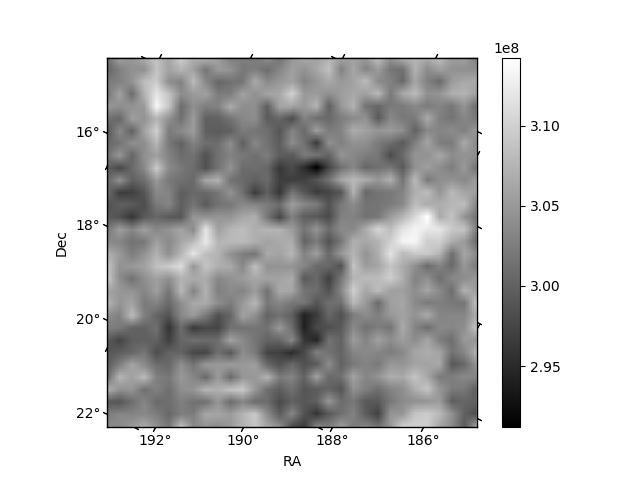
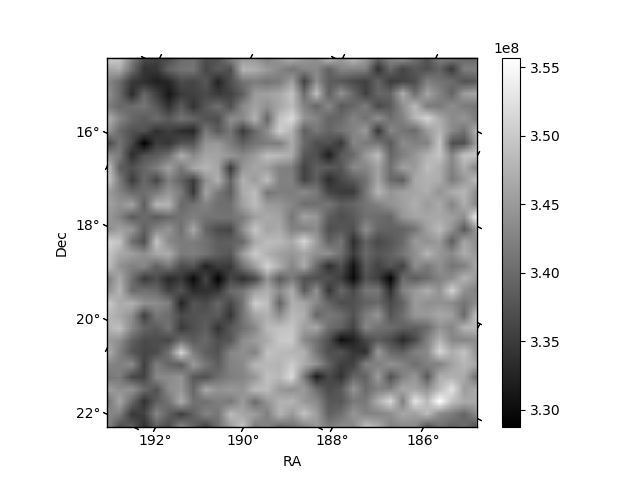
Histogram calculated using DETX and DETY for each event in the final _common_clean file
| Quadrant A | 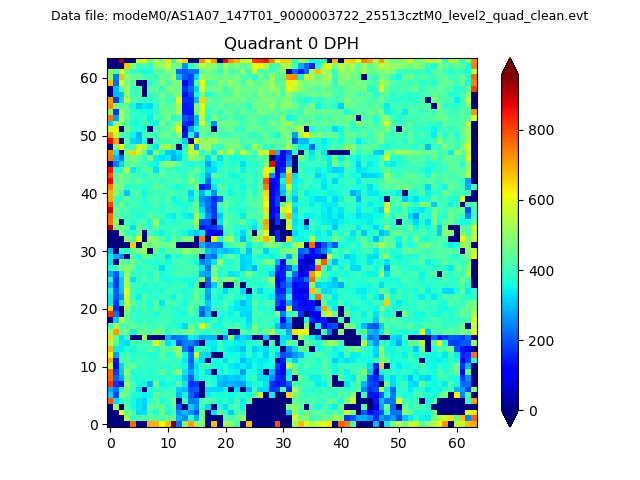 |
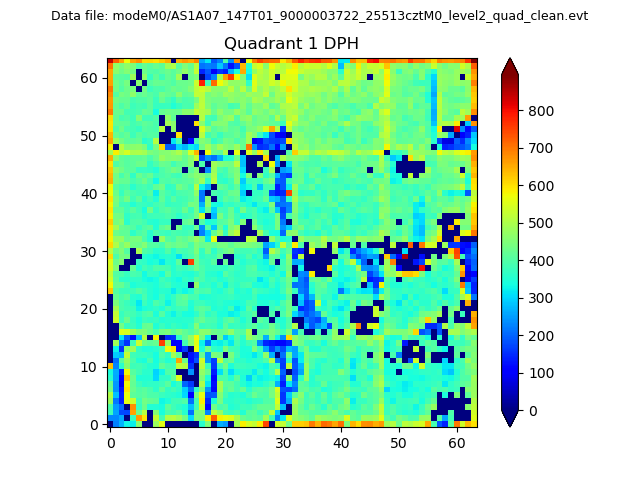 |
Quadrant B |
|---|---|---|---|
| Quadrant D | 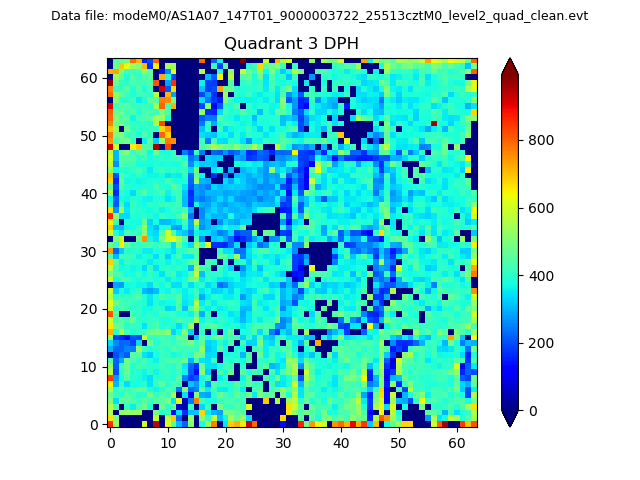 |
 |
Quadrant C |
| Plot type | Count rate plots | Images |
|---|---|---|
| Comparison with Poisson distribution Blue bars denote a histogram of data divided into 1 sec bins. Red curve is a Poisson curve with rate = median count rate of data. |
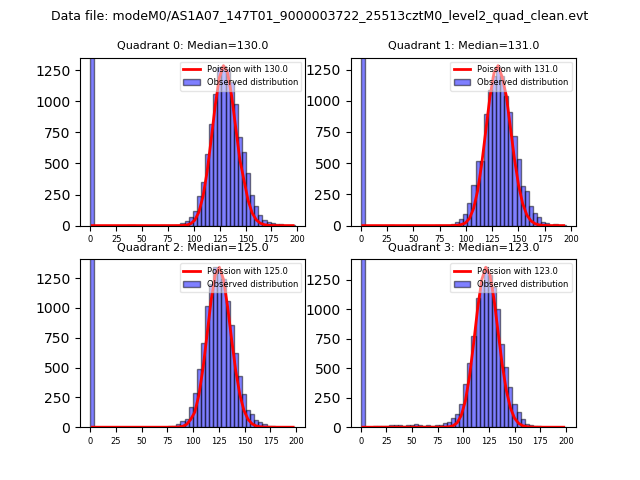 |
 |
| Quadrant-wise count rates Data is divided into 100 sec bins |
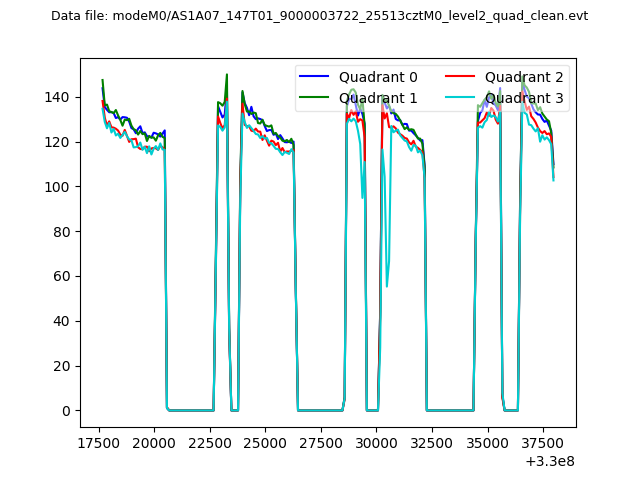 |
|
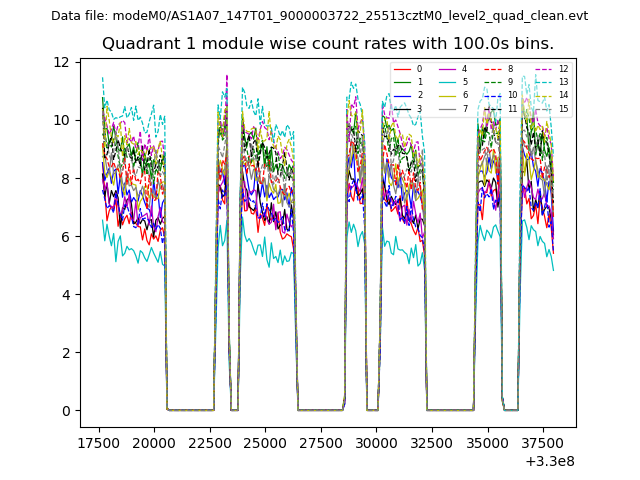
| Module-wise count rates for Quadrant A Data is divided into 100 sec bins |
 |
 |
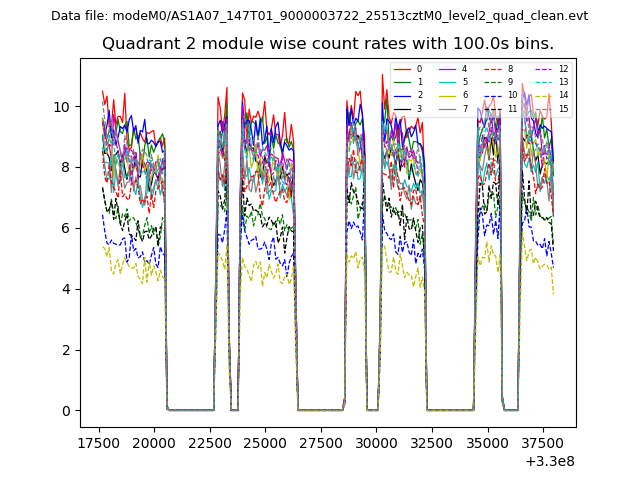
| Module-wise count rates for Quadrant B Data is divided into 100 sec bins |
 |
 |
| Module-wise count rates for Quadrant C Data is divided into 100 sec bins |
 |
 |
| Module-wise count rates for Quadrant D Data is divided into 100 sec bins |
 |
 |
| Parameter | Plot |
|---|---|
| CZT HV Monitor | 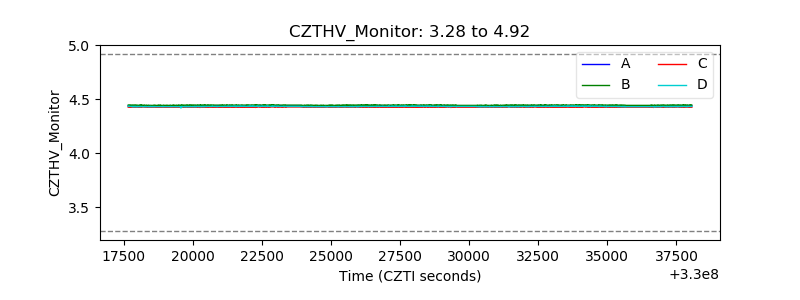 |
| D_VDD | 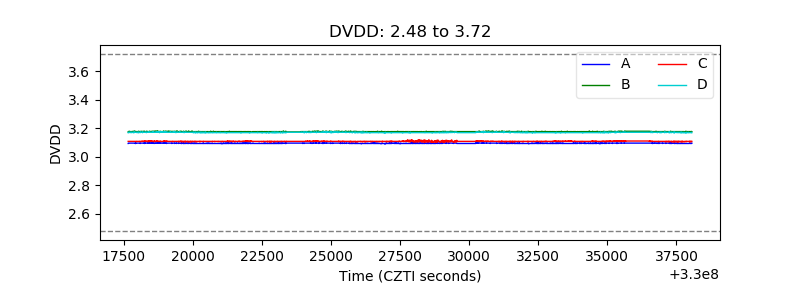 |
| Temperature 1 | 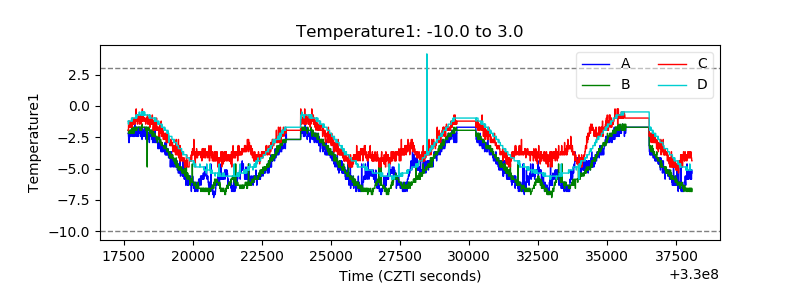 |
| Veto HV Monitor |  |
| Veto LLD | 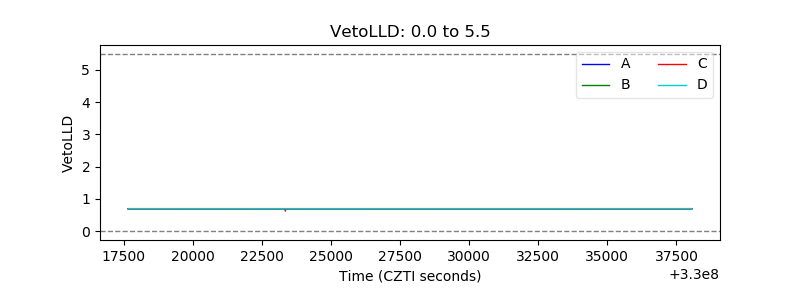 |
| Alpha Counter | 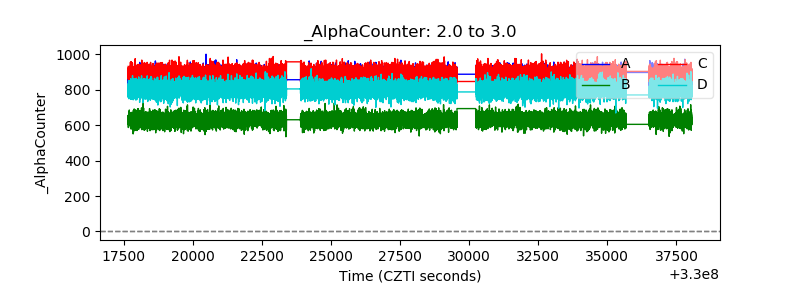 |
| _CPM_Rate | 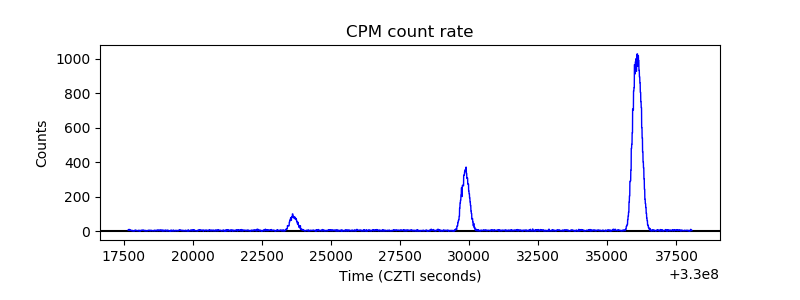 |
| CZT Counter | 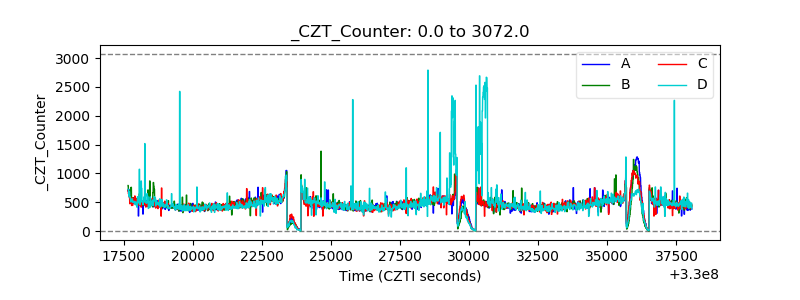 |
| +2.5 Volts monitor | 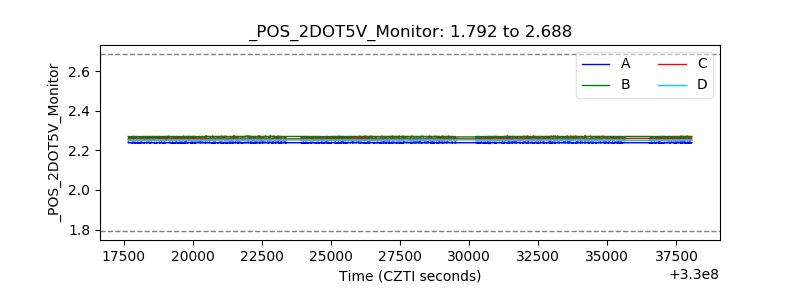 |
| +5 Volts monitor |  |
| _ROLL_ROT |  |
| _Roll_DEC | 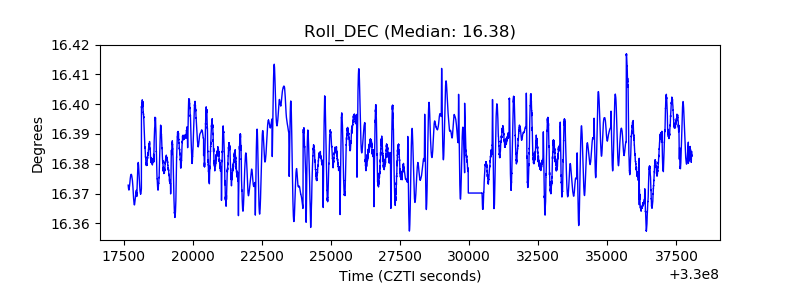 |
| _Roll_RA | 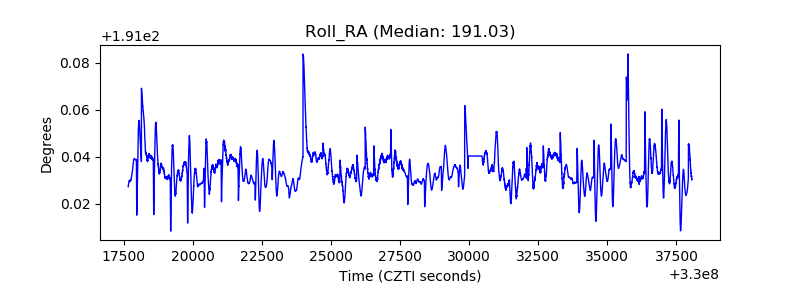 |
| Veto Counter | 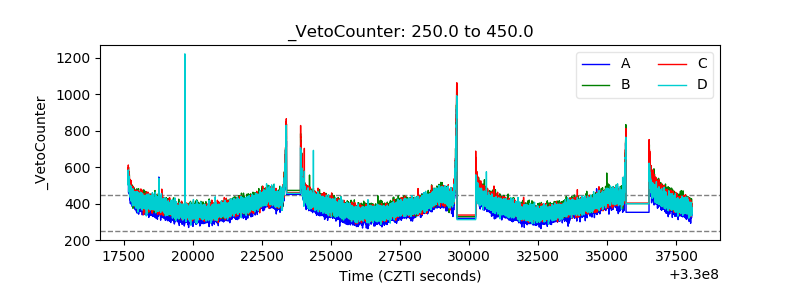 |