| Param | Original file | Final file |
|---|---|---|
| Filename | modeM0/AS1A07_147T01_9000003722_25514cztM0_level2.evt | modeM0/AS1A07_147T01_9000003722_25514cztM0_level2_quad_clean.evt |
| Size (bytes) | 442,624,320 | 90,501,120 |
| Size | 422.1 MB | 86.3 MB |
| Events in quadrant A | 3,185,698 | 580,953 |
| Events in quadrant B | 3,239,097 | 591,396 |
| Events in quadrant C | 3,222,904 | 555,453 |
| Events in quadrant D | 3,299,923 | 543,993 |
| Mode M0 | |||
|---|---|---|---|
| Quadrant | BADHDUFLAG | Total packets | Discarded packets |
| A | 0 | 13721 | 0 |
| B | 0 | 13790 | 0 |
| C | 0 | 13788 | 0 |
| D | 0 | 14122 | 0 |
| Mode M9 | |||
|---|---|---|---|
| Quadrant | BADHDUFLAG | Total packets | Discarded packets |
| A | 0 | 10 | 0 |
| B | 0 | 10 | 0 |
| C | 0 | 10 | 0 |
| D | 0 | 10 | 0 |
| Quadrant | Total seconds | Saturated seconds | Saturation percentage |
|---|---|---|---|
| A | 6728 | 21 | 0.312128% |
| B | 6728 | 32 | 0.475624% |
| C | 6728 | 68 | 1.010702% |
| D | 6728 | 27 | 0.401308% |
Noise dominated data is calculated using 1-second bins in cleaned event files. If a bin has >2000 counts, and if more than 50% of those come from <1% of pixels, then it is considered to be noise-dominated and hence unusable.
| Quadrant | # 1 sec bins | Bins with >0 counts | Bins with >2000 counts | High rate bins dominated by noise | Noise dominated (total time) | Noise dominated (detector-on time) | Marked lightcurve |
|---|---|---|---|---|---|---|---|
| A | 7728 | 6729 | 0 | 0 | 0.00% | 0.00% | 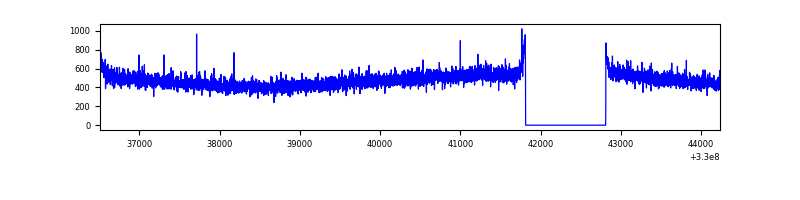 |
| B | 7728 | 6729 | 0 | 0 | 0.00% | 0.00% | 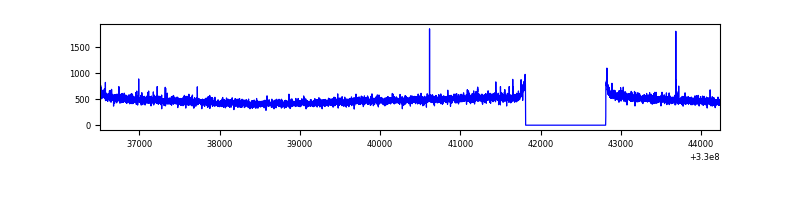 |
| C | 7728 | 6729 | 0 | 0 | 0.00% | 0.00% | 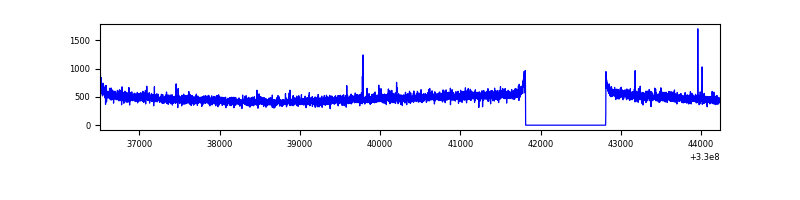 |
| D | 7728 | 6729 | 12 | 12 | 0.16% | 0.18% | 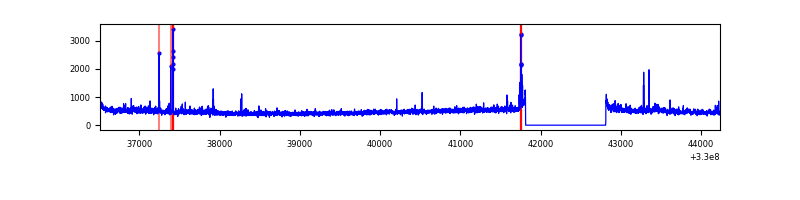 |
Top three noisy pixels from each quadrant. If the there are fewer than three noisy pixels in the level2.evt file, extra rows are filled as -1
| Pixel properties | Quadrant properties | ||||||
|---|---|---|---|---|---|---|---|
| Quadrant | DetID | PixID | Counts | Sigma | Mean | Median | Sigma |
| A | 13 | 254 | 10591 | 59.47 | 825 | 808 | 164.5 |
| A | 3 | 137 | 7732 | 42.09 | 825 | 808 | 164.5 |
| A | 0 | 226 | 6881 | 36.92 | 825 | 808 | 164.5 |
| B | 12 | 111 | 19071 | 115.5 | 822 | 801 | 158.2 |
| B | 11 | 111 | 17439 | 105.18 | 822 | 801 | 158.2 |
| B | 14 | 111 | 15806 | 94.86 | 822 | 801 | 158.2 |
| C | 14 | 238 | 127935 | 683.46 | 789 | 796 | 186.0 |
| C | 3 | 233 | 6989 | 33.29 | 789 | 796 | 186.0 |
| C | 2 | 16 | 6872 | 32.66 | 789 | 796 | 186.0 |
| D | 8 | 195 | 179288 | 923.94 | 796 | 775 | 193.2 |
| D | 1 | 52 | 57204 | 292.06 | 796 | 775 | 193.2 |
| D | 2 | 82 | 44237 | 224.95 | 796 | 775 | 193.2 |
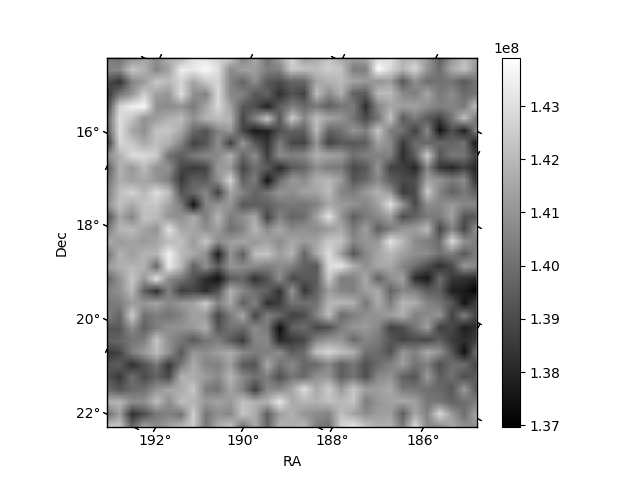
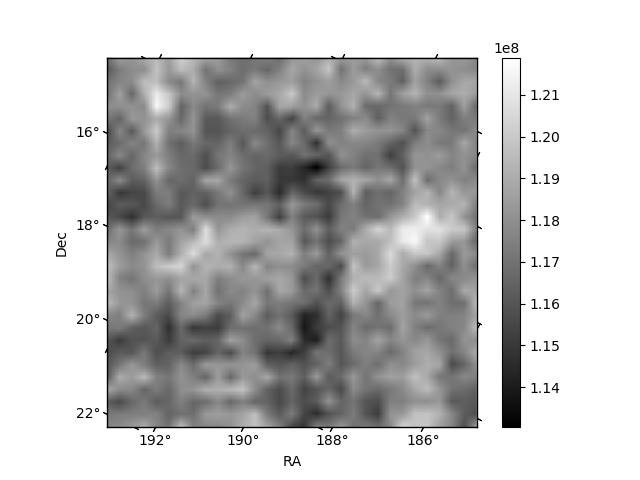
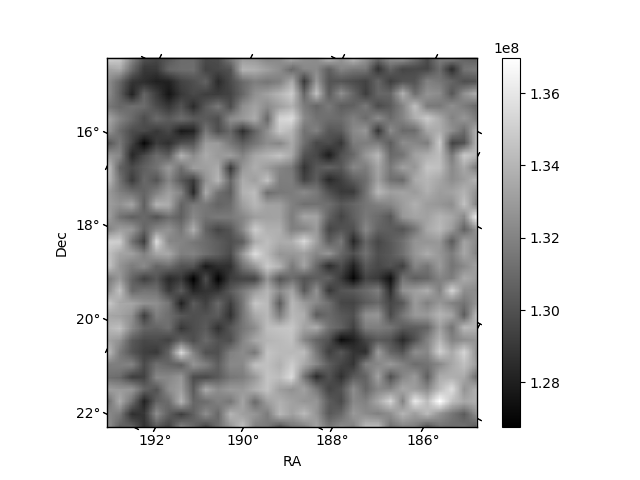
Histogram calculated using DETX and DETY for each event in the final _common_clean file
| Quadrant A | 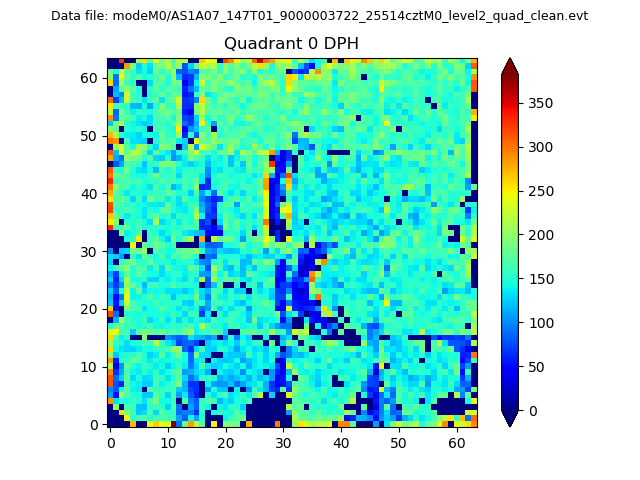 |
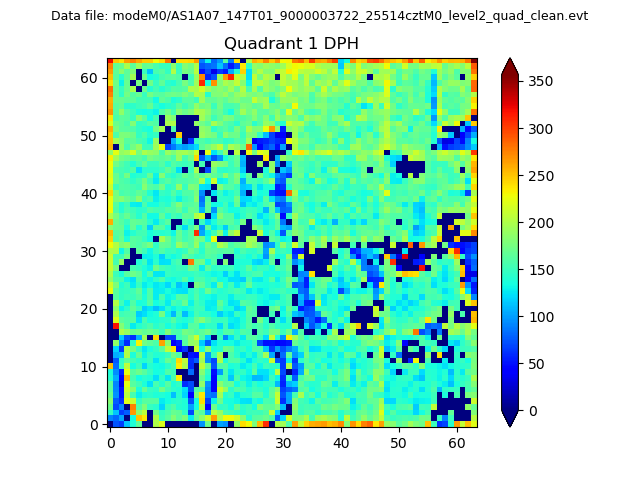 |
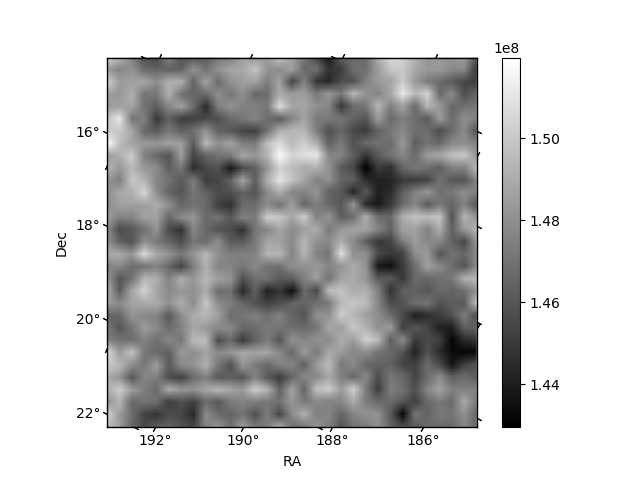
Quadrant B |
|---|---|---|---|
| Quadrant D |  |
 |
Quadrant C |
| Plot type | Count rate plots | Images |
|---|---|---|
| Comparison with Poisson distribution Blue bars denote a histogram of data divided into 1 sec bins. Red curve is a Poisson curve with rate = median count rate of data. |
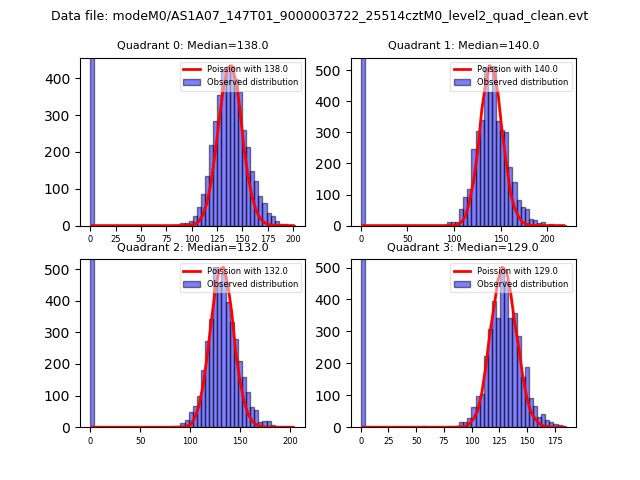 |
 |
| Quadrant-wise count rates Data is divided into 100 sec bins |
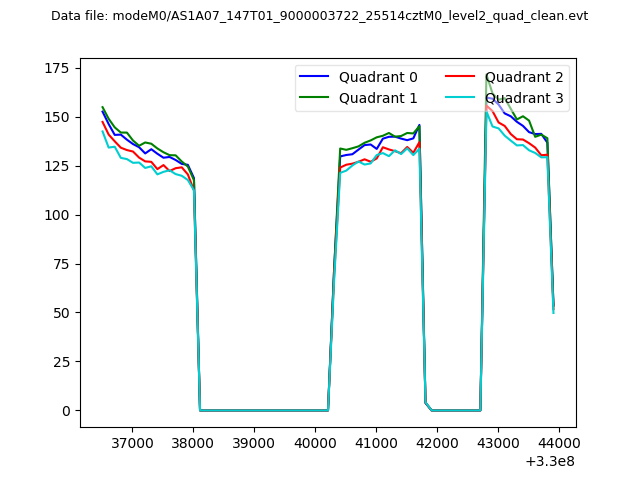 |
|
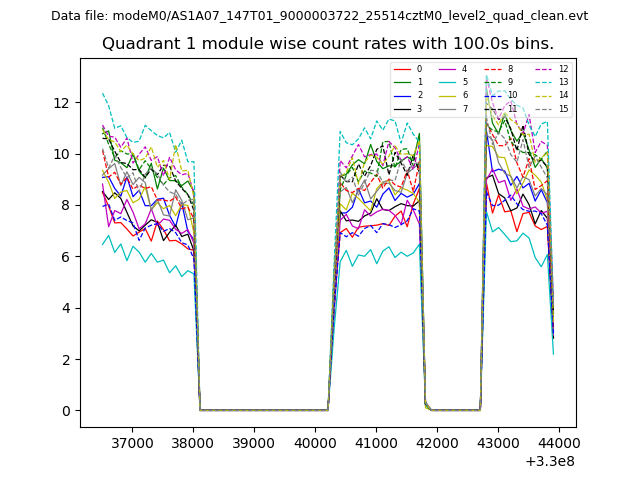
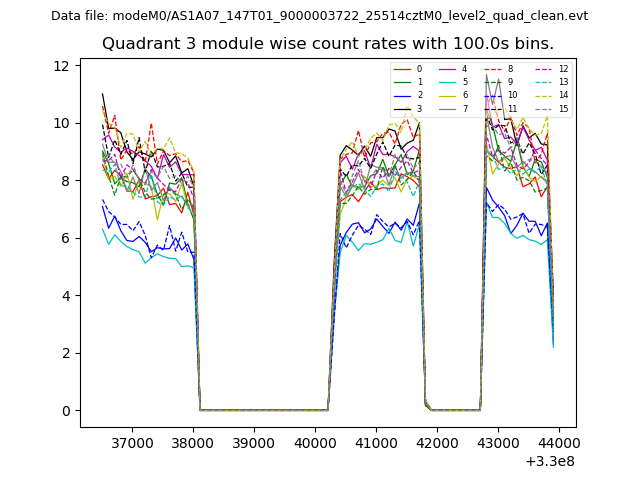
| Module-wise count rates for Quadrant A Data is divided into 100 sec bins |
 |
 |
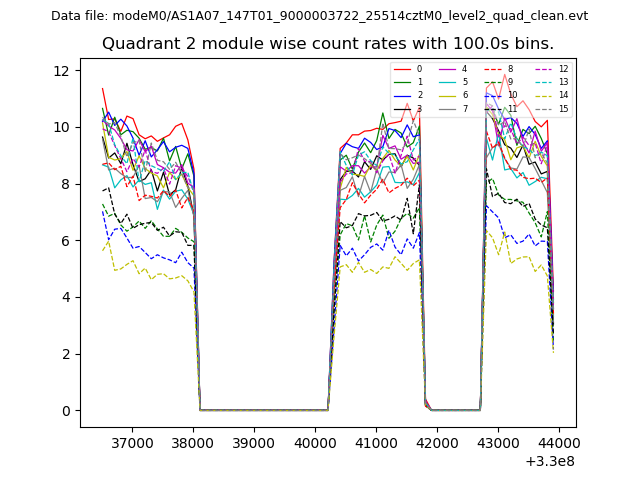
| Module-wise count rates for Quadrant B Data is divided into 100 sec bins |
 |
 |
| Module-wise count rates for Quadrant C Data is divided into 100 sec bins |
 |
 |
| Module-wise count rates for Quadrant D Data is divided into 100 sec bins |
 |
 |
| Parameter | Plot |
|---|---|
| CZT HV Monitor | 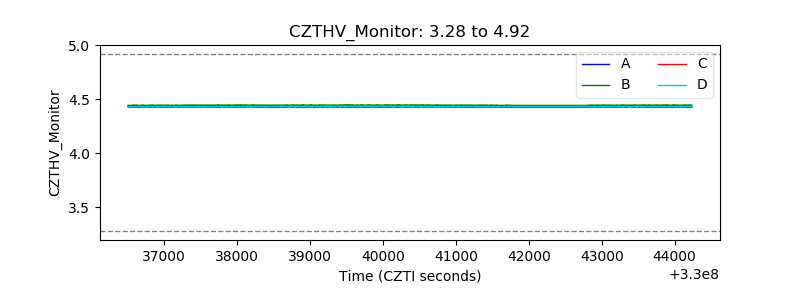 |
| D_VDD | 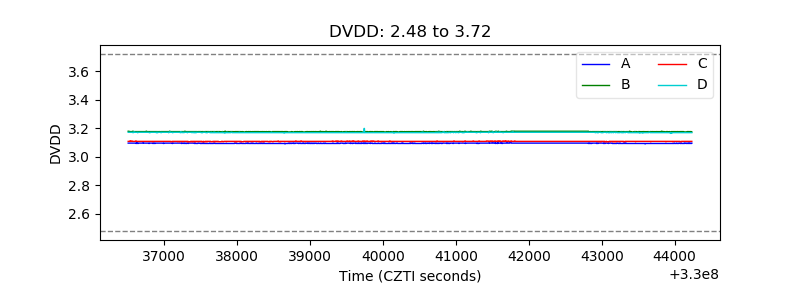 |
| Temperature 1 | 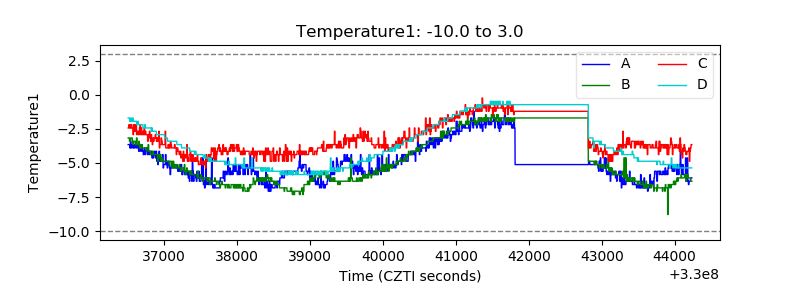 |
| Veto HV Monitor | 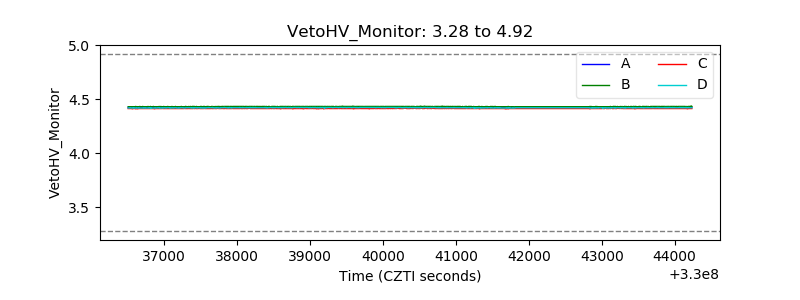 |
| Veto LLD | 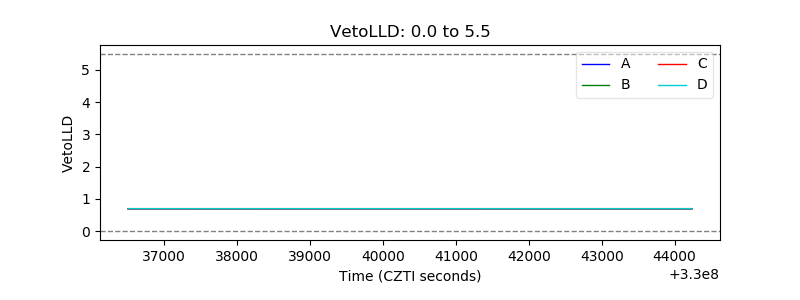 |
| Alpha Counter | 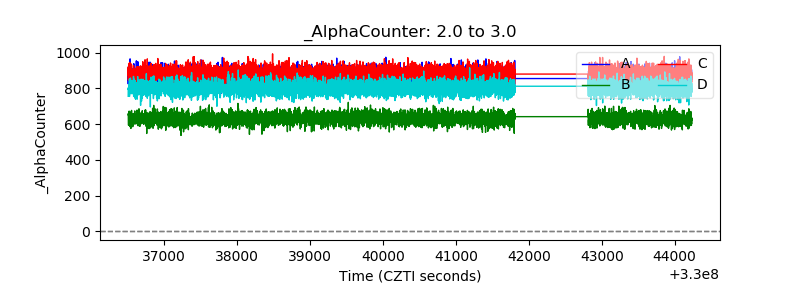 |
| _CPM_Rate | 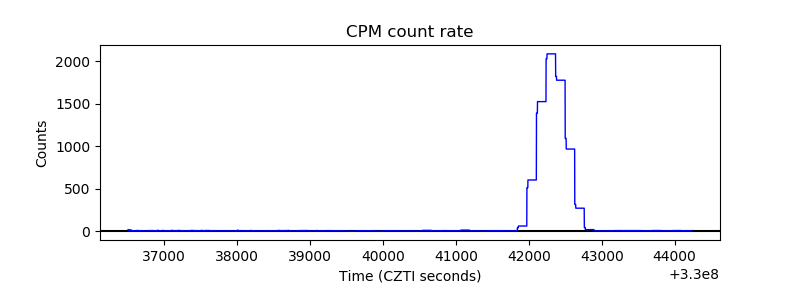 |
| CZT Counter |  |
| +2.5 Volts monitor |  |
| +5 Volts monitor | 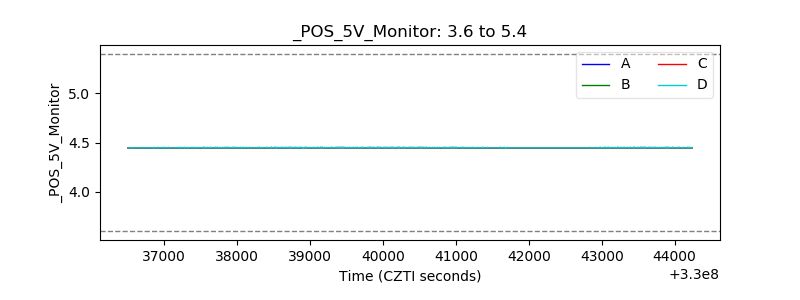 |
| _ROLL_ROT | 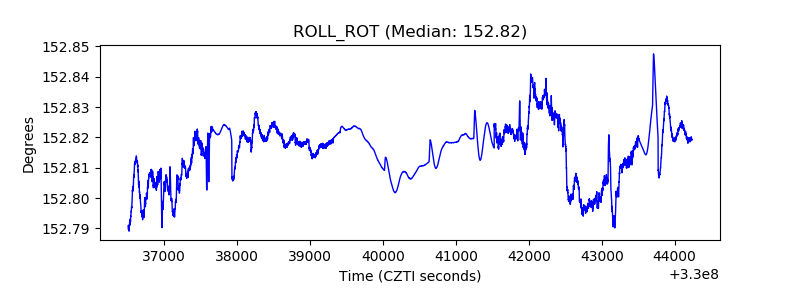 |
| _Roll_DEC | 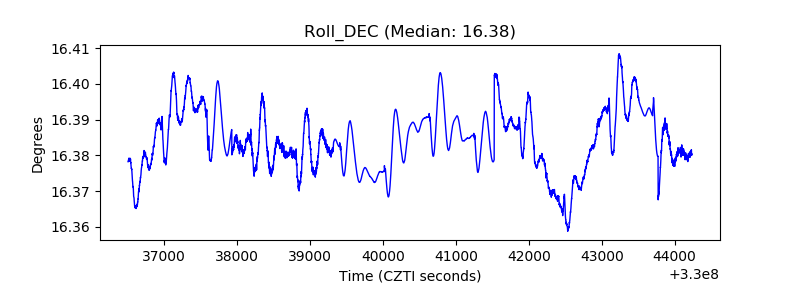 |
| _Roll_RA | 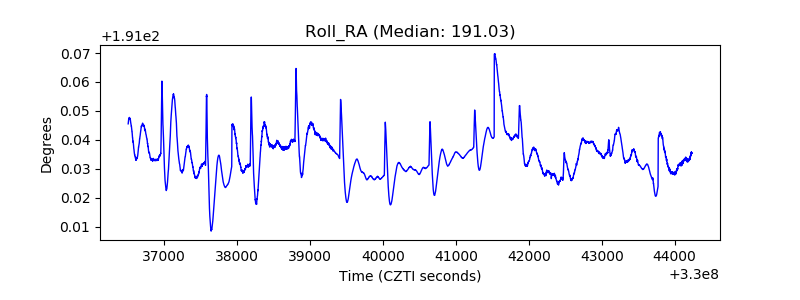 |
| Veto Counter | 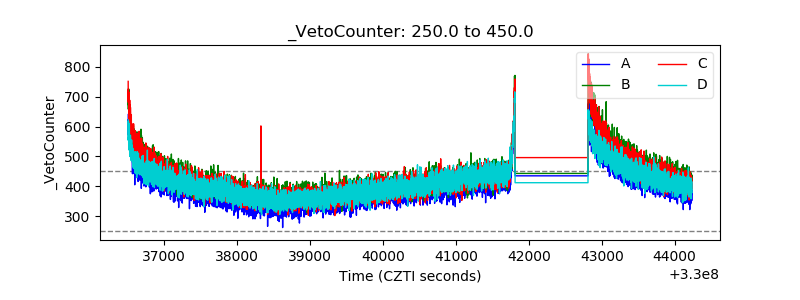 |