| Param | Original file | Final file |
|---|---|---|
| Filename | modeM0/AS1A07_147T01_9000003722_25517cztM0_level2.evt | modeM0/AS1A07_147T01_9000003722_25517cztM0_level2_quad_clean.evt |
| Size (bytes) | 447,013,440 | 75,277,440 |
| Size | 426.3 MB | 71.8 MB |
| Events in quadrant A | 3,268,064 | 473,010 |
| Events in quadrant B | 3,359,719 | 485,106 |
| Events in quadrant C | 3,259,061 | 446,061 |
| Events in quadrant D | 3,223,476 | 435,931 |
| Mode M0 | |||
|---|---|---|---|
| Quadrant | BADHDUFLAG | Total packets | Discarded packets |
| A | 0 | 13376 | 0 |
| B | 0 | 13711 | 0 |
| C | 0 | 13375 | 0 |
| D | 0 | 13473 | 0 |
| Mode M9 | |||
|---|---|---|---|
| Quadrant | BADHDUFLAG | Total packets | Discarded packets |
| A | 0 | 22 | 0 |
| B | 0 | 23 | 0 |
| C | 0 | 23 | 0 |
| D | 0 | 23 | 0 |
| Quadrant | Total seconds | Saturated seconds | Saturation percentage |
|---|---|---|---|
| A | 6293 | 15 | 0.238360% |
| B | 6293 | 22 | 0.349595% |
| C | 6292 | 47 | 0.746980% |
| D | 6292 | 20 | 0.317864% |
Noise dominated data is calculated using 1-second bins in cleaned event files. If a bin has >2000 counts, and if more than 50% of those come from <1% of pixels, then it is considered to be noise-dominated and hence unusable.
| Quadrant | # 1 sec bins | Bins with >0 counts | Bins with >2000 counts | High rate bins dominated by noise | Noise dominated (total time) | Noise dominated (detector-on time) | Marked lightcurve |
|---|---|---|---|---|---|---|---|
| A | 7548 | 6294 | 0 | 0 | 0.00% | 0.00% | 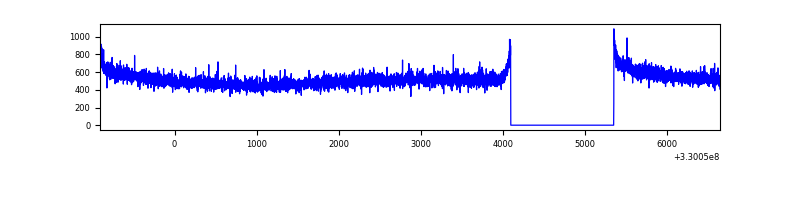 |
| B | 7548 | 6294 | 0 | 0 | 0.00% | 0.00% | 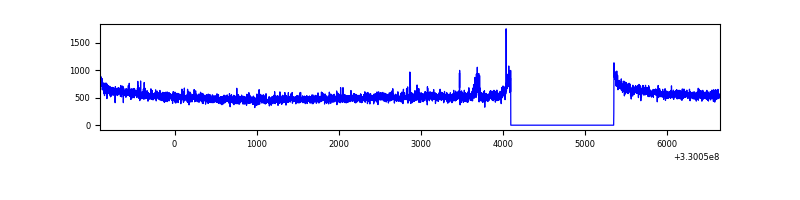 |
| C | 7547 | 6293 | 0 | 0 | 0.00% | 0.00% |  |
| D | 7547 | 6293 | 10 | 10 | 0.13% | 0.16% | 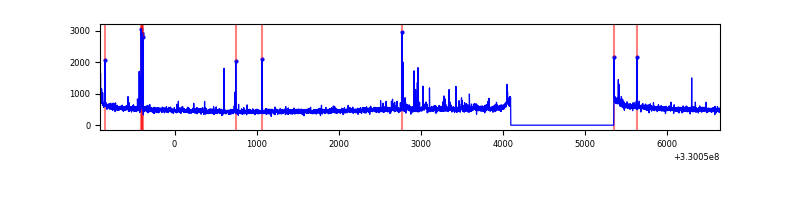 |
Top three noisy pixels from each quadrant. If the there are fewer than three noisy pixels in the level2.evt file, extra rows are filled as -1
| Pixel properties | Quadrant properties | ||||||
|---|---|---|---|---|---|---|---|
| Quadrant | DetID | PixID | Counts | Sigma | Mean | Median | Sigma |
| A | 13 | 254 | 10505 | 57.75 | 848 | 835 | 167.4 |
| A | 3 | 137 | 7304 | 38.64 | 848 | 835 | 167.4 |
| A | 0 | 226 | 7235 | 38.22 | 848 | 835 | 167.4 |
| B | 0 | 190 | 31848 | 194.39 | 849 | 831 | 159.6 |
| B | 12 | 111 | 18673 | 111.82 | 849 | 831 | 159.6 |
| B | 11 | 111 | 17120 | 102.09 | 849 | 831 | 159.6 |
| C | 14 | 238 | 129363 | 691.3 | 799 | 806 | 186.0 |
| C | 3 | 233 | 6583 | 31.07 | 799 | 806 | 186.0 |
| C | 9 | 54 | 5825 | 26.99 | 799 | 806 | 186.0 |
| D | 1 | 52 | 81934 | 416.95 | 804 | 783 | 194.6 |
| D | 8 | 195 | 60166 | 305.1 | 804 | 783 | 194.6 |
| D | 2 | 234 | 24808 | 123.44 | 804 | 783 | 194.6 |
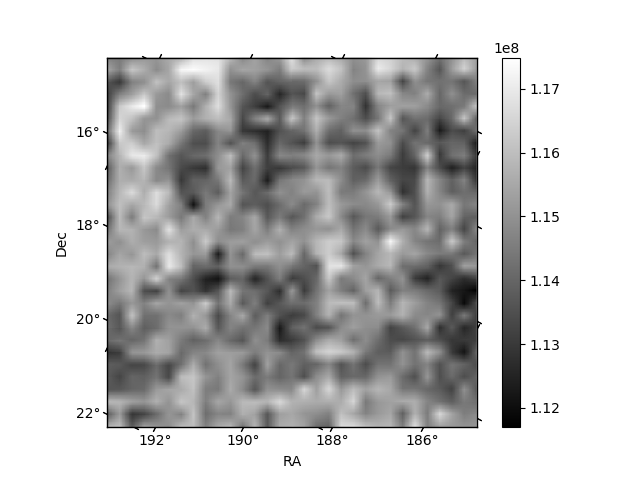
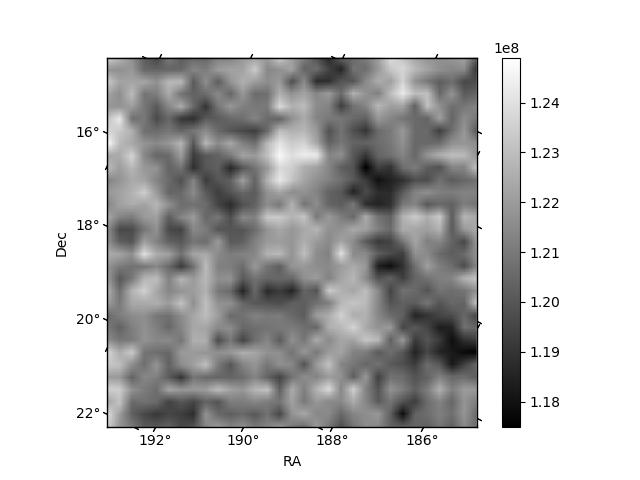
Histogram calculated using DETX and DETY for each event in the final _common_clean file
| Quadrant A | 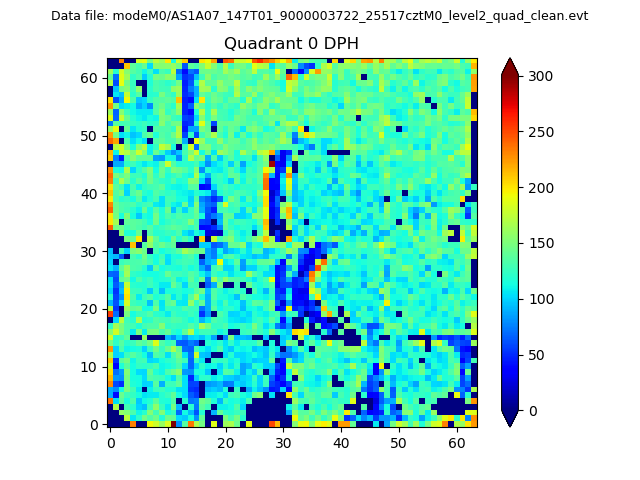 |
 |
Quadrant B |
|---|---|---|---|
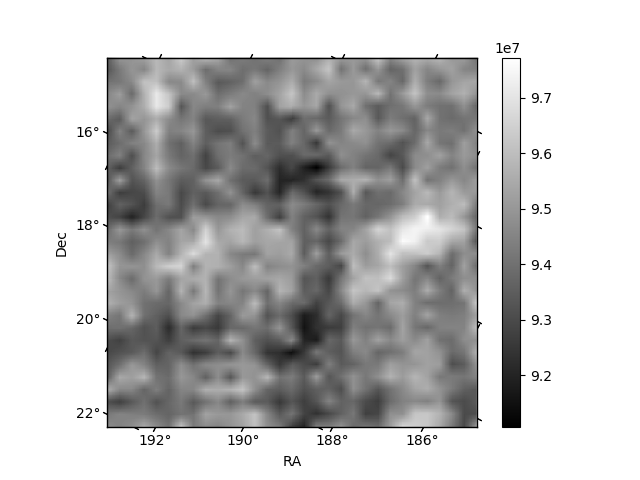
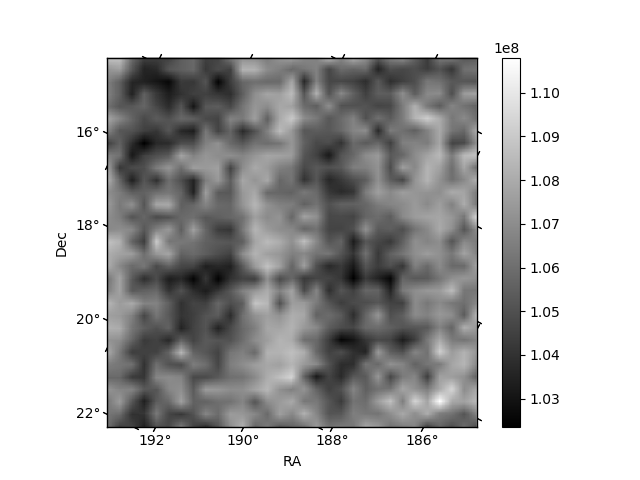
| Quadrant D | 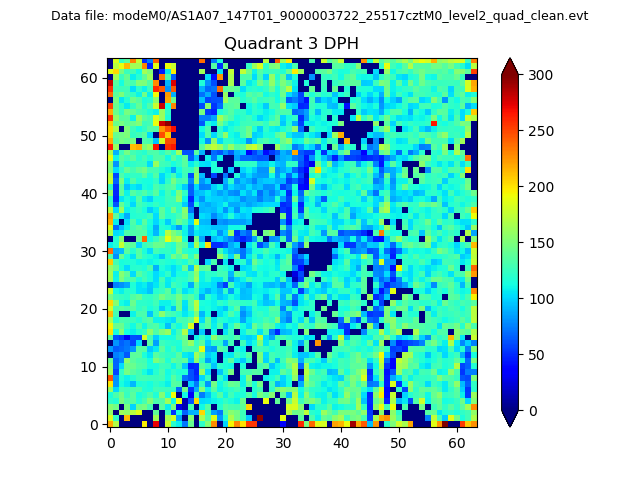 |
 |
Quadrant C |
| Plot type | Count rate plots | Images |
|---|---|---|
| Comparison with Poisson distribution Blue bars denote a histogram of data divided into 1 sec bins. Red curve is a Poisson curve with rate = median count rate of data. |
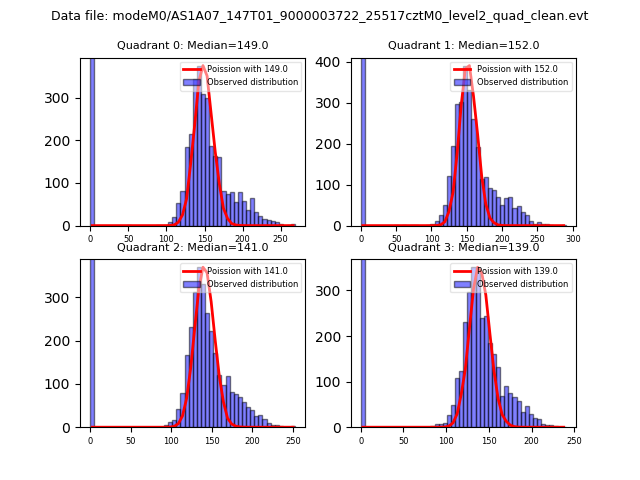 |
 |
| Quadrant-wise count rates Data is divided into 100 sec bins |
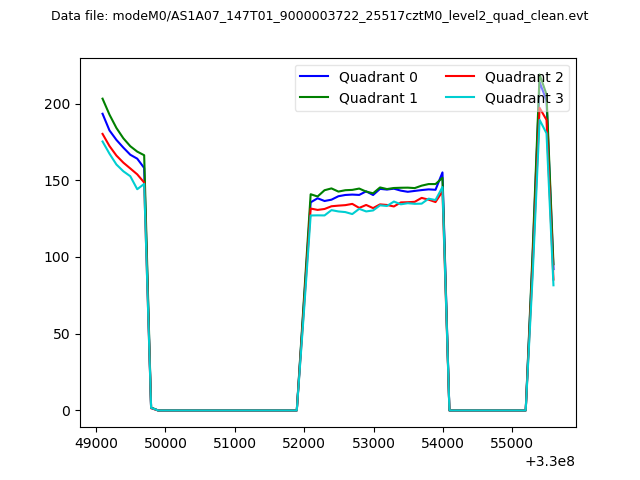 |
|
| Module-wise count rates for Quadrant A Data is divided into 100 sec bins |
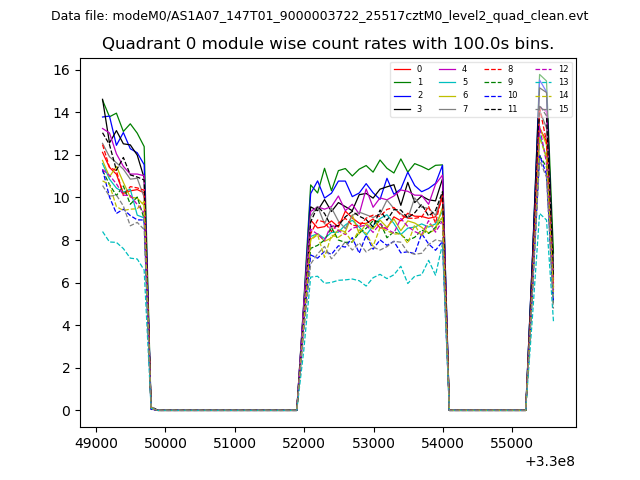 |
 |
| Module-wise count rates for Quadrant B Data is divided into 100 sec bins |
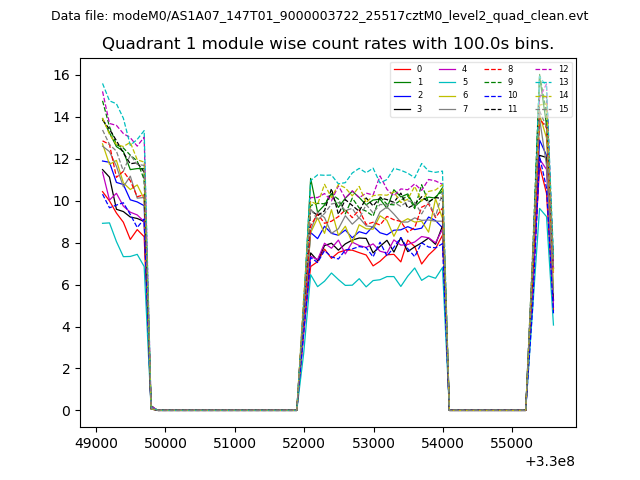 |
 |
| Module-wise count rates for Quadrant C Data is divided into 100 sec bins |
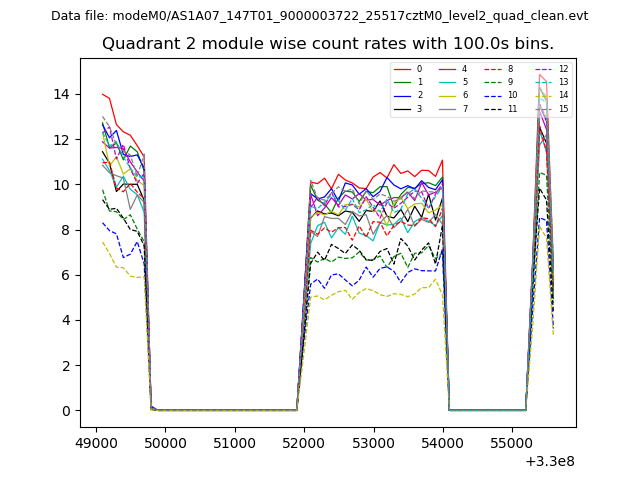 |
 |
| Module-wise count rates for Quadrant D Data is divided into 100 sec bins |
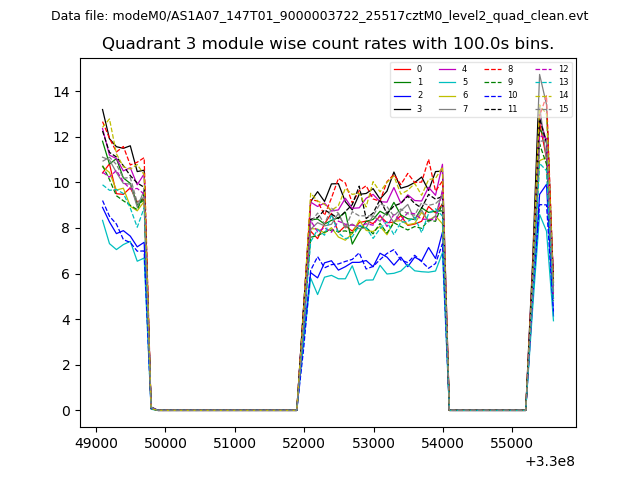 |
 |
| Parameter | Plot |
|---|---|
| CZT HV Monitor | 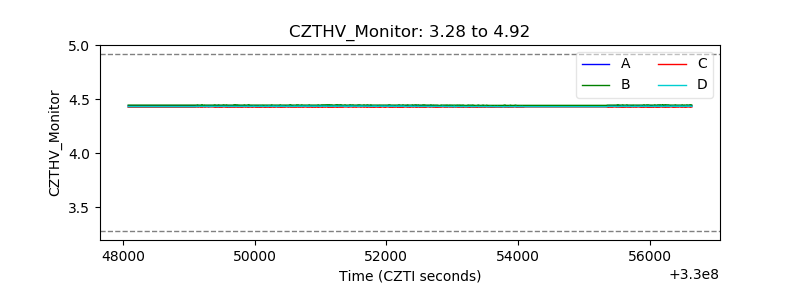 |
| D_VDD | 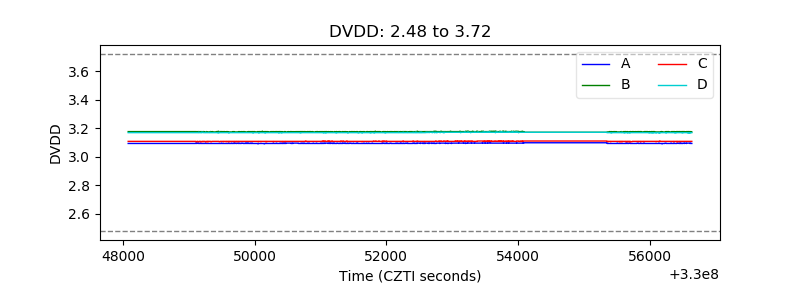 |
| Temperature 1 |  |
| Veto HV Monitor | 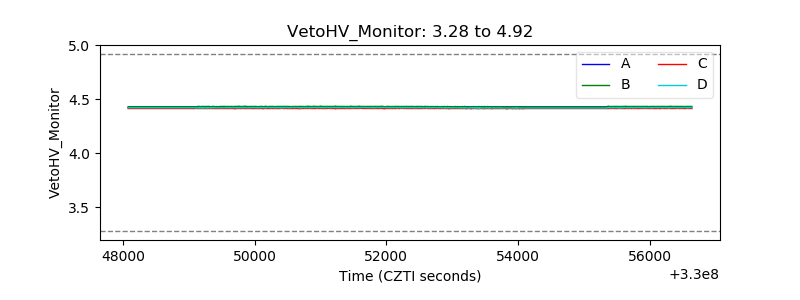 |
| Veto LLD |  |
| Alpha Counter | 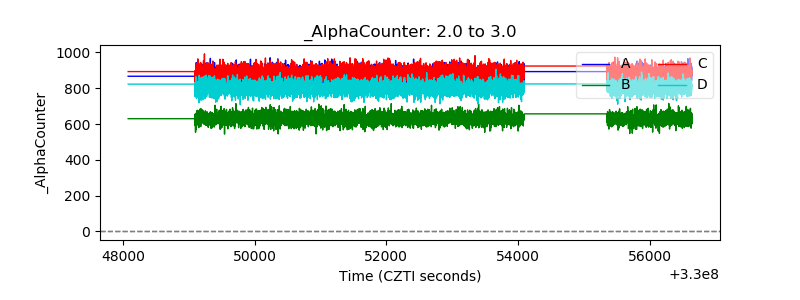 |
| _CPM_Rate | 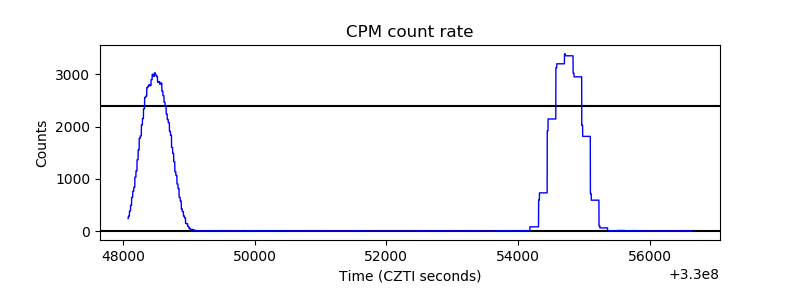 |
| CZT Counter | 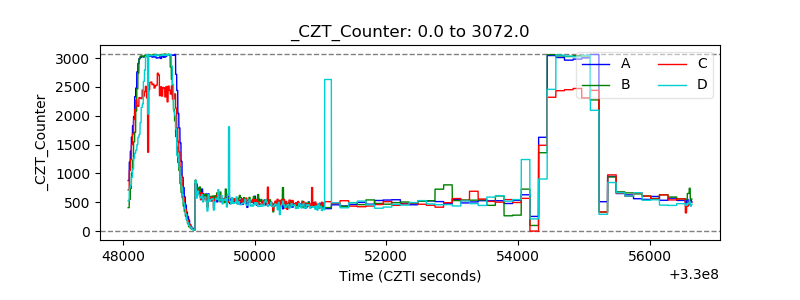 |
| +2.5 Volts monitor |  |
| +5 Volts monitor | 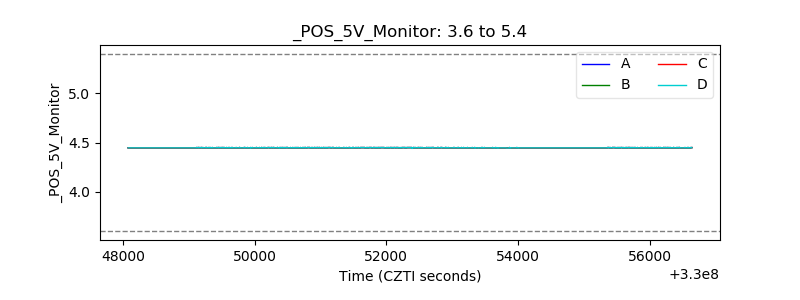 |
| _ROLL_ROT | 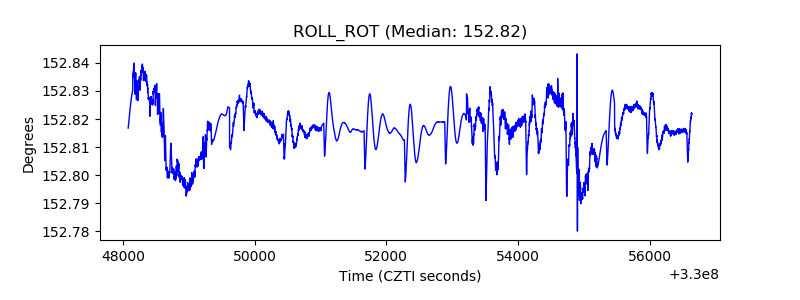 |
| _Roll_DEC | 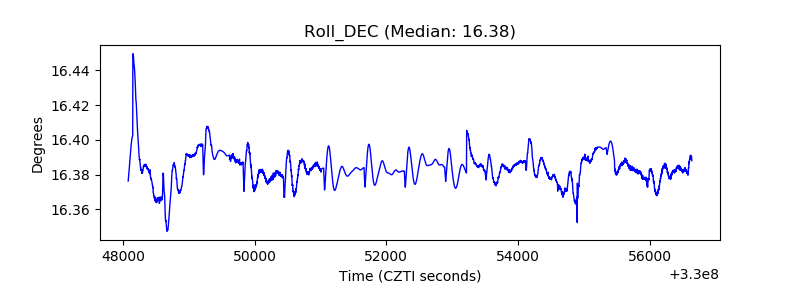 |
| _Roll_RA |  |
| Veto Counter | 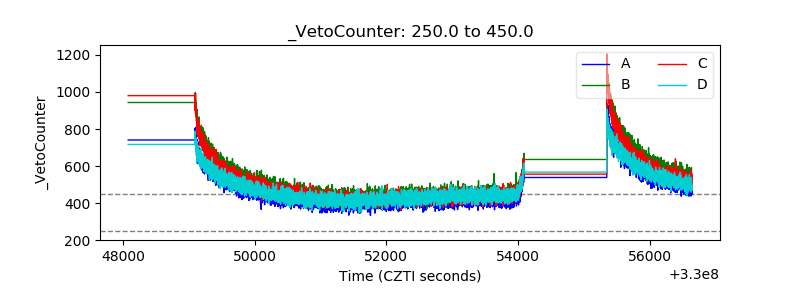 |