| Param | Original file | Final file |
|---|---|---|
| Filename | modeM0/AS1A07_147T01_9000003722_25518cztM0_level2.evt | modeM0/AS1A07_147T01_9000003722_25518cztM0_level2_quad_clean.evt |
| Size (bytes) | 496,690,560 | 68,028,480 |
| Size | 473.7 MB | 64.9 MB |
| Events in quadrant A | 3,570,905 | 415,956 |
| Events in quadrant B | 3,764,457 | 421,481 |
| Events in quadrant C | 3,515,569 | 388,913 |
| Events in quadrant D | 3,750,859 | 380,295 |
| Mode M0 | |||
|---|---|---|---|
| Quadrant | BADHDUFLAG | Total packets | Discarded packets |
| A | 0 | 14347 | 0 |
| B | 0 | 15137 | 0 |
| C | 0 | 14232 | 0 |
| D | 0 | 15162 | 0 |
| Mode M9 | |||
|---|---|---|---|
| Quadrant | BADHDUFLAG | Total packets | Discarded packets |
| A | 0 | 16 | 0 |
| B | 0 | 17 | 0 |
| C | 0 | 17 | 0 |
| D | 0 | 17 | 0 |
| Quadrant | Total seconds | Saturated seconds | Saturation percentage |
|---|---|---|---|
| A | 6501 | 43 | 0.661437% |
| B | 6501 | 55 | 0.846024% |
| C | 6501 | 75 | 1.153669% |
| D | 6501 | 57 | 0.876788% |
Noise dominated data is calculated using 1-second bins in cleaned event files. If a bin has >2000 counts, and if more than 50% of those come from <1% of pixels, then it is considered to be noise-dominated and hence unusable.
| Quadrant | # 1 sec bins | Bins with >0 counts | Bins with >2000 counts | High rate bins dominated by noise | Noise dominated (total time) | Noise dominated (detector-on time) | Marked lightcurve |
|---|---|---|---|---|---|---|---|
| A | 7821 | 6502 | 0 | 0 | 0.00% | 0.00% | 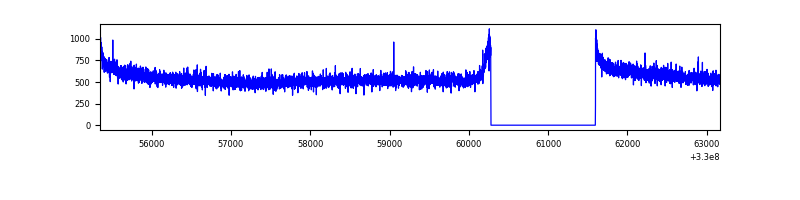 |
| B | 7821 | 6502 | 2 | 2 | 0.03% | 0.03% | 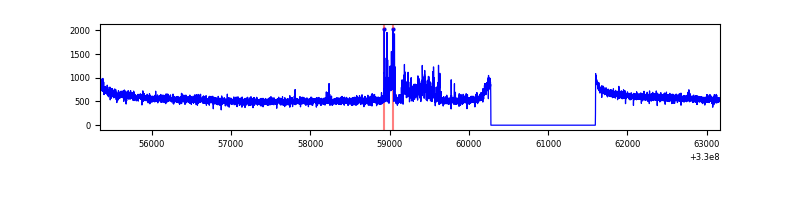 |
| C | 7821 | 6502 | 0 | 0 | 0.00% | 0.00% | 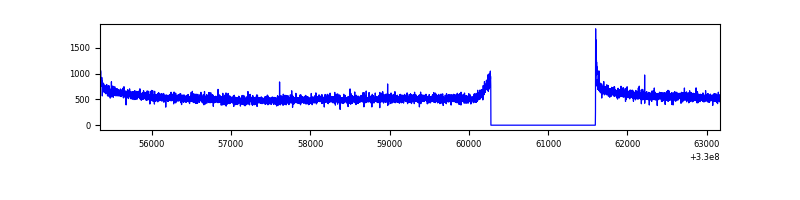 |
| D | 7821 | 6502 | 28 | 28 | 0.36% | 0.43% | 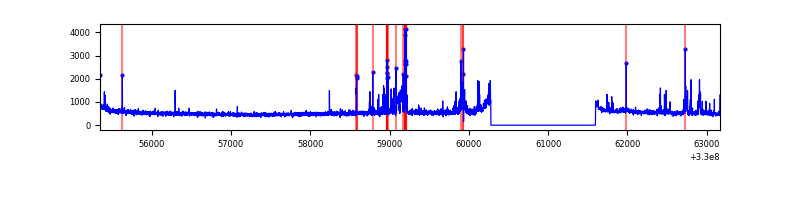 |
Top three noisy pixels from each quadrant. If the there are fewer than three noisy pixels in the level2.evt file, extra rows are filled as -1
| Pixel properties | Quadrant properties | ||||||
|---|---|---|---|---|---|---|---|
| Quadrant | DetID | PixID | Counts | Sigma | Mean | Median | Sigma |
| A | 13 | 254 | 9486 | 47.0 | 925 | 912 | 182.4 |
| A | 0 | 226 | 8031 | 39.03 | 925 | 912 | 182.4 |
| A | 3 | 137 | 7659 | 36.99 | 925 | 912 | 182.4 |
| B | 15 | 33 | 87295 | 508.24 | 921 | 903 | 170.0 |
| B | 5 | 235 | 73369 | 426.31 | 921 | 903 | 170.0 |
| B | 12 | 111 | 20229 | 113.69 | 921 | 903 | 170.0 |
| C | 14 | 238 | 142062 | 710.87 | 861 | 873 | 198.6 |
| C | 0 | 10 | 10134 | 46.63 | 861 | 873 | 198.6 |
| C | 13 | 61 | 5921 | 25.42 | 861 | 873 | 198.6 |
| D | 1 | 52 | 283705 | 1353.68 | 867 | 844 | 209.0 |
| D | 8 | 195 | 88227 | 418.19 | 867 | 844 | 209.0 |
| D | 12 | 233 | 64530 | 304.78 | 867 | 844 | 209.0 |
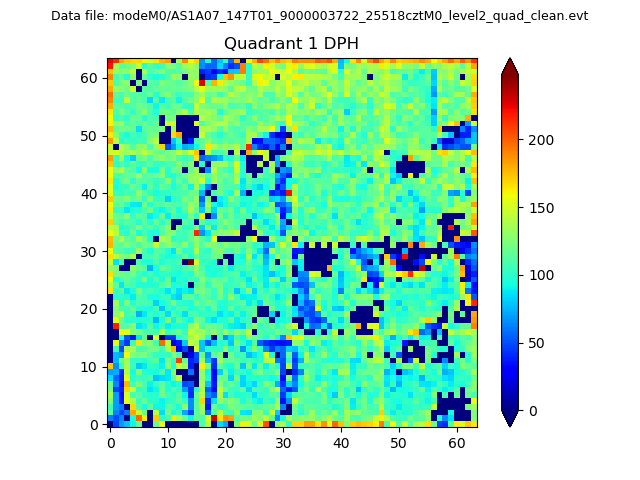
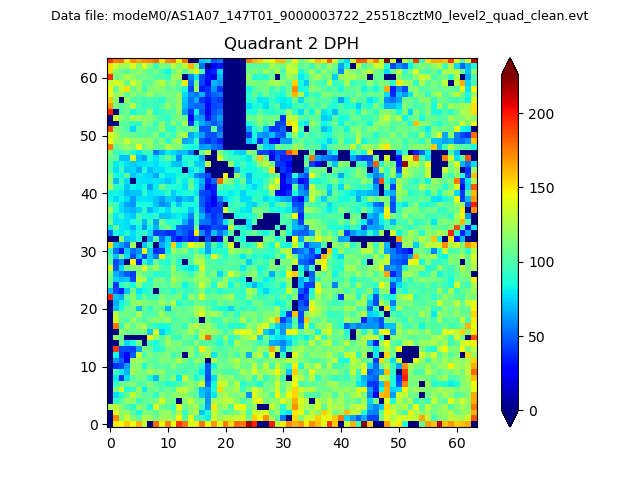
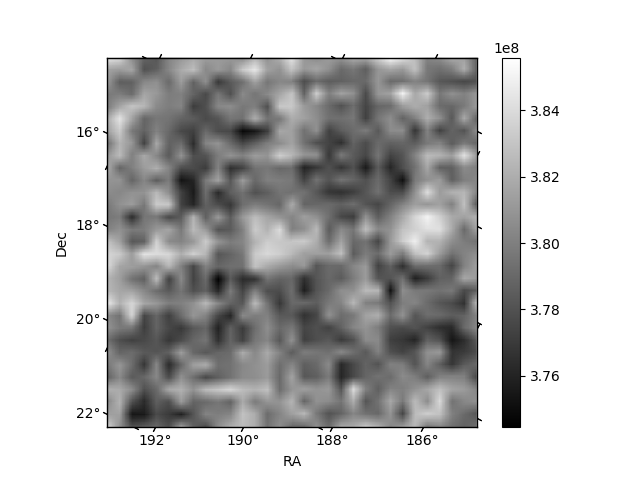
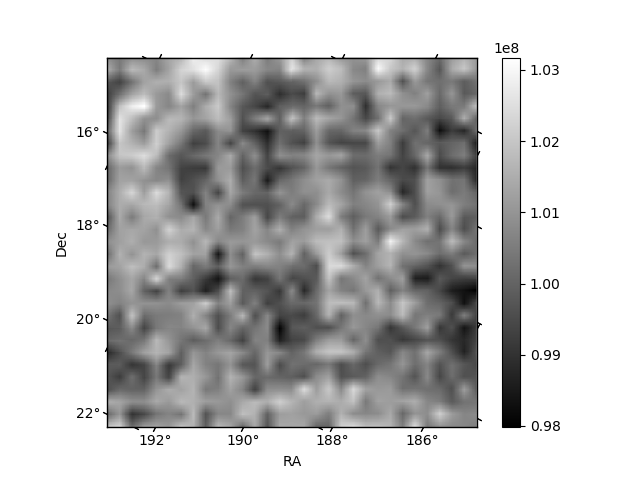
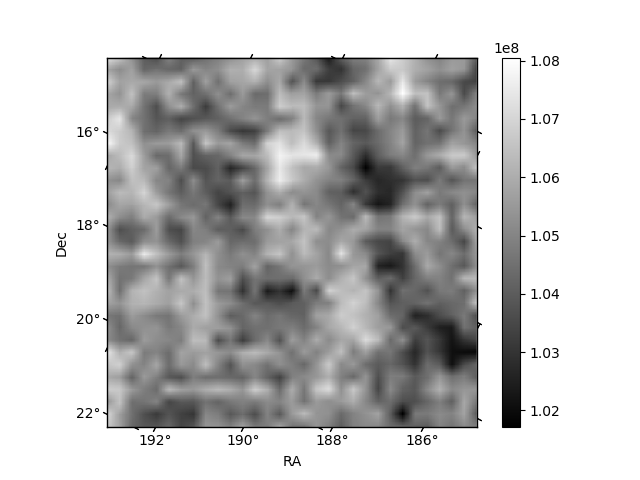
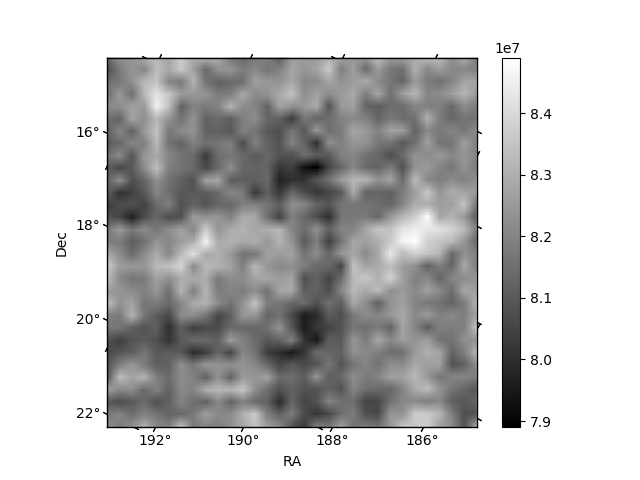
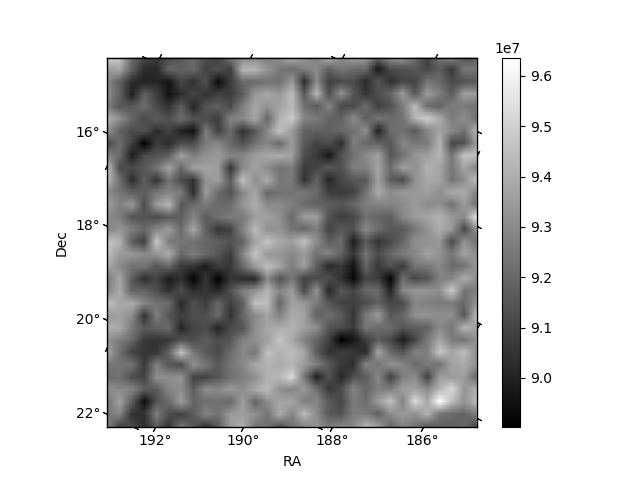
Histogram calculated using DETX and DETY for each event in the final _common_clean file
| Quadrant A |  |
 |
Quadrant B |
|---|---|---|---|
| Quadrant D | 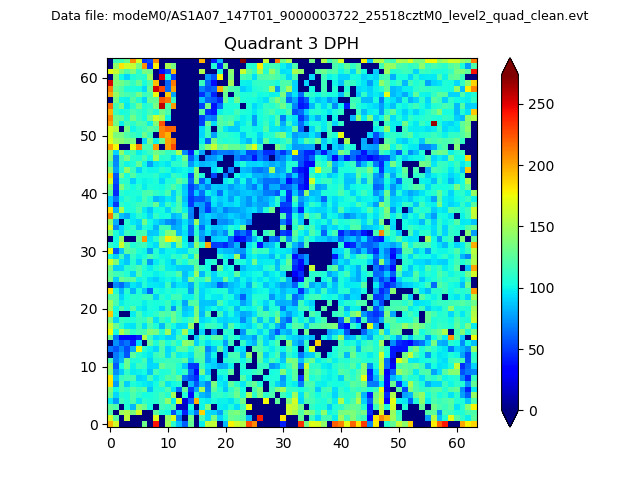 |
 |
Quadrant C |
| Plot type | Count rate plots | Images |
|---|---|---|
| Comparison with Poisson distribution Blue bars denote a histogram of data divided into 1 sec bins. Red curve is a Poisson curve with rate = median count rate of data. |
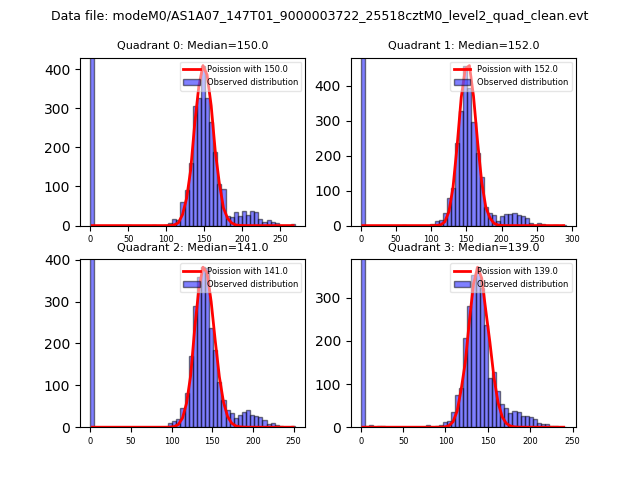 |
 |
| Quadrant-wise count rates Data is divided into 100 sec bins |
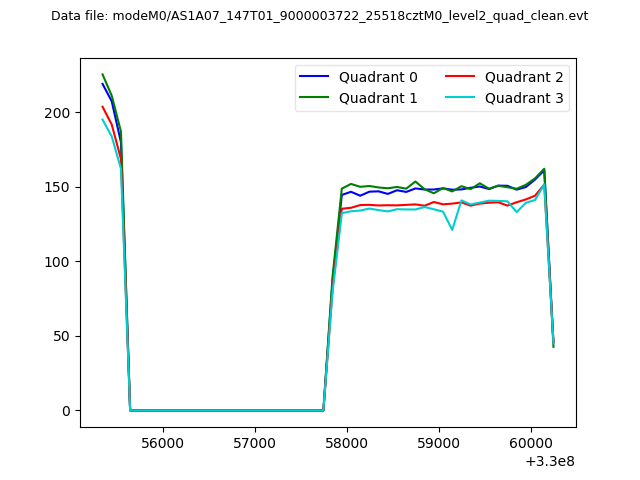 |
|
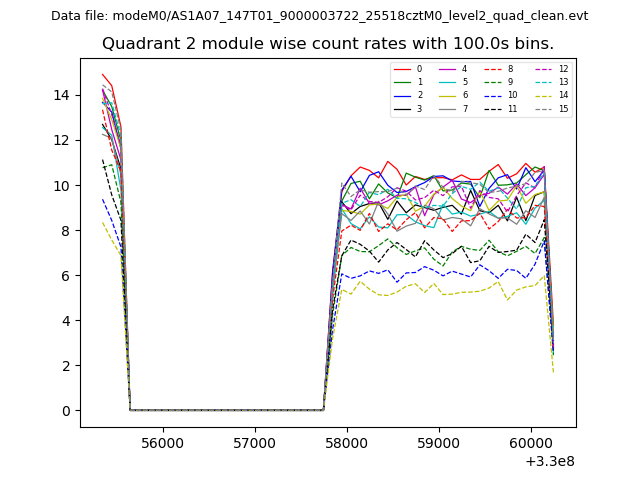
| Module-wise count rates for Quadrant A Data is divided into 100 sec bins |
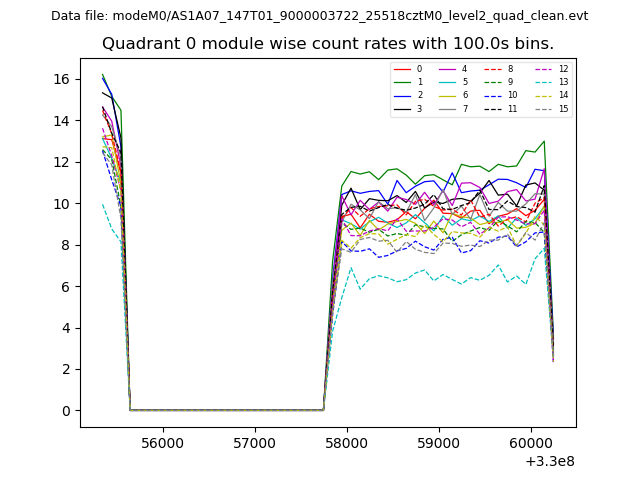 |
 |
| Module-wise count rates for Quadrant B Data is divided into 100 sec bins |
 |
 |
| Module-wise count rates for Quadrant C Data is divided into 100 sec bins |
 |
 |
| Module-wise count rates for Quadrant D Data is divided into 100 sec bins |
 |
 |
| Parameter | Plot |
|---|---|
| CZT HV Monitor |  |
| D_VDD | 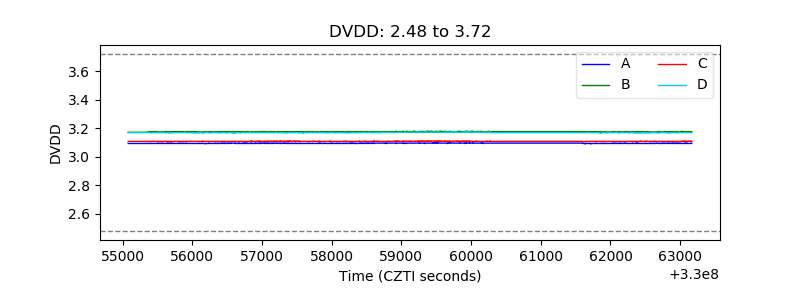 |
| Temperature 1 | 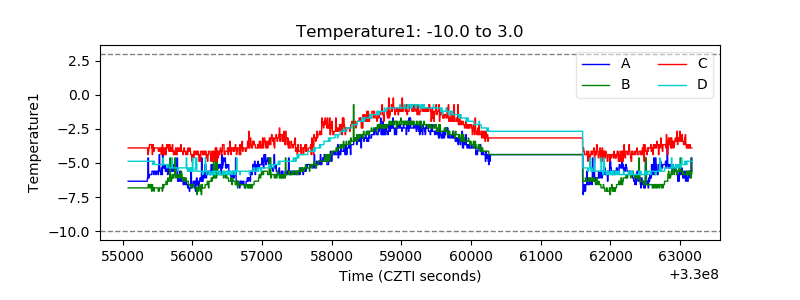 |
| Veto HV Monitor | 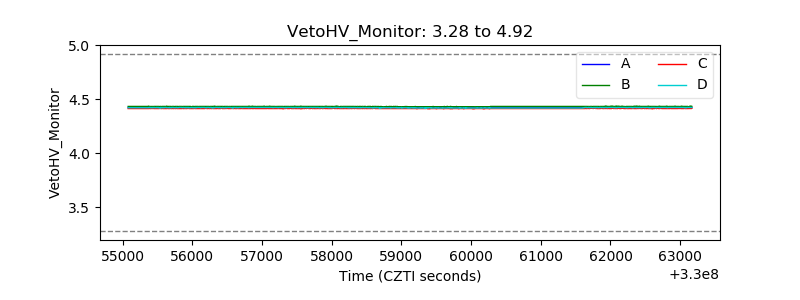 |
| Veto LLD |  |
| Alpha Counter | 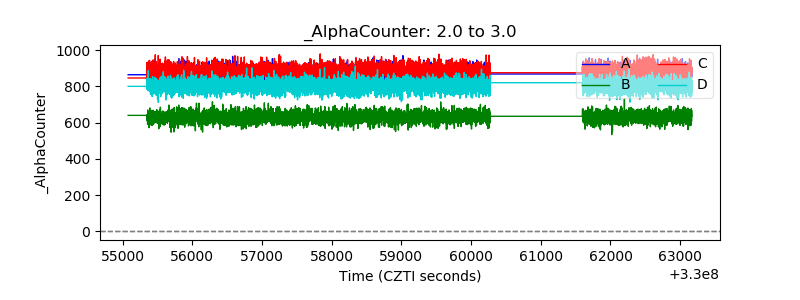 |
| _CPM_Rate | 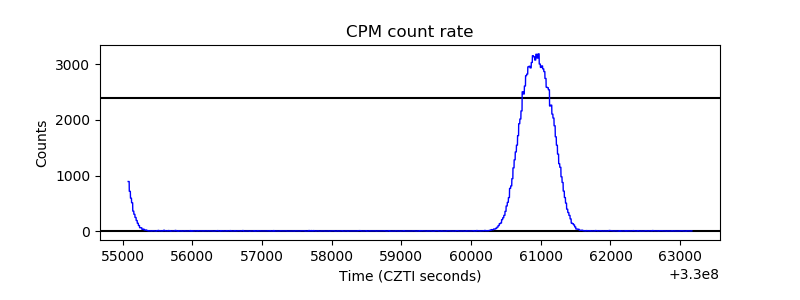 |
| CZT Counter | 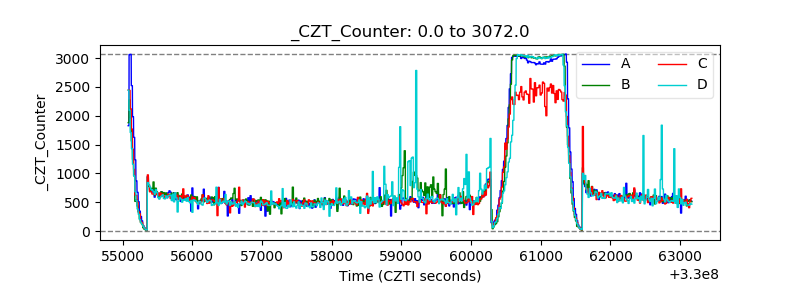 |
| +2.5 Volts monitor | 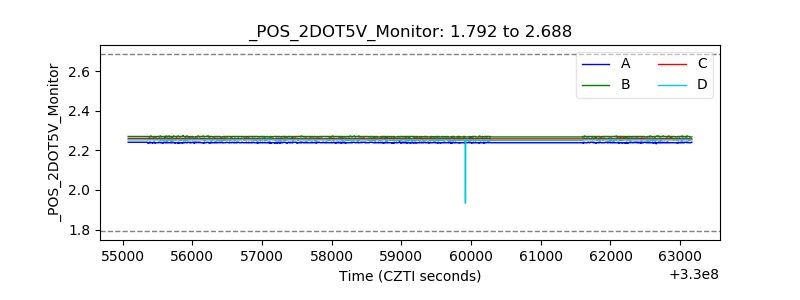 |
| +5 Volts monitor |  |
| _ROLL_ROT | 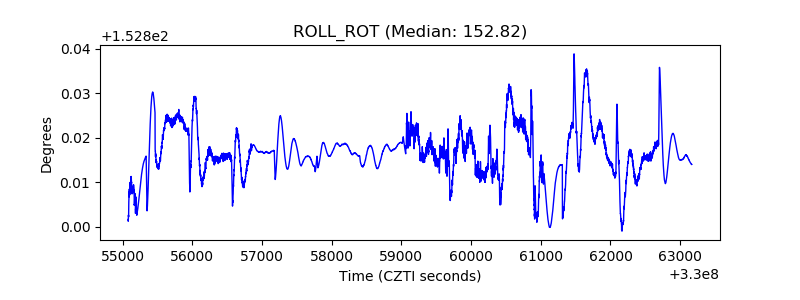 |
| _Roll_DEC | 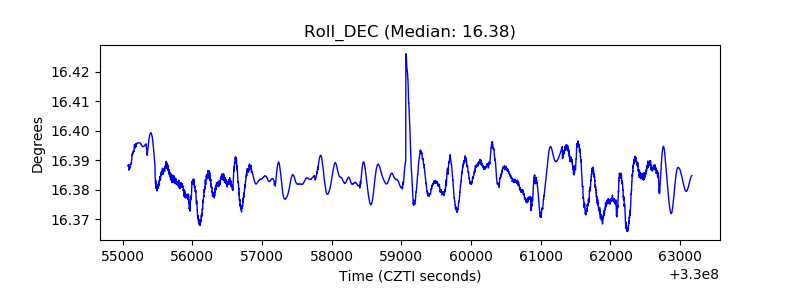 |
| _Roll_RA | 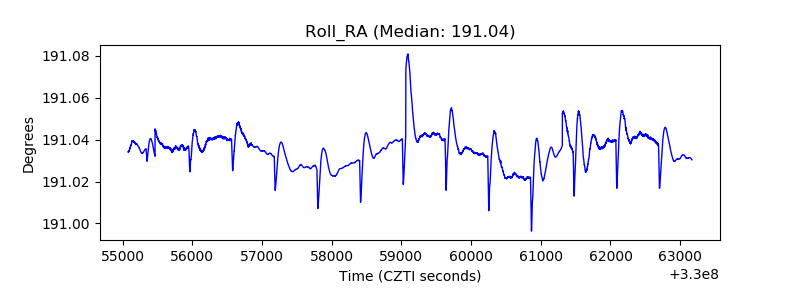 |
| Veto Counter | 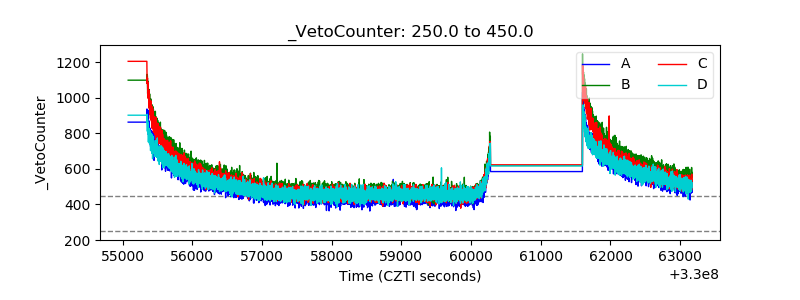 |