| Param | Original file | Final file |
|---|---|---|
| Filename | modeM0/AS1A07_147T01_9000003722_25519cztM0_level2.evt | modeM0/AS1A07_147T01_9000003722_25519cztM0_level2_quad_clean.evt |
| Size (bytes) | 496,535,040 | 68,742,720 |
| Size | 473.5 MB | 65.6 MB |
| Events in quadrant A | 3,553,173 | 424,369 |
| Events in quadrant B | 3,594,719 | 431,471 |
| Events in quadrant C | 3,500,493 | 397,711 |
| Events in quadrant D | 3,961,179 | 387,487 |
| Mode M0 | |||
|---|---|---|---|
| Quadrant | BADHDUFLAG | Total packets | Discarded packets |
| A | 0 | 14241 | 0 |
| B | 0 | 14450 | 0 |
| C | 0 | 14078 | 0 |
| D | 0 | 15601 | 0 |
| Mode M9 | |||
|---|---|---|---|
| Quadrant | BADHDUFLAG | Total packets | Discarded packets |
| A | 0 | 20 | 0 |
| B | 0 | 21 | 0 |
| C | 0 | 21 | 0 |
| D | 0 | 21 | 0 |
| Quadrant | Total seconds | Saturated seconds | Saturation percentage |
|---|---|---|---|
| A | 6310 | 84 | 1.331220% |
| B | 6310 | 109 | 1.727417% |
| C | 6310 | 134 | 2.123613% |
| D | 6310 | 132 | 2.091918% |
Noise dominated data is calculated using 1-second bins in cleaned event files. If a bin has >2000 counts, and if more than 50% of those come from <1% of pixels, then it is considered to be noise-dominated and hence unusable.
| Quadrant | # 1 sec bins | Bins with >0 counts | Bins with >2000 counts | High rate bins dominated by noise | Noise dominated (total time) | Noise dominated (detector-on time) | Marked lightcurve |
|---|---|---|---|---|---|---|---|
| A | 7631 | 6311 | 0 | 0 | 0.00% | 0.00% | 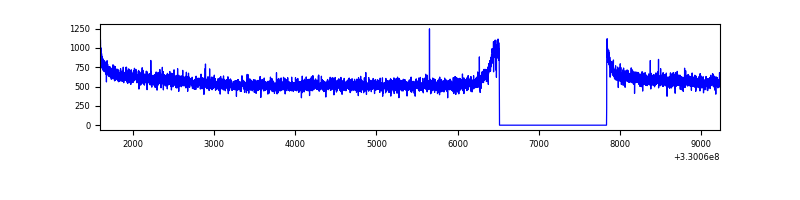 |
| B | 7631 | 6311 | 0 | 0 | 0.00% | 0.00% | 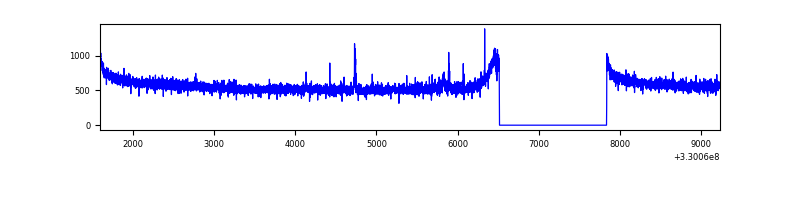 |
| C | 7631 | 6311 | 0 | 0 | 0.00% | 0.00% | 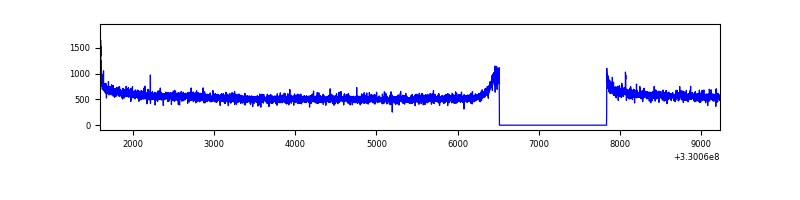 |
| D | 7631 | 6311 | 51 | 51 | 0.67% | 0.81% | 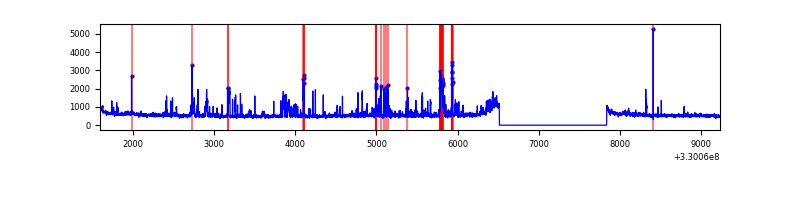 |
Top three noisy pixels from each quadrant. If the there are fewer than three noisy pixels in the level2.evt file, extra rows are filled as -1
| Pixel properties | Quadrant properties | ||||||
|---|---|---|---|---|---|---|---|
| Quadrant | DetID | PixID | Counts | Sigma | Mean | Median | Sigma |
| A | 13 | 254 | 9441 | 47.17 | 922 | 909 | 180.9 |
| A | 0 | 226 | 7980 | 39.1 | 922 | 909 | 180.9 |
| A | 3 | 137 | 7664 | 37.35 | 922 | 909 | 180.9 |
| B | 0 | 190 | 21240 | 120.17 | 913 | 895 | 169.3 |
| B | 12 | 111 | 20130 | 113.62 | 913 | 895 | 169.3 |
| B | 11 | 111 | 18144 | 101.88 | 913 | 895 | 169.3 |
| C | 14 | 238 | 141675 | 712.82 | 856 | 865 | 197.5 |
| C | 3 | 233 | 12580 | 59.3 | 856 | 865 | 197.5 |
| C | 0 | 10 | 9343 | 42.92 | 856 | 865 | 197.5 |
| D | 1 | 52 | 614828 | 2934.21 | 866 | 841 | 209.3 |
| D | 8 | 195 | 58780 | 276.89 | 866 | 841 | 209.3 |
| D | 2 | 234 | 23736 | 109.41 | 866 | 841 | 209.3 |
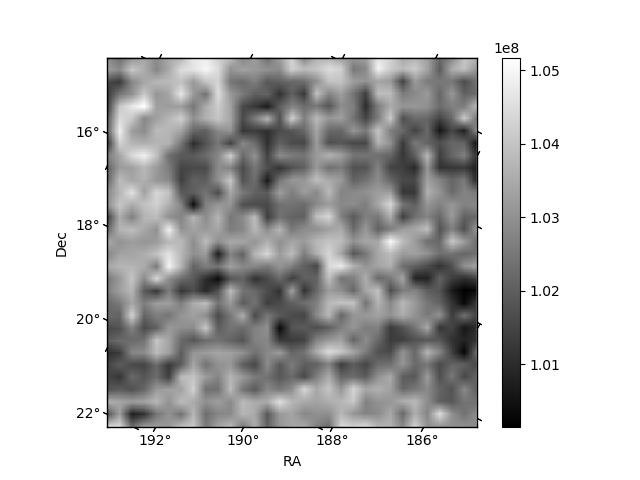
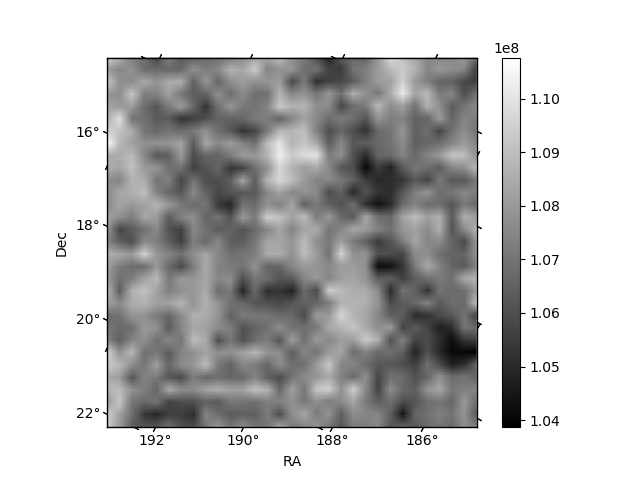
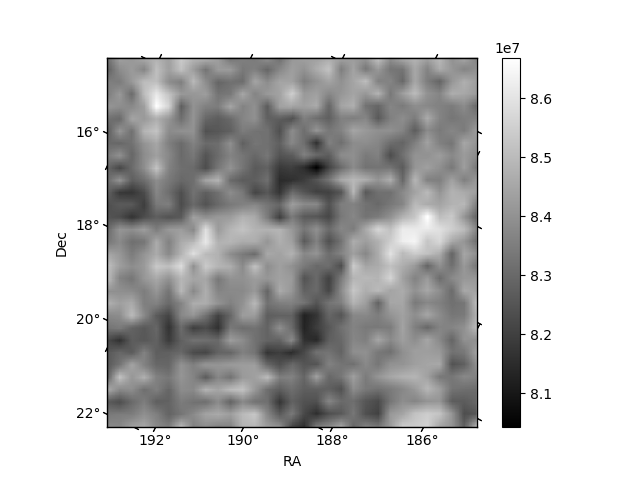
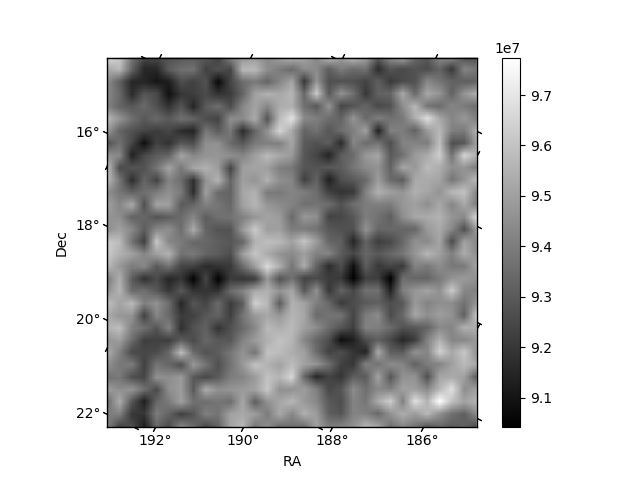
Histogram calculated using DETX and DETY for each event in the final _common_clean file
| Quadrant A | 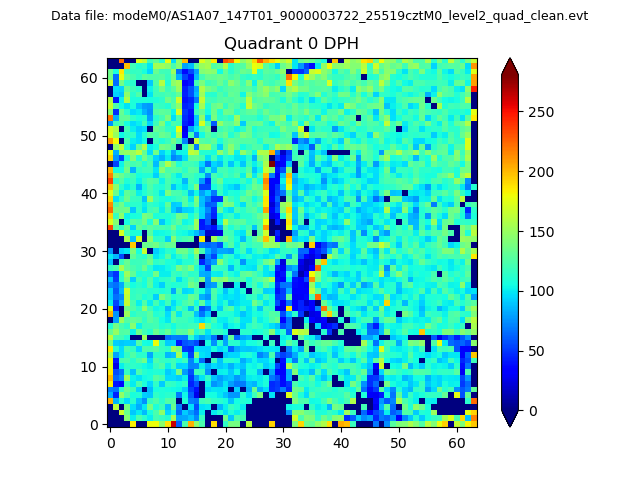 |
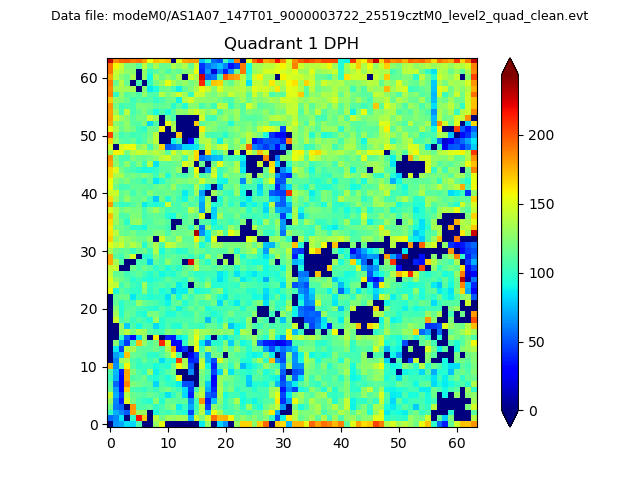 |
Quadrant B |
|---|---|---|---|
| Quadrant D | 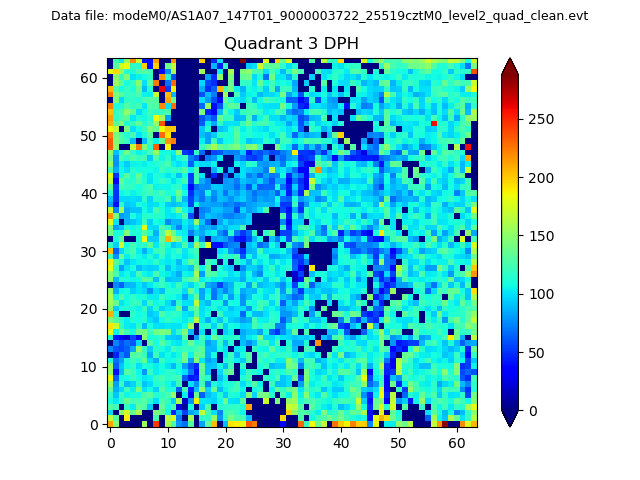 |
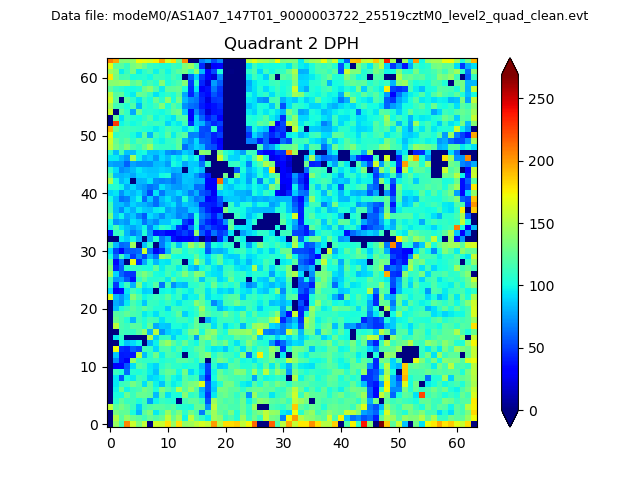 |
Quadrant C |
| Plot type | Count rate plots | Images |
|---|---|---|
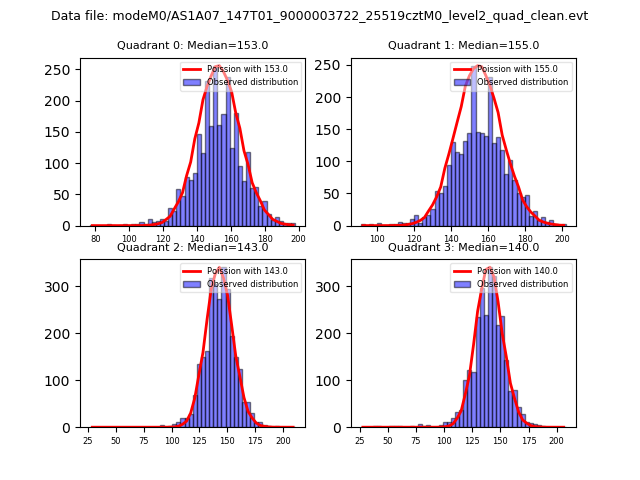
| Comparison with Poisson distribution Blue bars denote a histogram of data divided into 1 sec bins. Red curve is a Poisson curve with rate = median count rate of data. |
 |
 |
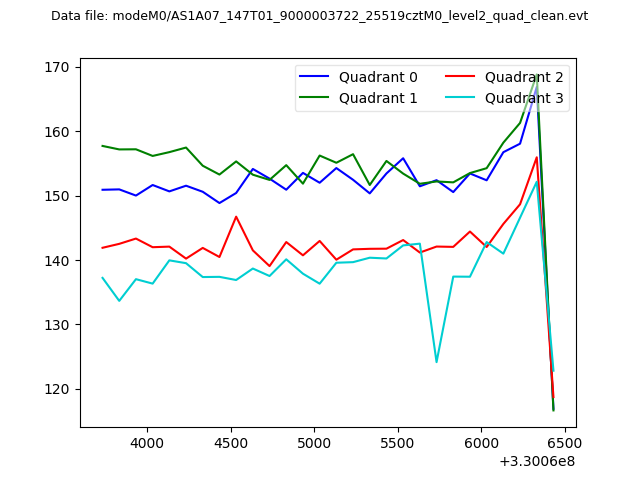
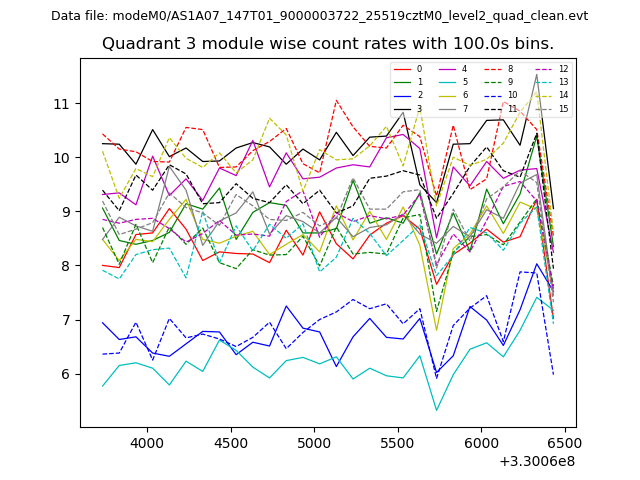
| Quadrant-wise count rates Data is divided into 100 sec bins |
 |
|
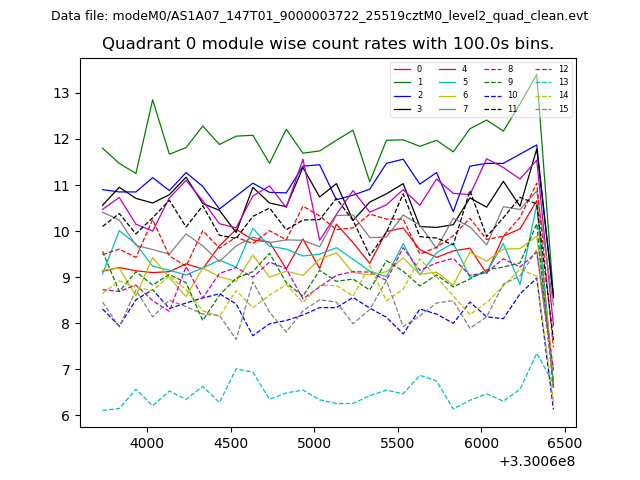
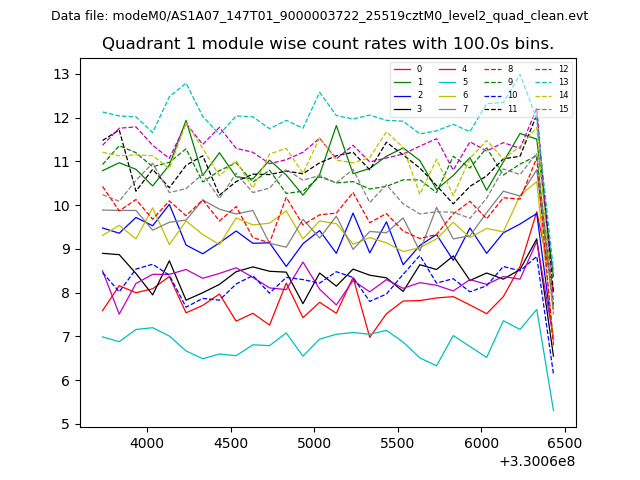
| Module-wise count rates for Quadrant A Data is divided into 100 sec bins |
 |
 |
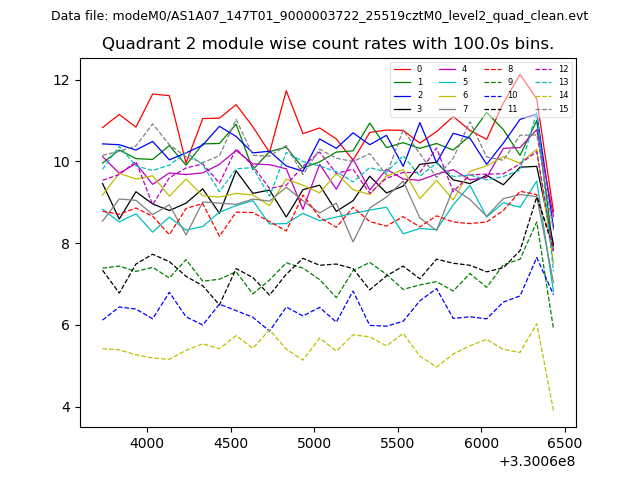
| Module-wise count rates for Quadrant B Data is divided into 100 sec bins |
 |
 |
| Module-wise count rates for Quadrant C Data is divided into 100 sec bins |
 |
 |
| Module-wise count rates for Quadrant D Data is divided into 100 sec bins |
 |
 |
| Parameter | Plot |
|---|---|
| CZT HV Monitor | 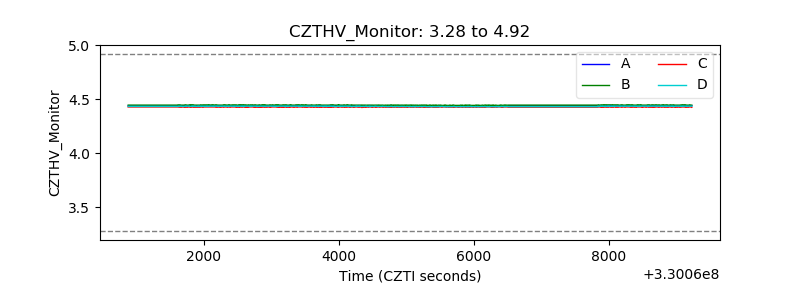 |
| D_VDD | 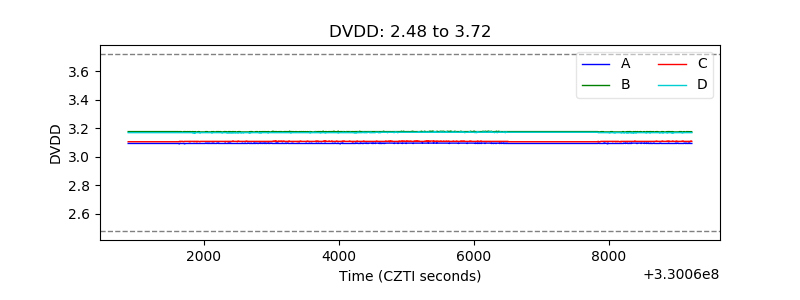 |
| Temperature 1 | 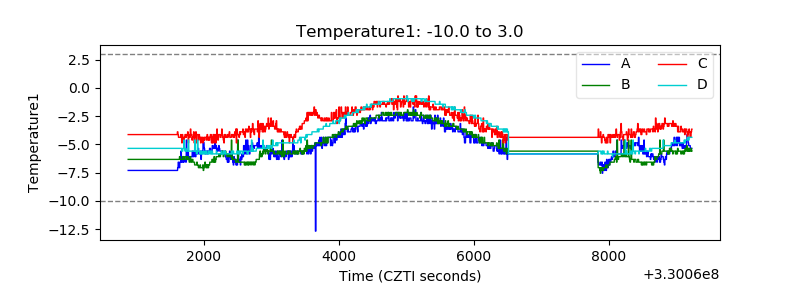 |
| Veto HV Monitor | 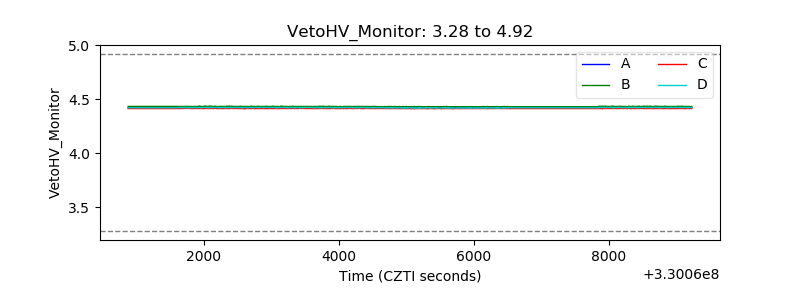 |
| Veto LLD | 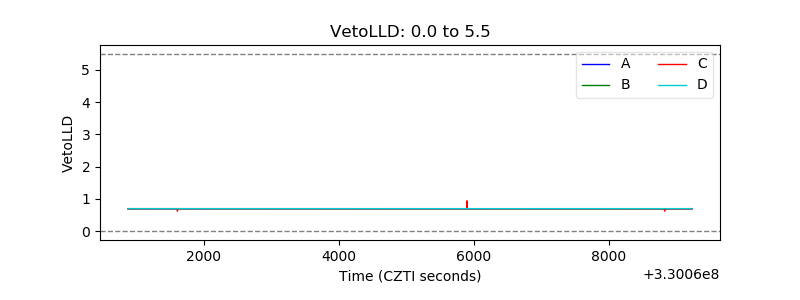 |
| Alpha Counter | 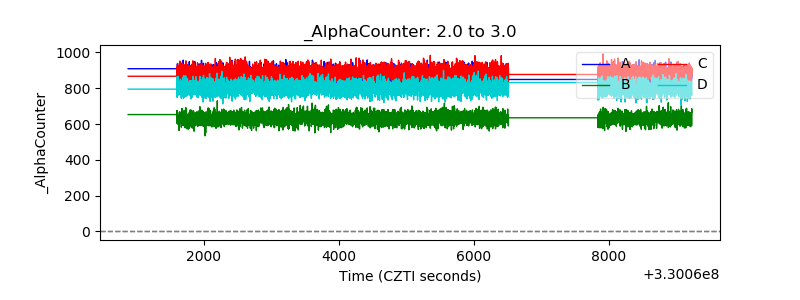 |
| _CPM_Rate | 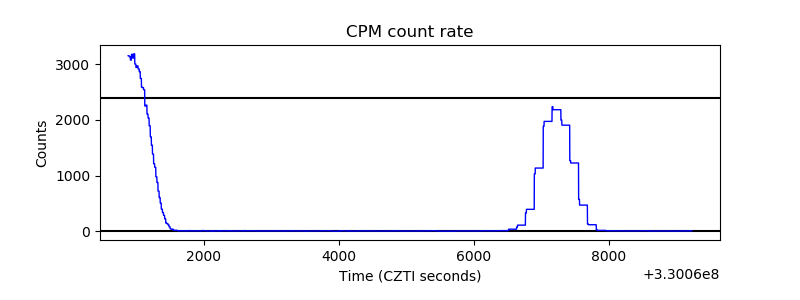 |
| CZT Counter | 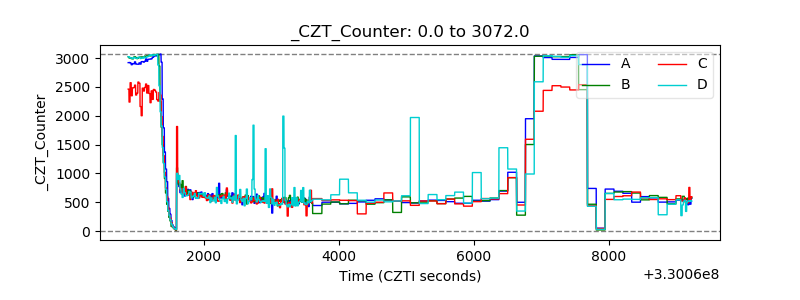 |
| +2.5 Volts monitor |  |
| +5 Volts monitor |  |
| _ROLL_ROT | 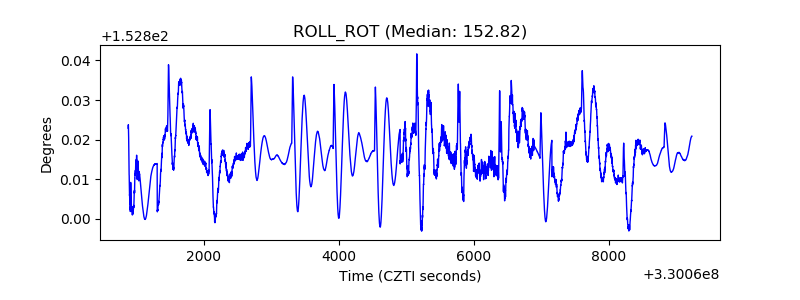 |
| _Roll_DEC | 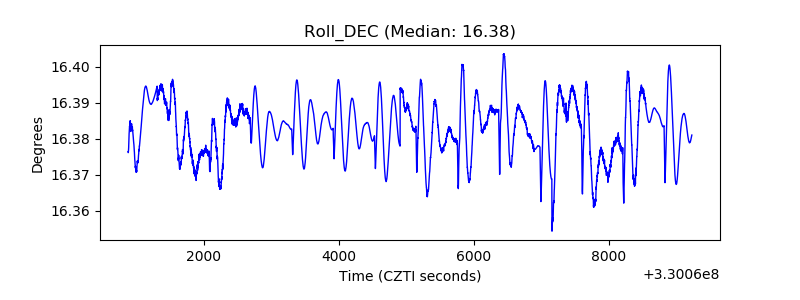 |
| _Roll_RA | 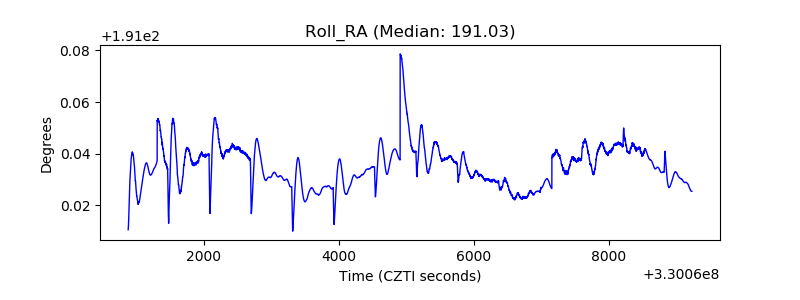 |
| Veto Counter | 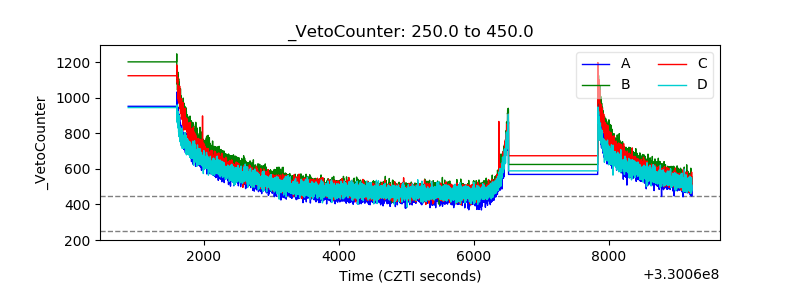 |