| Param | Original file | Final file |
|---|---|---|
| Filename | modeM0/AS1A07_147T01_9000003722_25520cztM0_level2.evt | modeM0/AS1A07_147T01_9000003722_25520cztM0_level2_quad_clean.evt |
| Size (bytes) | 492,491,520 | 77,578,560 |
| Size | 469.7 MB | 74.0 MB |
| Events in quadrant A | 3,517,936 | 496,031 |
| Events in quadrant B | 3,537,111 | 501,138 |
| Events in quadrant C | 3,479,817 | 462,054 |
| Events in quadrant D | 3,949,022 | 446,506 |
| Mode M0 | |||
|---|---|---|---|
| Quadrant | BADHDUFLAG | Total packets | Discarded packets |
| A | 0 | 14055 | 0 |
| B | 0 | 14147 | 0 |
| C | 0 | 13947 | 0 |
| D | 0 | 15515 | 0 |
| Mode M9 | |||
|---|---|---|---|
| Quadrant | BADHDUFLAG | Total packets | Discarded packets |
| A | 0 | 13 | 0 |
| B | 0 | 14 | 0 |
| C | 0 | 14 | 0 |
| D | 0 | 14 | 0 |
| Quadrant | Total seconds | Saturated seconds | Saturation percentage |
|---|---|---|---|
| A | 6348 | 132 | 2.079395% |
| B | 6348 | 167 | 2.630750% |
| C | 6348 | 170 | 2.678009% |
| D | 6348 | 234 | 3.686200% |
Noise dominated data is calculated using 1-second bins in cleaned event files. If a bin has >2000 counts, and if more than 50% of those come from <1% of pixels, then it is considered to be noise-dominated and hence unusable.
| Quadrant | # 1 sec bins | Bins with >0 counts | Bins with >2000 counts | High rate bins dominated by noise | Noise dominated (total time) | Noise dominated (detector-on time) | Marked lightcurve |
|---|---|---|---|---|---|---|---|
| A | 7598 | 6349 | 0 | 0 | 0.00% | 0.00% | 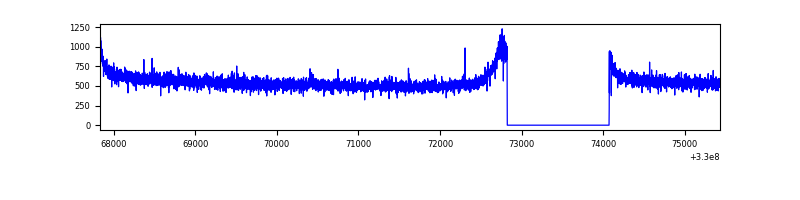 |
| B | 7598 | 6349 | 0 | 0 | 0.00% | 0.00% | 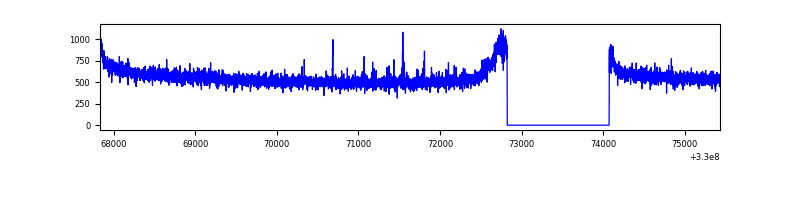 |
| C | 7598 | 6349 | 0 | 0 | 0.00% | 0.00% | 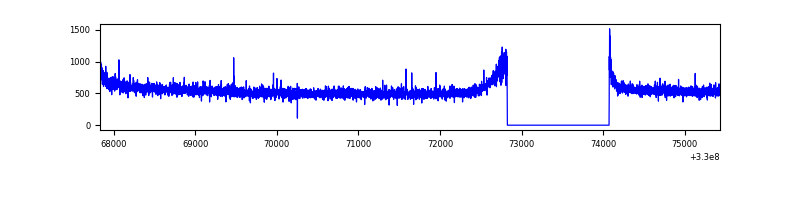 |
| D | 7598 | 6349 | 103 | 103 | 1.36% | 1.62% | 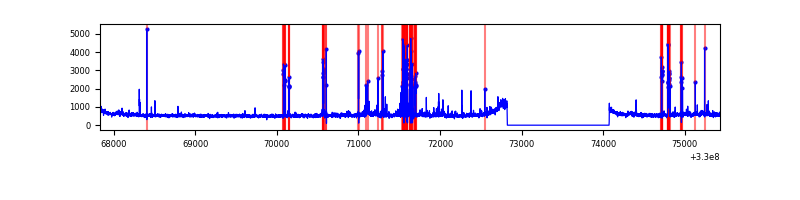 |
Top three noisy pixels from each quadrant. If the there are fewer than three noisy pixels in the level2.evt file, extra rows are filled as -1
| Pixel properties | Quadrant properties | ||||||
|---|---|---|---|---|---|---|---|
| Quadrant | DetID | PixID | Counts | Sigma | Mean | Median | Sigma |
| A | 13 | 254 | 9247 | 46.2 | 912 | 896 | 180.8 |
| A | 0 | 226 | 7868 | 38.57 | 912 | 896 | 180.8 |
| A | 3 | 137 | 7808 | 38.24 | 912 | 896 | 180.8 |
| B | 12 | 111 | 20167 | 113.37 | 901 | 881 | 170.1 |
| B | 11 | 111 | 18519 | 103.68 | 901 | 881 | 170.1 |
| B | 14 | 111 | 16913 | 94.24 | 901 | 881 | 170.1 |
| C | 14 | 238 | 138921 | 700.8 | 849 | 855 | 197.0 |
| C | 3 | 233 | 26860 | 132.0 | 849 | 855 | 197.0 |
| C | 13 | 61 | 5952 | 25.87 | 849 | 855 | 197.0 |
| D | 1 | 52 | 486585 | 2340.41 | 858 | 833 | 207.6 |
| D | 8 | 195 | 180241 | 864.41 | 858 | 833 | 207.6 |
| D | 2 | 120 | 29358 | 137.44 | 858 | 833 | 207.6 |
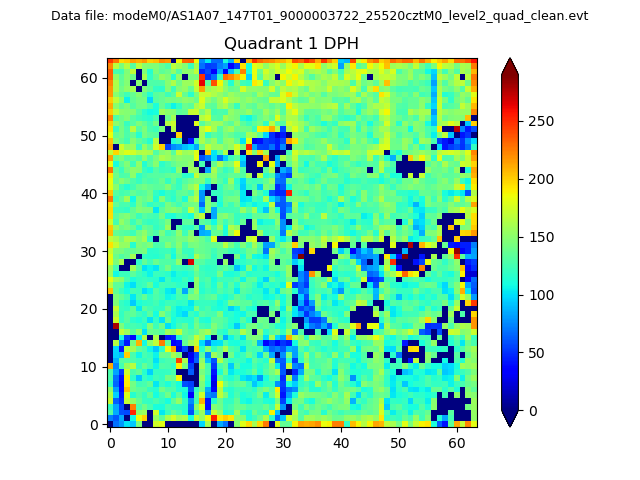
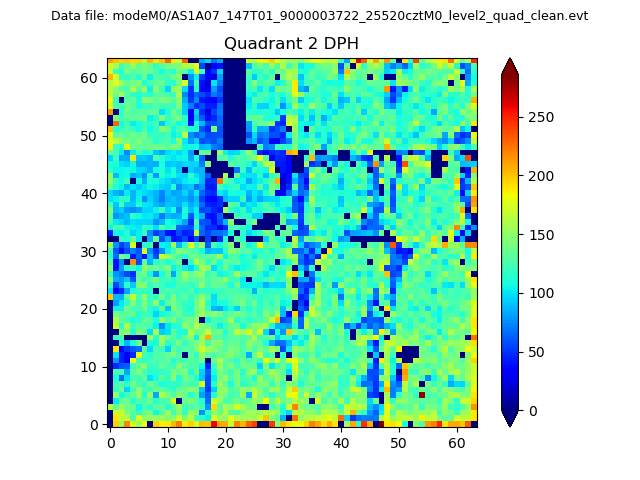
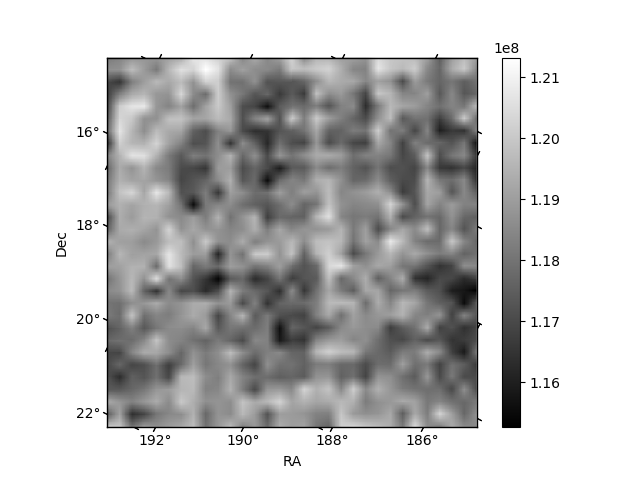
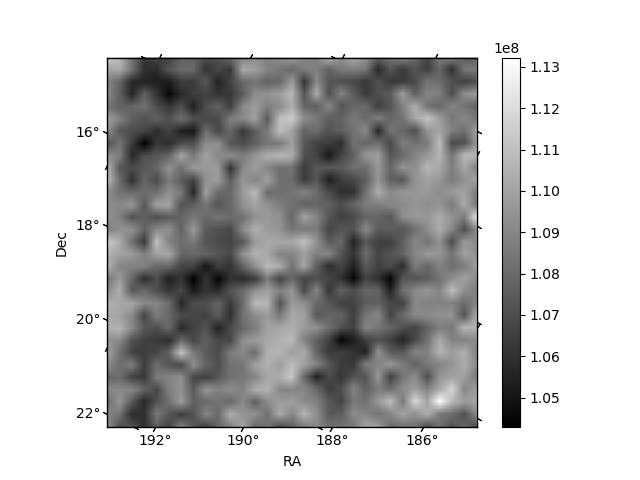
Histogram calculated using DETX and DETY for each event in the final _common_clean file
| Quadrant A |  |
 |
Quadrant B |
|---|---|---|---|
| Quadrant D |  |
 |
Quadrant C |
| Plot type | Count rate plots | Images |
|---|---|---|
| Comparison with Poisson distribution Blue bars denote a histogram of data divided into 1 sec bins. Red curve is a Poisson curve with rate = median count rate of data. |
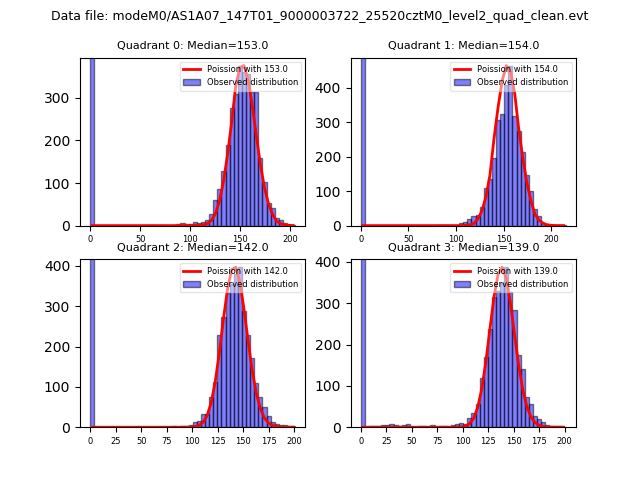 |
 |
| Quadrant-wise count rates Data is divided into 100 sec bins |
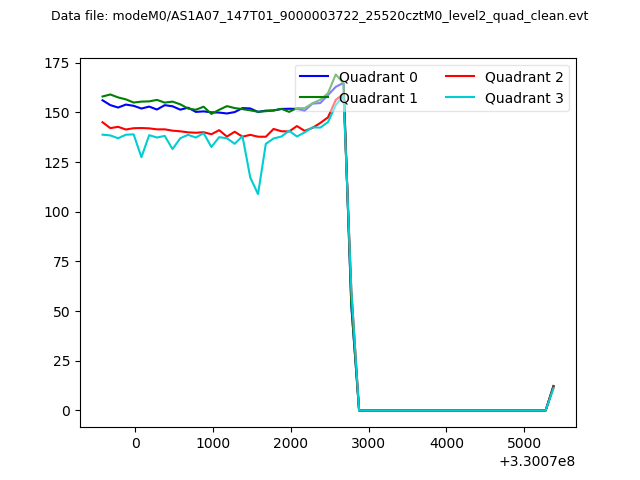 |
|
| Module-wise count rates for Quadrant A Data is divided into 100 sec bins |
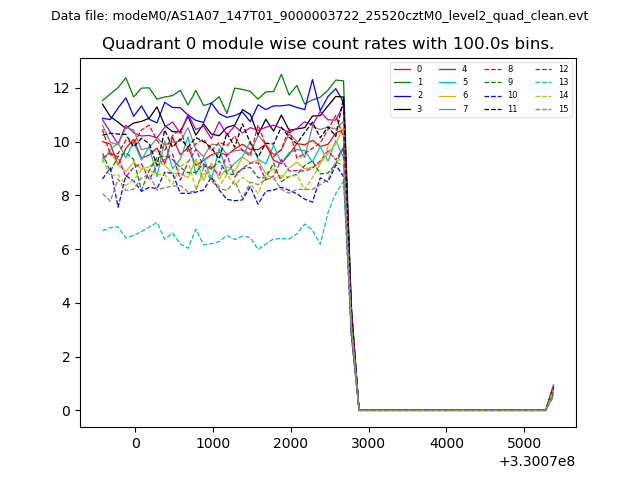 |
 |
| Module-wise count rates for Quadrant B Data is divided into 100 sec bins |
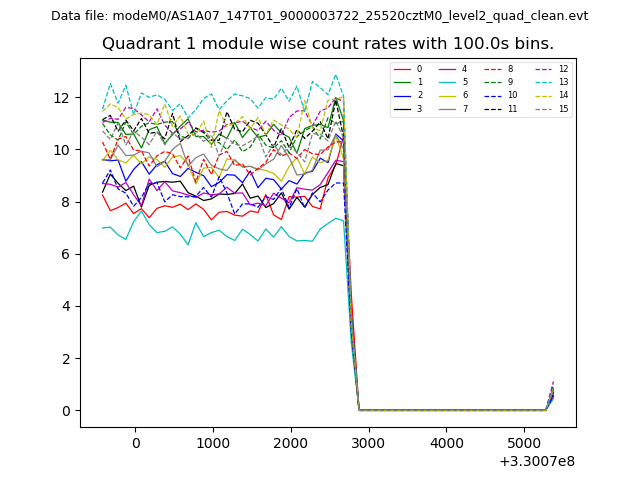 |
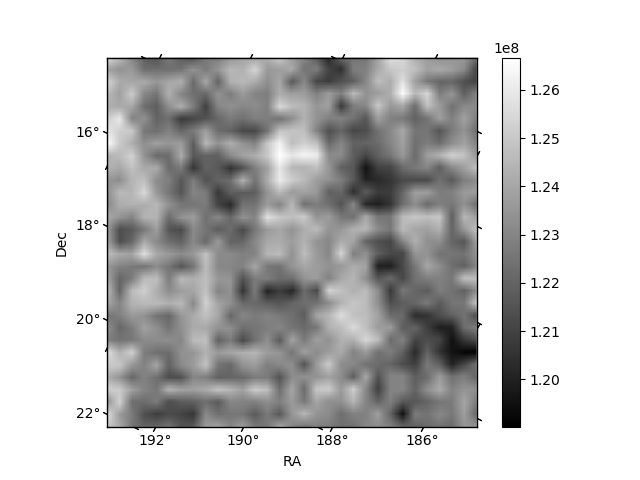 |
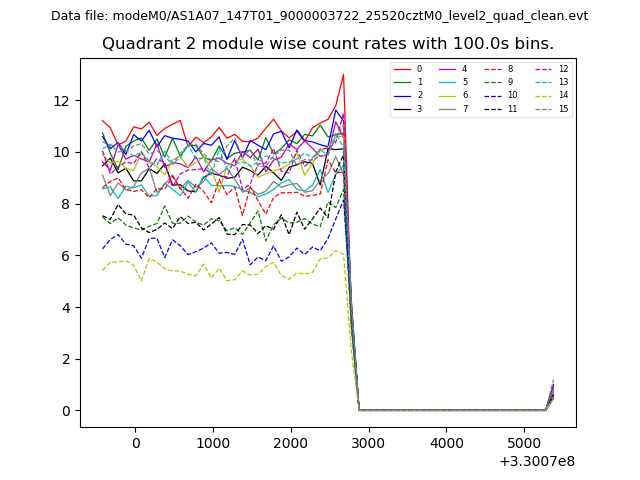
| Module-wise count rates for Quadrant C Data is divided into 100 sec bins |
 |
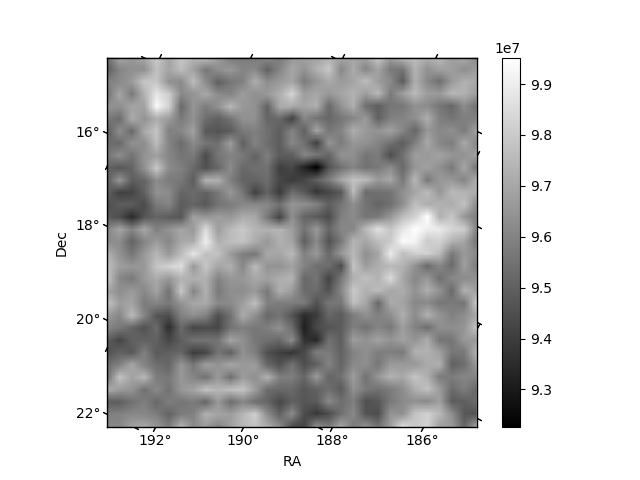 |
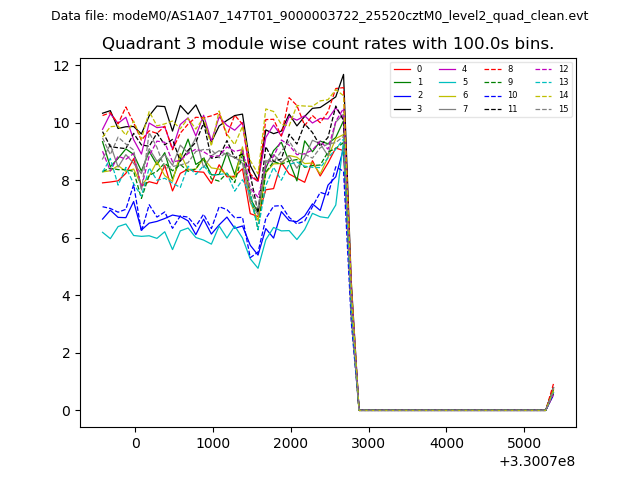
| Module-wise count rates for Quadrant D Data is divided into 100 sec bins |
 |
 |
| Parameter | Plot |
|---|---|
| CZT HV Monitor |  |
| D_VDD | 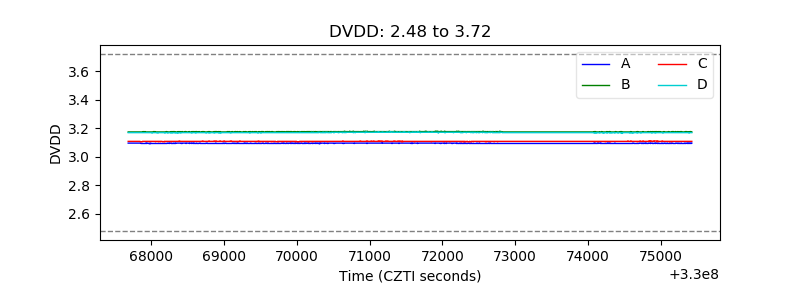 |
| Temperature 1 | 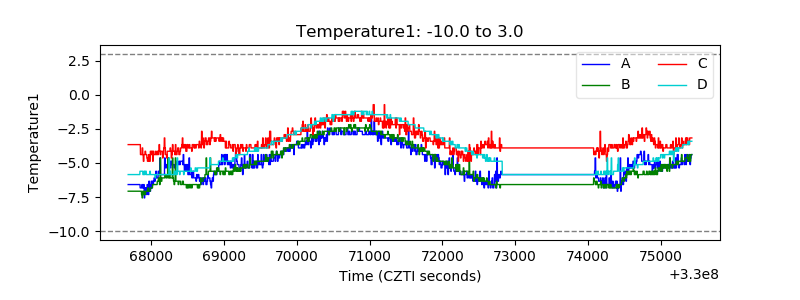 |
| Veto HV Monitor | 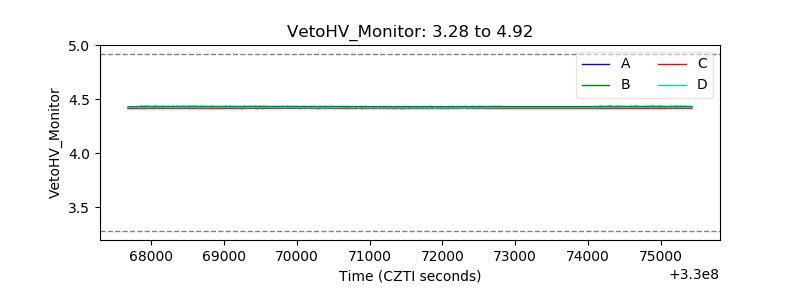 |
| Veto LLD | 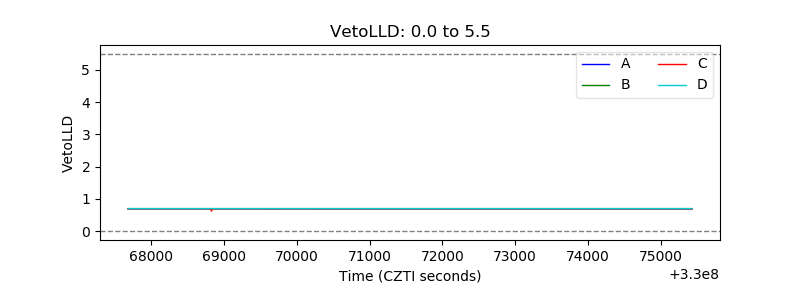 |
| Alpha Counter | 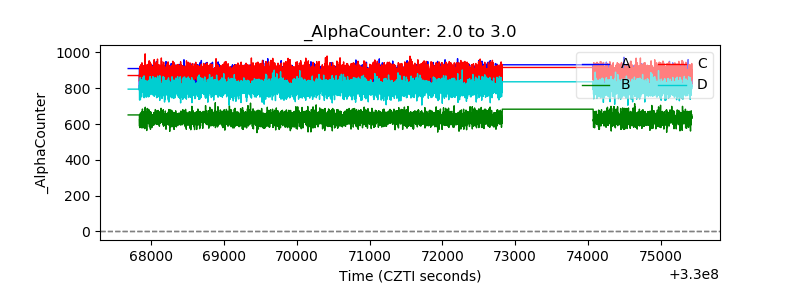 |
| _CPM_Rate | 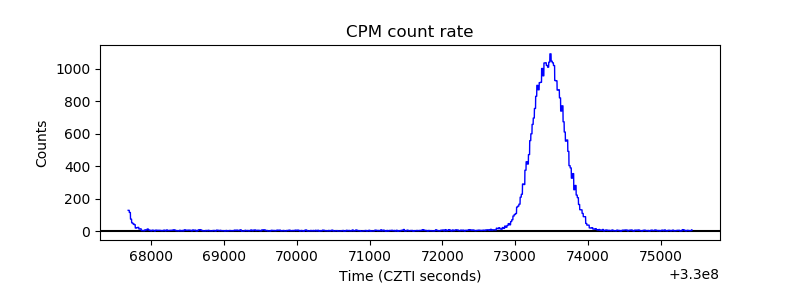 |
| CZT Counter | 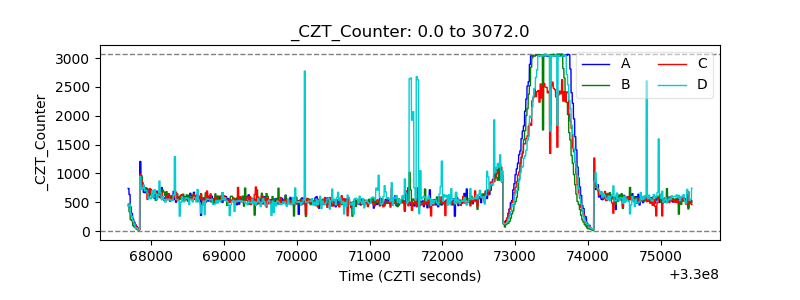 |
| +2.5 Volts monitor |  |
| +5 Volts monitor | 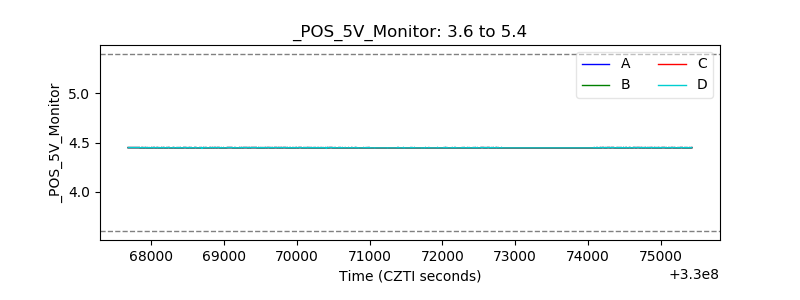 |
| _ROLL_ROT | 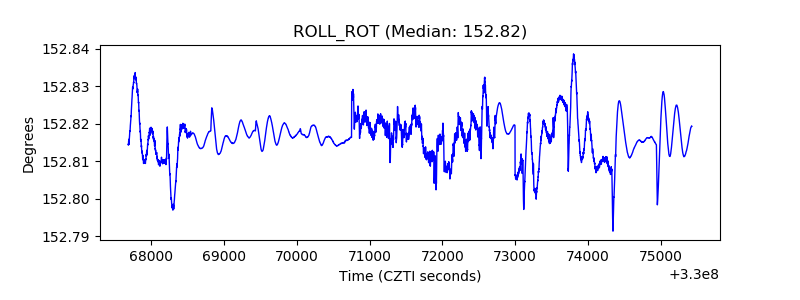 |
| _Roll_DEC | 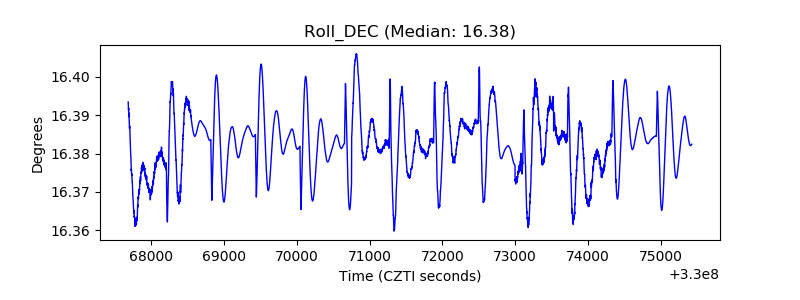 |
| _Roll_RA | 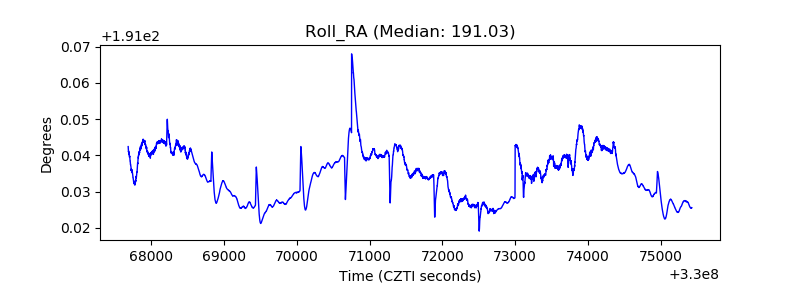 |
| Veto Counter | 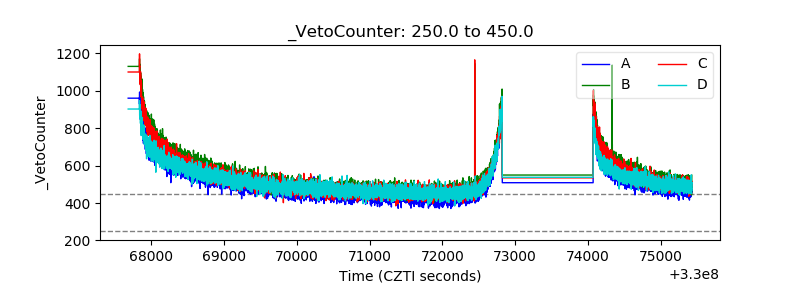 |