| Param | Original file | Final file |
|---|---|---|
| Filename | modeM0/AS1A07_147T01_9000003722_25521cztM0_level2.evt | modeM0/AS1A07_147T01_9000003722_25521cztM0_level2_quad_clean.evt |
| Size (bytes) | 489,096,000 | 89,219,520 |
| Size | 466.4 MB | 85.1 MB |
| Events in quadrant A | 3,444,370 | 580,387 |
| Events in quadrant B | 3,458,298 | 585,967 |
| Events in quadrant C | 3,428,137 | 543,860 |
| Events in quadrant D | 4,036,734 | 534,949 |
| Mode M0 | |||
|---|---|---|---|
| Quadrant | BADHDUFLAG | Total packets | Discarded packets |
| A | 0 | 13908 | 0 |
| B | 0 | 13932 | 0 |
| C | 0 | 13869 | 0 |
| D | 0 | 15958 | 0 |
| Mode M9 | |||
|---|---|---|---|
| Quadrant | BADHDUFLAG | Total packets | Discarded packets |
| A | 0 | 17 | 0 |
| B | 0 | 18 | 0 |
| C | 0 | 18 | 0 |
| D | 0 | 18 | 0 |
| Quadrant | Total seconds | Saturated seconds | Saturation percentage |
|---|---|---|---|
| A | 6551 | 134 | 2.045489% |
| B | 6551 | 157 | 2.396581% |
| C | 6551 | 160 | 2.442375% |
| D | 6551 | 180 | 2.747672% |
Noise dominated data is calculated using 1-second bins in cleaned event files. If a bin has >2000 counts, and if more than 50% of those come from <1% of pixels, then it is considered to be noise-dominated and hence unusable.
| Quadrant | # 1 sec bins | Bins with >0 counts | Bins with >2000 counts | High rate bins dominated by noise | Noise dominated (total time) | Noise dominated (detector-on time) | Marked lightcurve |
|---|---|---|---|---|---|---|---|
| A | 7601 | 6552 | 0 | 0 | 0.00% | 0.00% | 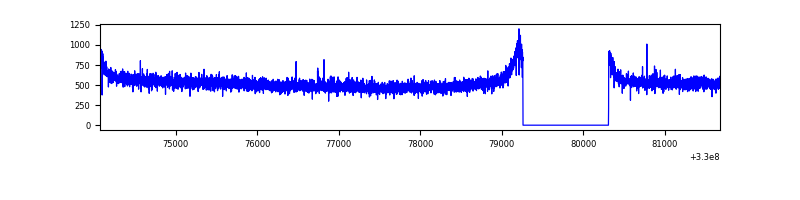 |
| B | 7601 | 6552 | 0 | 0 | 0.00% | 0.00% | 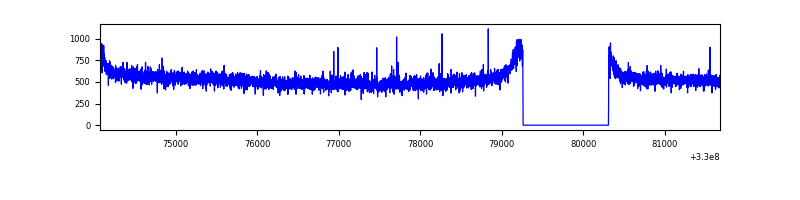 |
| C | 7601 | 6552 | 0 | 0 | 0.00% | 0.00% | 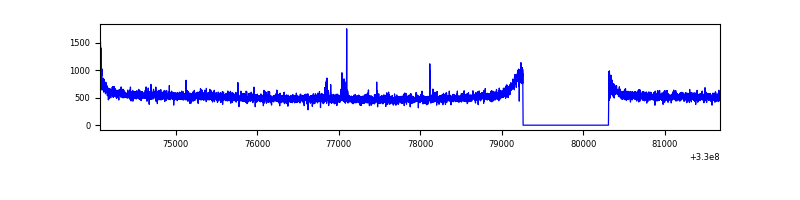 |
| D | 7601 | 6552 | 76 | 76 | 1.00% | 1.16% | 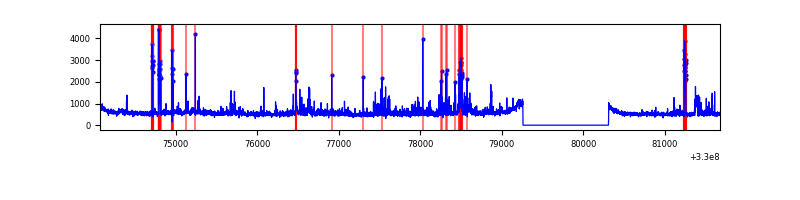 |
Top three noisy pixels from each quadrant. If the there are fewer than three noisy pixels in the level2.evt file, extra rows are filled as -1
| Pixel properties | Quadrant properties | ||||||
|---|---|---|---|---|---|---|---|
| Quadrant | DetID | PixID | Counts | Sigma | Mean | Median | Sigma |
| A | 13 | 254 | 9815 | 49.84 | 894 | 877 | 179.3 |
| A | 3 | 137 | 7996 | 39.7 | 894 | 877 | 179.3 |
| A | 0 | 226 | 7640 | 37.72 | 894 | 877 | 179.3 |
| B | 12 | 111 | 20238 | 114.87 | 880 | 857 | 168.7 |
| B | 11 | 111 | 18495 | 104.54 | 880 | 857 | 168.7 |
| B | 14 | 111 | 17102 | 96.28 | 880 | 857 | 168.7 |
| C | 14 | 238 | 133605 | 683.38 | 837 | 846 | 194.3 |
| C | 2 | 16 | 19091 | 93.92 | 837 | 846 | 194.3 |
| C | 3 | 233 | 10390 | 49.13 | 837 | 846 | 194.3 |
| D | 1 | 52 | 421437 | 2044.06 | 851 | 826 | 205.8 |
| D | 8 | 195 | 276545 | 1339.92 | 851 | 826 | 205.8 |
| D | 2 | 82 | 114861 | 554.18 | 851 | 826 | 205.8 |
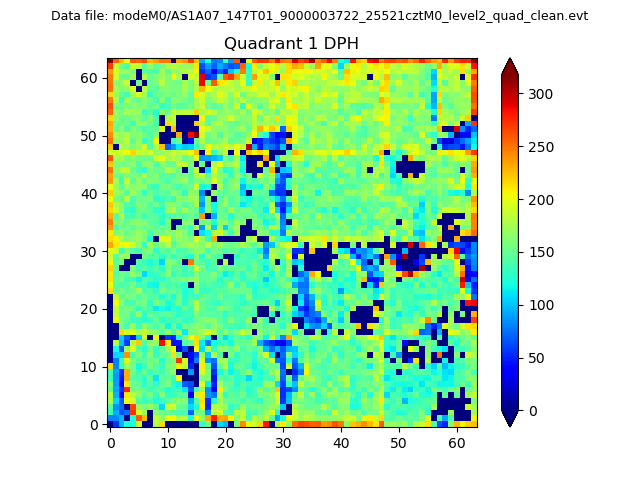
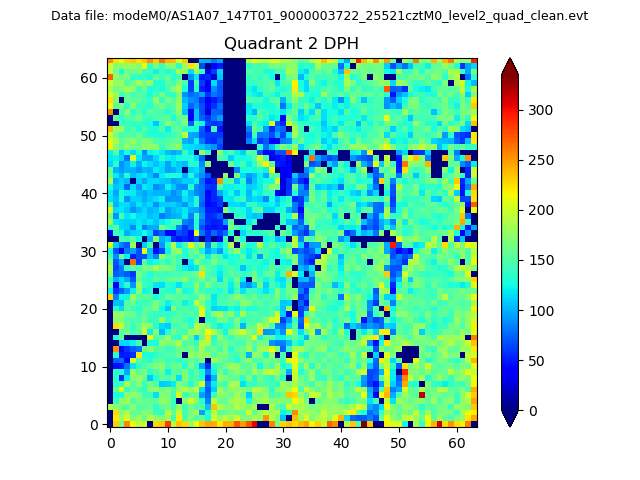
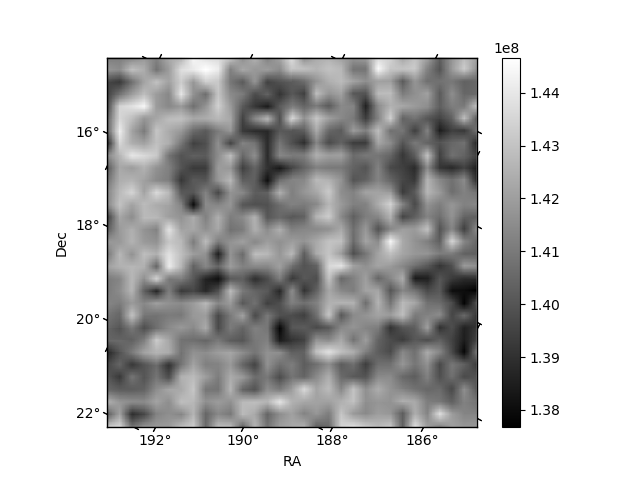
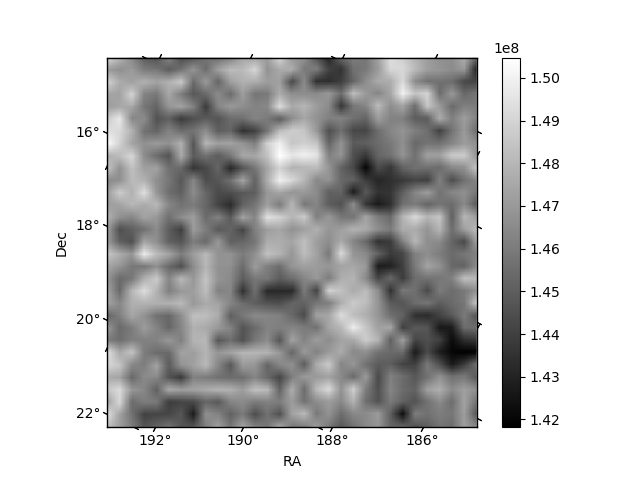
Histogram calculated using DETX and DETY for each event in the final _common_clean file
| Quadrant A |  |
 |
Quadrant B |
|---|---|---|---|
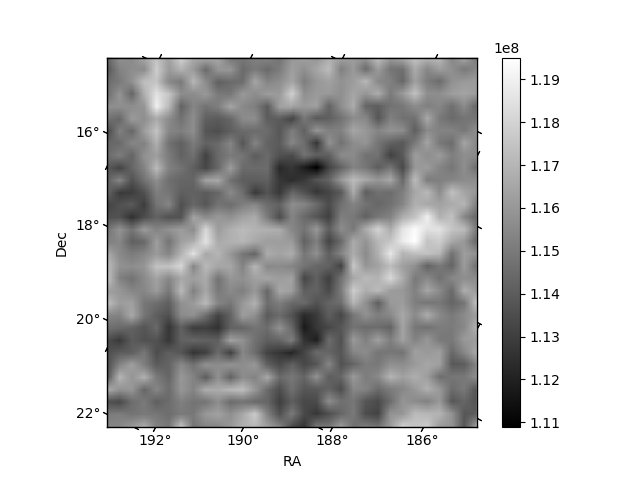
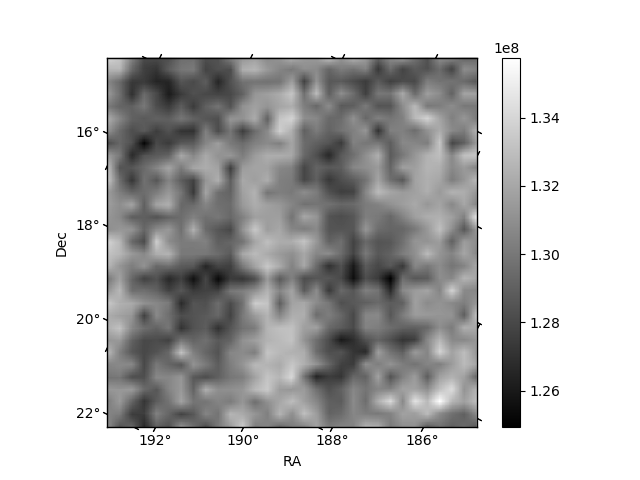
| Quadrant D |  |
 |
Quadrant C |
| Plot type | Count rate plots | Images |
|---|---|---|
| Comparison with Poisson distribution Blue bars denote a histogram of data divided into 1 sec bins. Red curve is a Poisson curve with rate = median count rate of data. |
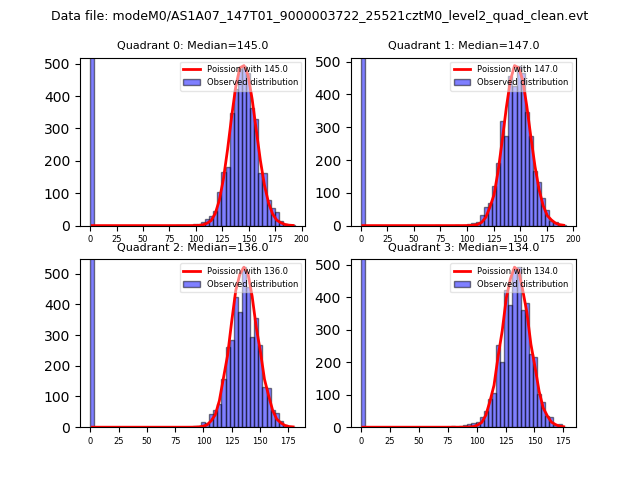 |
 |
| Quadrant-wise count rates Data is divided into 100 sec bins |
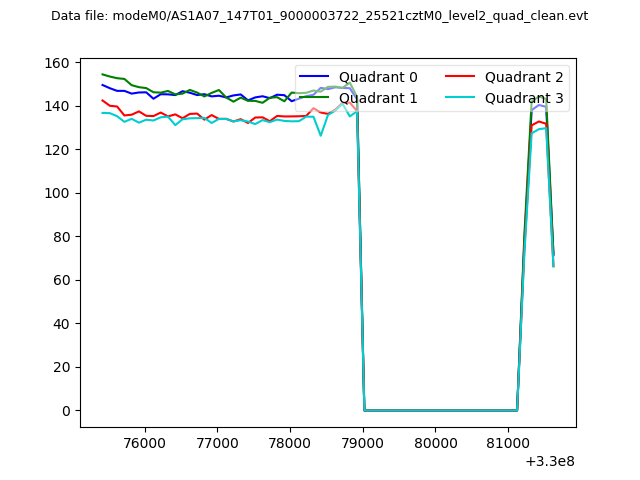 |
|
| Module-wise count rates for Quadrant A Data is divided into 100 sec bins |
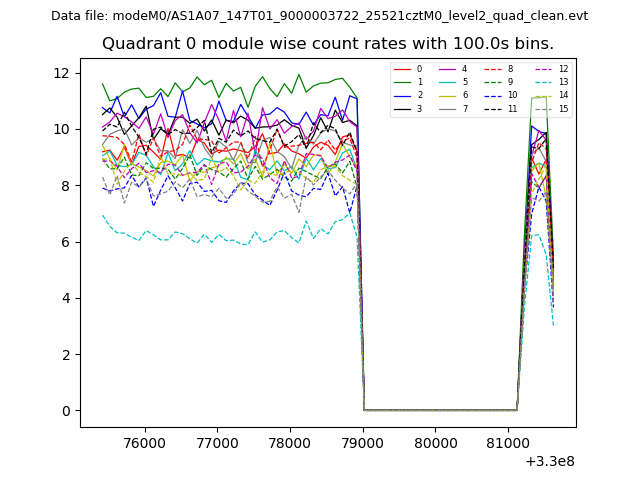 |
 |
| Module-wise count rates for Quadrant B Data is divided into 100 sec bins |
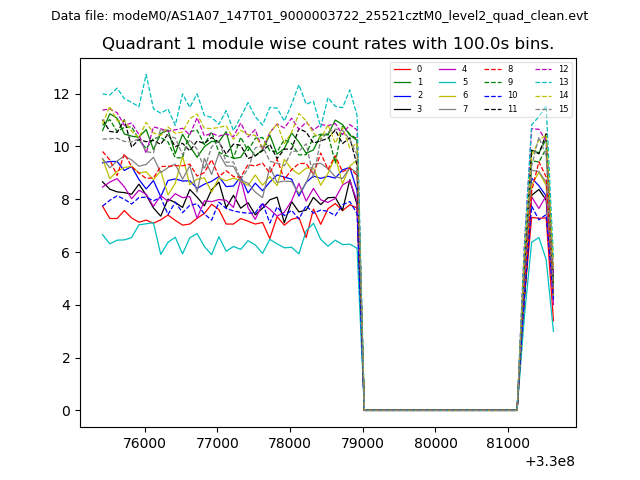 |
 |
| Module-wise count rates for Quadrant C Data is divided into 100 sec bins |
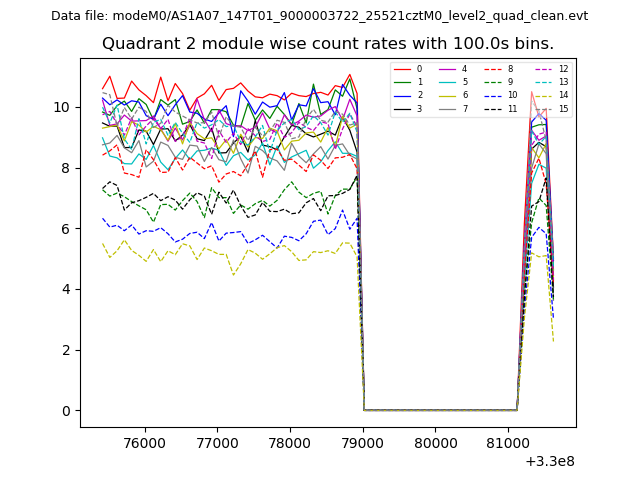 |
 |
| Module-wise count rates for Quadrant D Data is divided into 100 sec bins |
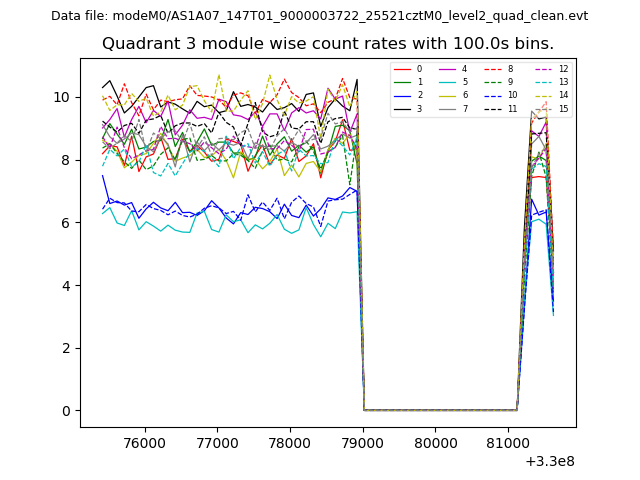 |
 |
| Parameter | Plot |
|---|---|
| CZT HV Monitor | 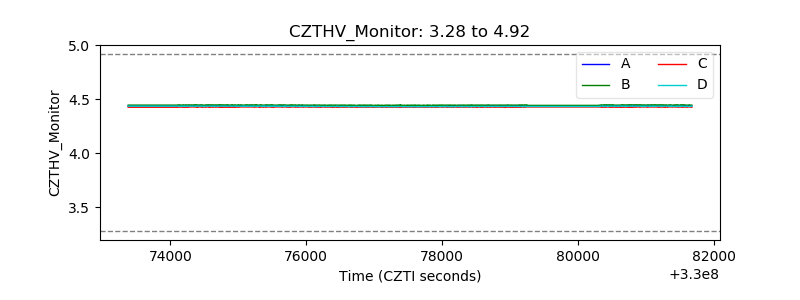 |
| D_VDD | 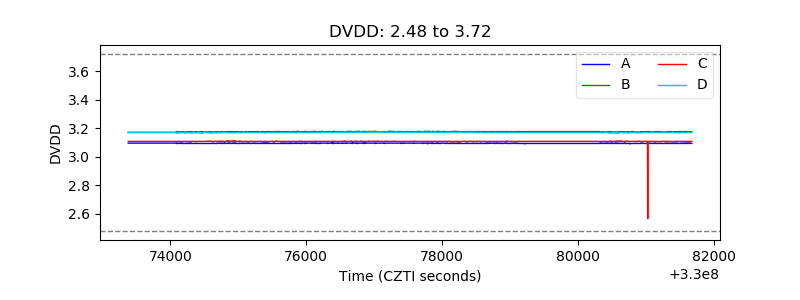 |
| Temperature 1 | 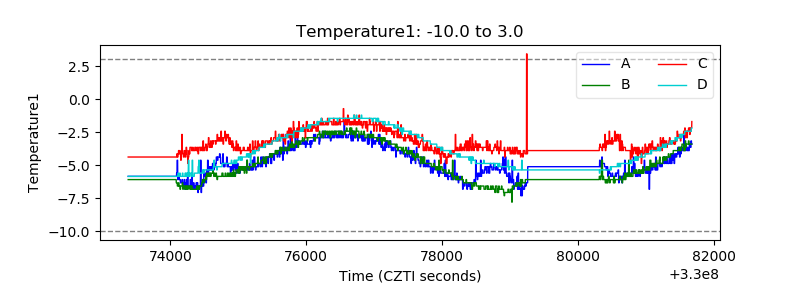 |
| Veto HV Monitor | 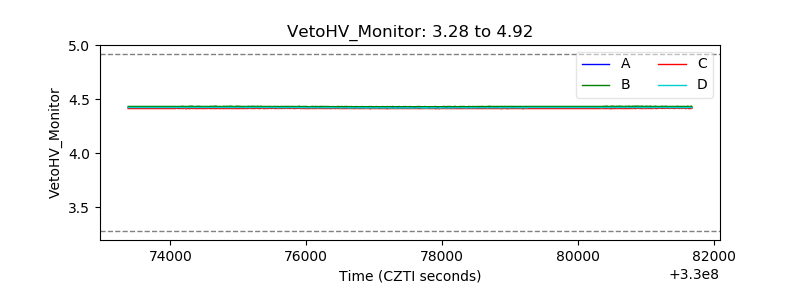 |
| Veto LLD | 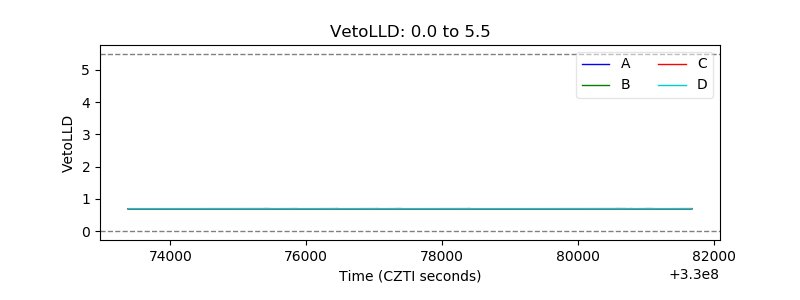 |
| Alpha Counter | 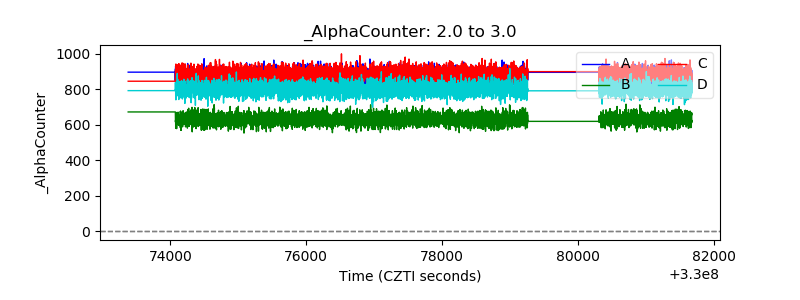 |
| _CPM_Rate | 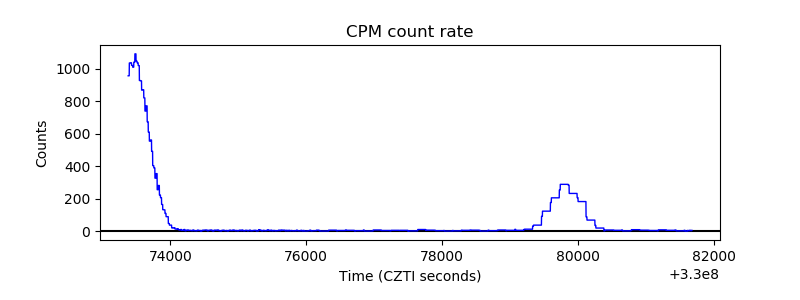 |
| CZT Counter |  |
| +2.5 Volts monitor |  |
| +5 Volts monitor | 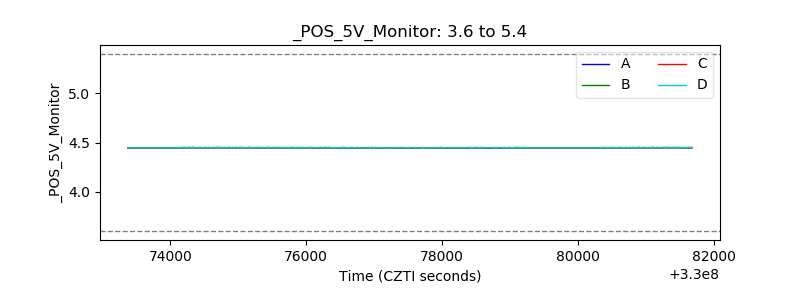 |
| _ROLL_ROT | 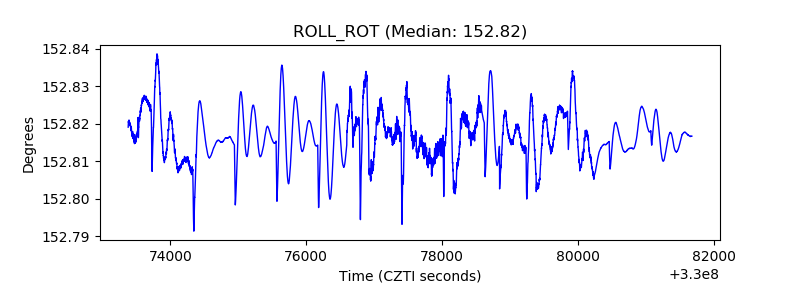 |
| _Roll_DEC | 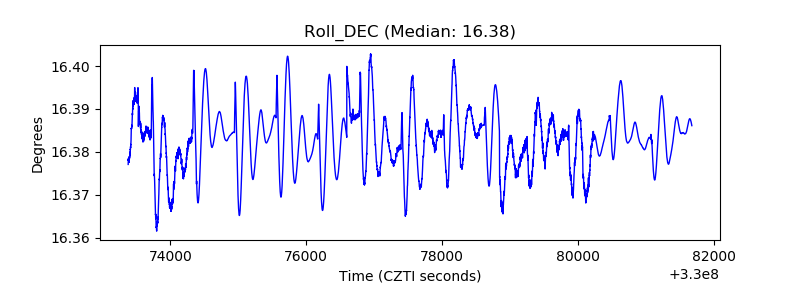 |
| _Roll_RA |  |
| Veto Counter | 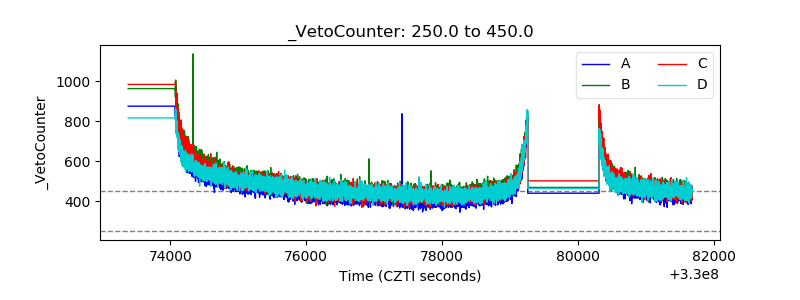 |