| Param | Original file | Final file |
|---|---|---|
| Filename | modeM0/AS1A07_147T01_9000003722_25522cztM0_level2.evt | modeM0/AS1A07_147T01_9000003722_25522cztM0_level2_quad_clean.evt |
| Size (bytes) | 497,931,840 | 97,706,880 |
| Size | 474.9 MB | 93.2 MB |
| Events in quadrant A | 3,416,416 | 638,960 |
| Events in quadrant B | 3,443,971 | 644,636 |
| Events in quadrant C | 3,401,000 | 602,977 |
| Events in quadrant D | 4,349,977 | 591,927 |
| Mode M0 | |||
|---|---|---|---|
| Quadrant | BADHDUFLAG | Total packets | Discarded packets |
| A | 0 | 14222 | 0 |
| B | 0 | 14287 | 0 |
| C | 0 | 14194 | 0 |
| D | 0 | 17160 | 0 |
| Mode M9 | |||
|---|---|---|---|
| Quadrant | BADHDUFLAG | Total packets | Discarded packets |
| A | 0 | 7 | 0 |
| B | 0 | 7 | 0 |
| C | 0 | 7 | 0 |
| D | 0 | 7 | 0 |
| Quadrant | Total seconds | Saturated seconds | Saturation percentage |
|---|---|---|---|
| A | 6895 | 145 | 2.102973% |
| B | 6895 | 173 | 2.509065% |
| C | 6896 | 186 | 2.697216% |
| D | 6896 | 305 | 4.422854% |
Noise dominated data is calculated using 1-second bins in cleaned event files. If a bin has >2000 counts, and if more than 50% of those come from <1% of pixels, then it is considered to be noise-dominated and hence unusable.
| Quadrant | # 1 sec bins | Bins with >0 counts | Bins with >2000 counts | High rate bins dominated by noise | Noise dominated (total time) | Noise dominated (detector-on time) | Marked lightcurve |
|---|---|---|---|---|---|---|---|
| A | 7555 | 6896 | 0 | 0 | 0.00% | 0.00% | 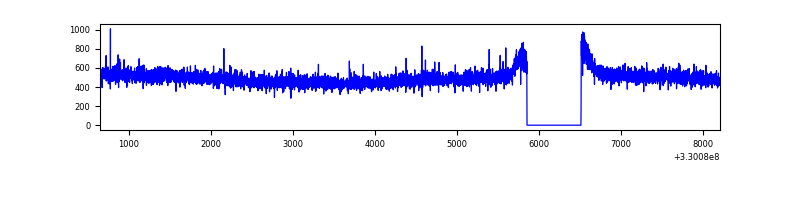 |
| B | 7555 | 6896 | 0 | 0 | 0.00% | 0.00% | 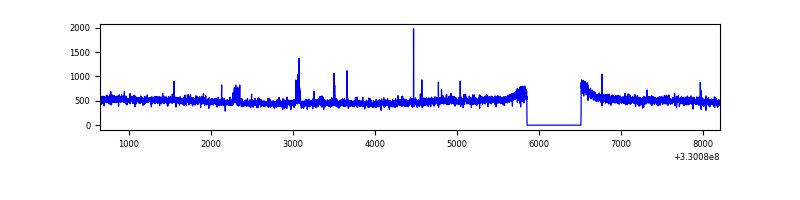 |
| C | 7556 | 6897 | 0 | 0 | 0.00% | 0.00% | 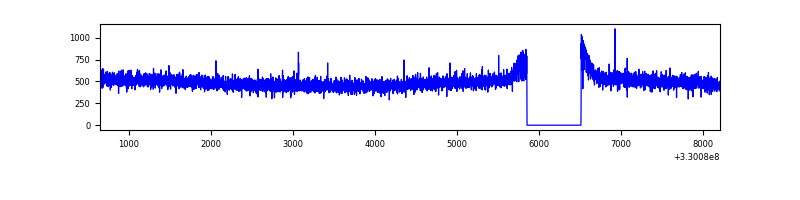 |
| D | 7556 | 6897 | 118 | 118 | 1.56% | 1.71% | 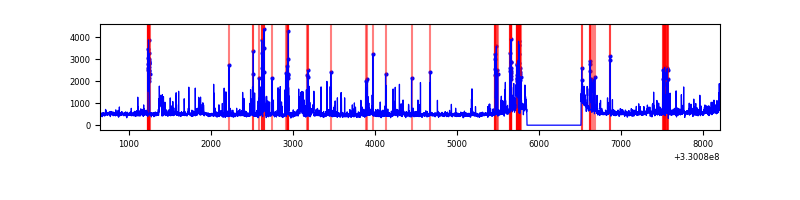 |
Top three noisy pixels from each quadrant. If the there are fewer than three noisy pixels in the level2.evt file, extra rows are filled as -1
| Pixel properties | Quadrant properties | ||||||
|---|---|---|---|---|---|---|---|
| Quadrant | DetID | PixID | Counts | Sigma | Mean | Median | Sigma |
| A | 13 | 254 | 9609 | 48.96 | 885 | 867 | 178.6 |
| A | 3 | 137 | 8211 | 41.13 | 885 | 867 | 178.6 |
| A | 0 | 226 | 7527 | 37.3 | 885 | 867 | 178.6 |
| B | 12 | 111 | 20503 | 118.05 | 871 | 852 | 166.5 |
| B | 11 | 111 | 18955 | 108.75 | 871 | 852 | 166.5 |
| B | 0 | 190 | 18748 | 107.51 | 871 | 852 | 166.5 |
| C | 14 | 238 | 134108 | 688.16 | 835 | 839 | 193.7 |
| C | 3 | 233 | 6790 | 30.73 | 835 | 839 | 193.7 |
| C | 13 | 61 | 5684 | 25.02 | 835 | 839 | 193.7 |
| D | 1 | 52 | 840951 | 4146.13 | 840 | 818 | 202.6 |
| D | 8 | 195 | 242380 | 1192.13 | 840 | 818 | 202.6 |
| D | 13 | 104 | 51098 | 248.14 | 840 | 818 | 202.6 |
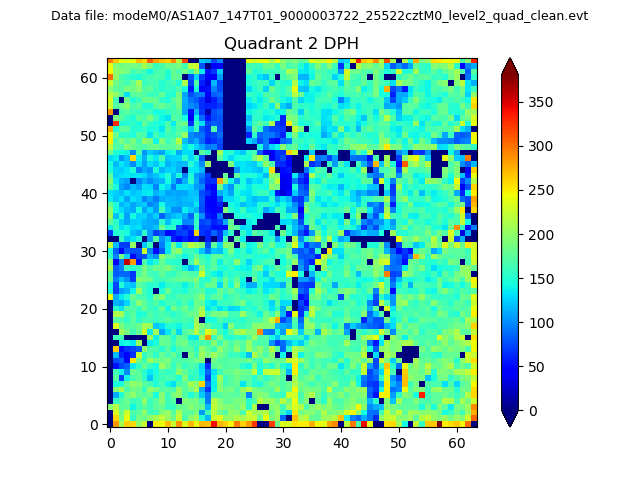
Histogram calculated using DETX and DETY for each event in the final _common_clean file
| Quadrant A | 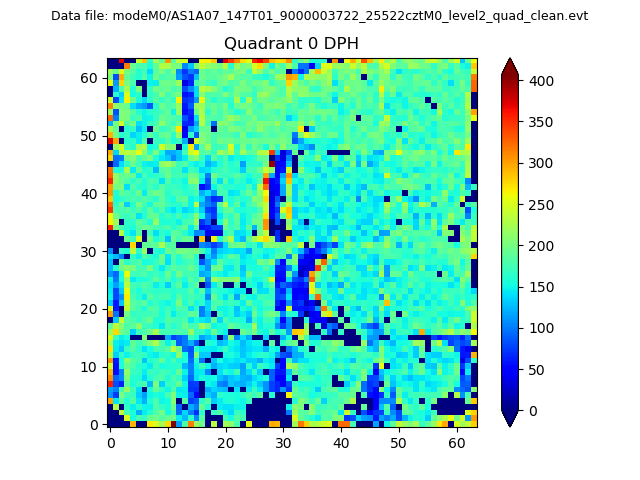 |
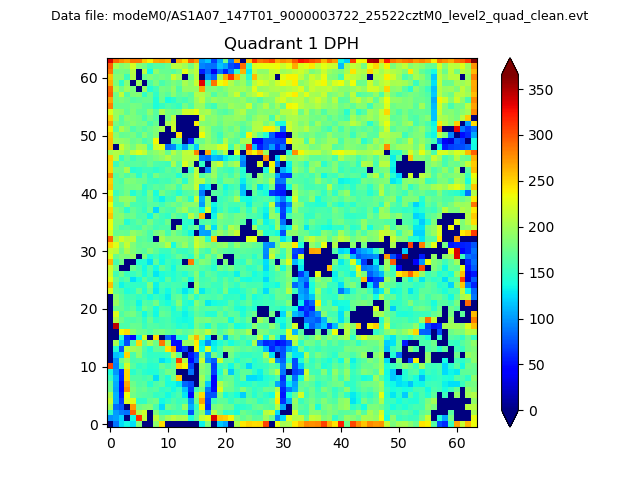 |
Quadrant B |
|---|---|---|---|
| Quadrant D | 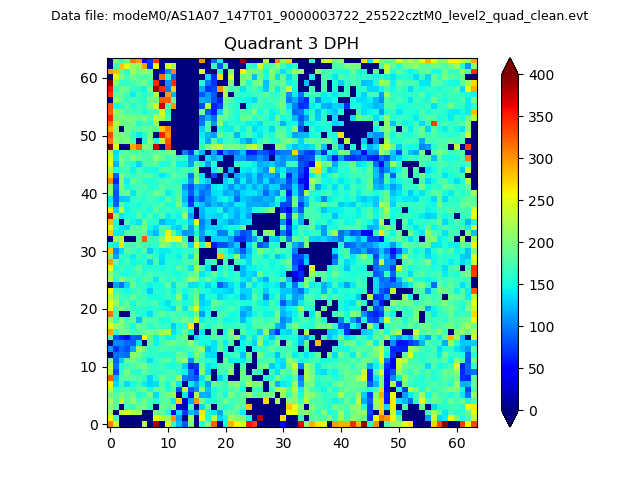 |
 |
Quadrant C |
| Plot type | Count rate plots | Images |
|---|---|---|
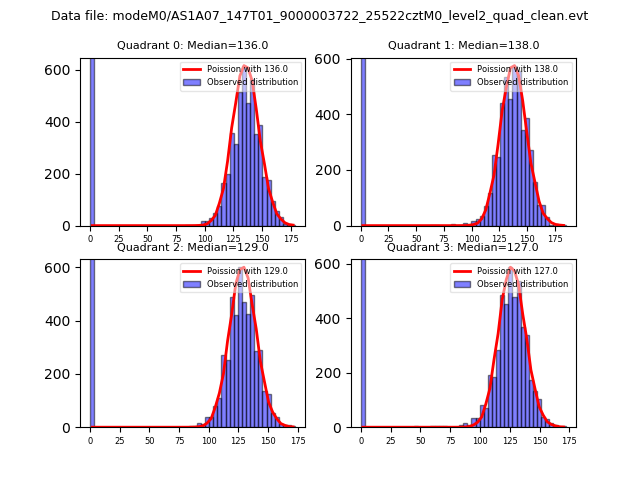
| Comparison with Poisson distribution Blue bars denote a histogram of data divided into 1 sec bins. Red curve is a Poisson curve with rate = median count rate of data. |
 |
 |
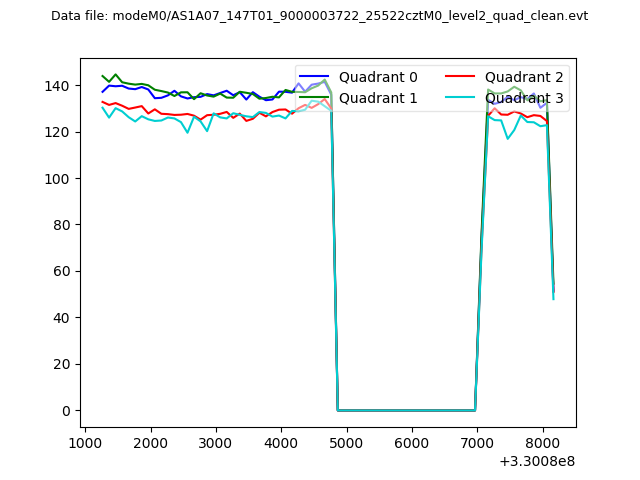
| Quadrant-wise count rates Data is divided into 100 sec bins |
 |
|
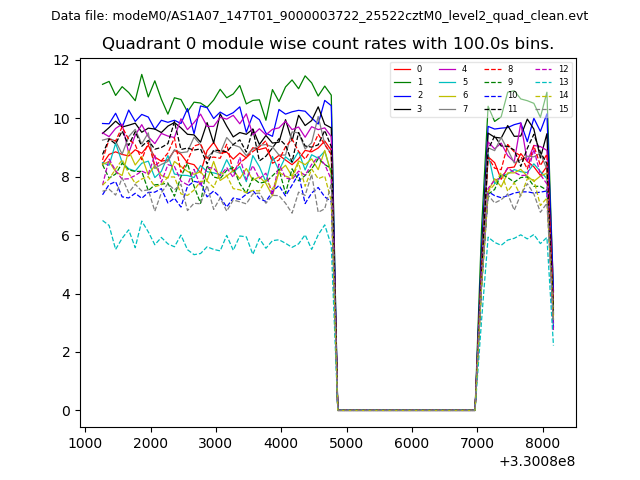
| Module-wise count rates for Quadrant A Data is divided into 100 sec bins |
 |
 |
| Module-wise count rates for Quadrant B Data is divided into 100 sec bins |
 |
 |
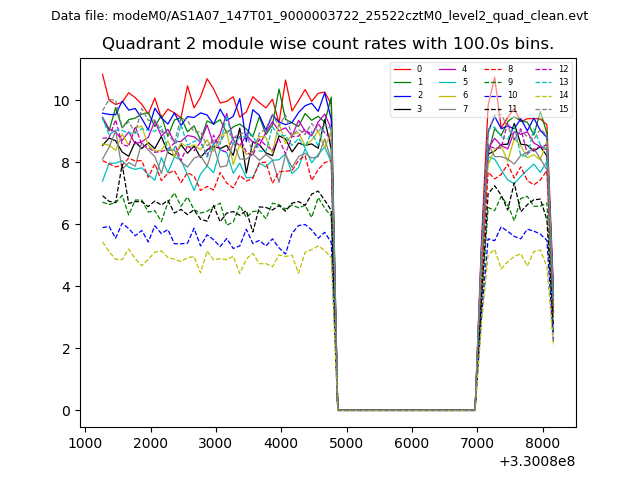
| Module-wise count rates for Quadrant C Data is divided into 100 sec bins |
 |
 |
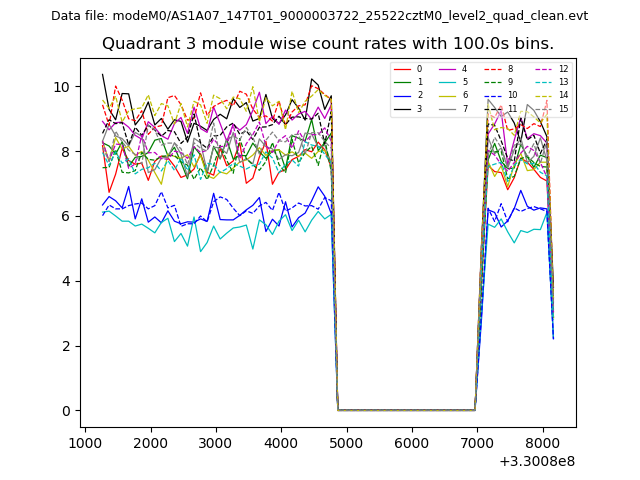
| Module-wise count rates for Quadrant D Data is divided into 100 sec bins |
 |
 |
| Parameter | Plot |
|---|---|
| CZT HV Monitor | 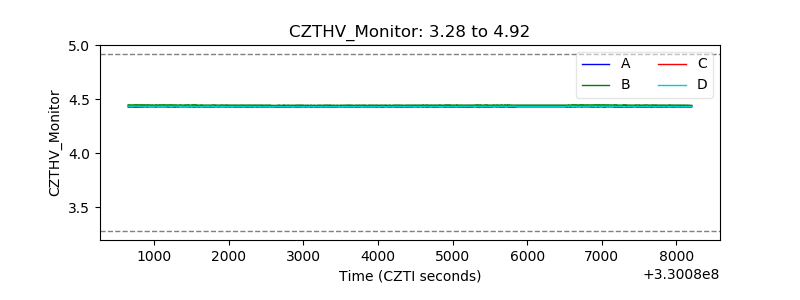 |
| D_VDD | 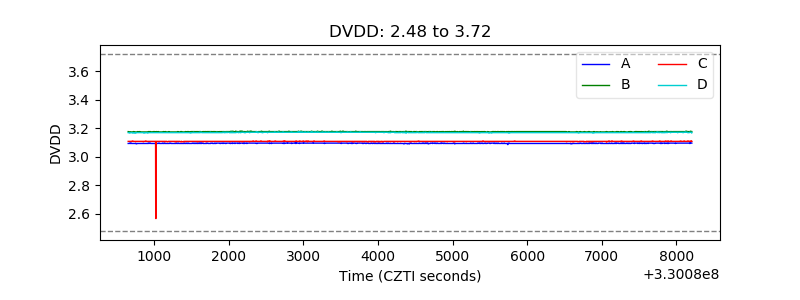 |
| Temperature 1 | 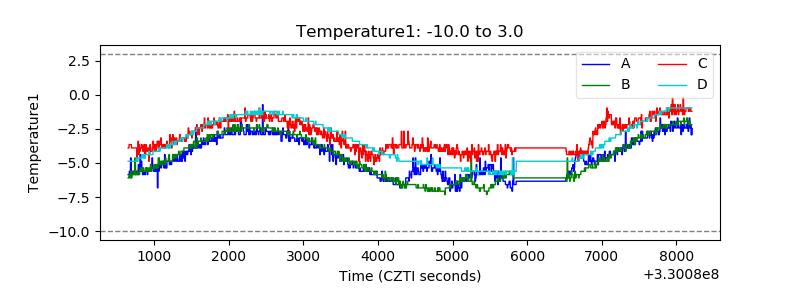 |
| Veto HV Monitor | 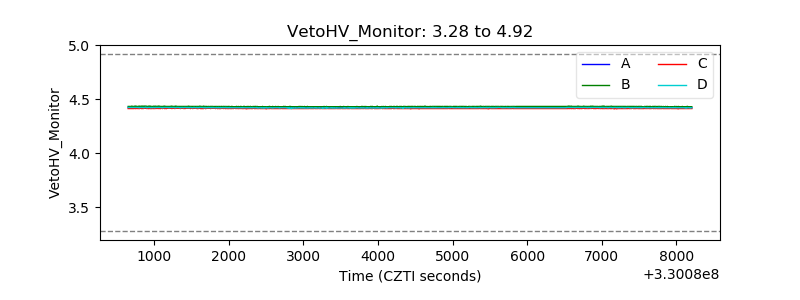 |
| Veto LLD |  |
| Alpha Counter | 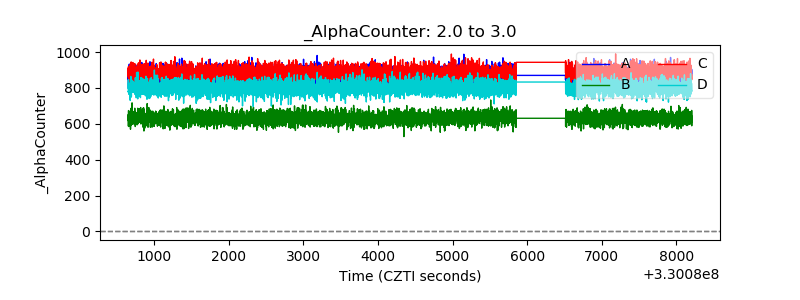 |
| _CPM_Rate | 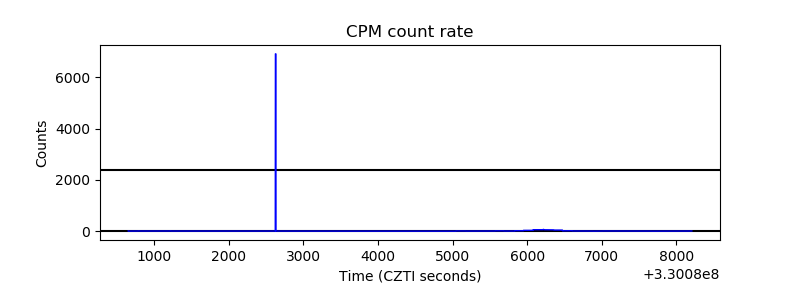 |
| CZT Counter | 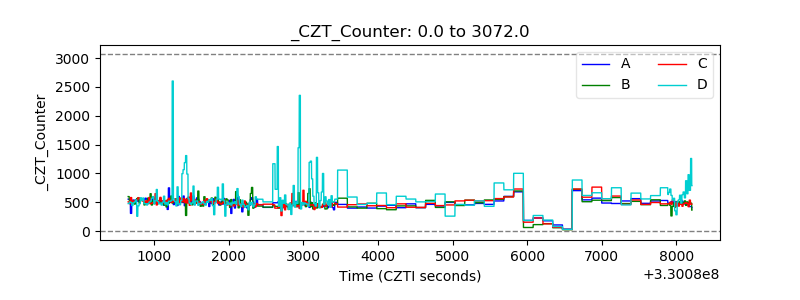 |
| +2.5 Volts monitor |  |
| +5 Volts monitor | 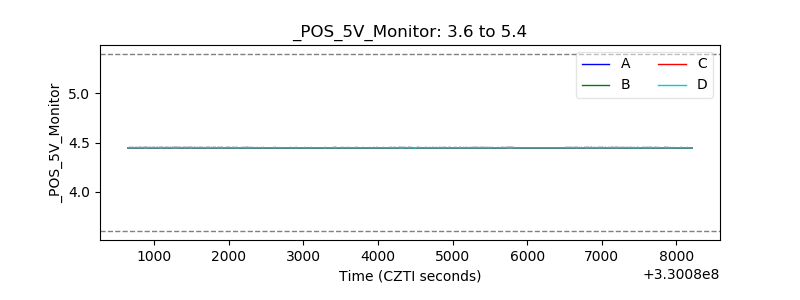 |
| _ROLL_ROT | 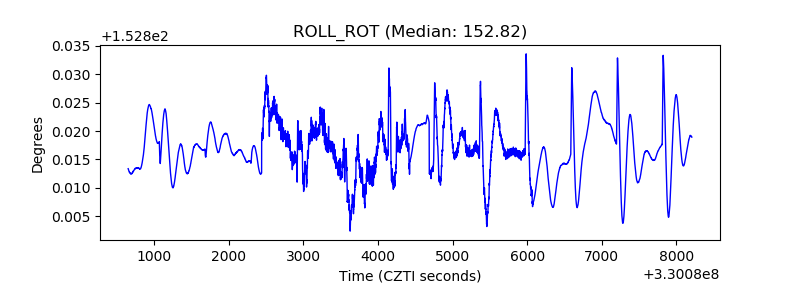 |
| _Roll_DEC | 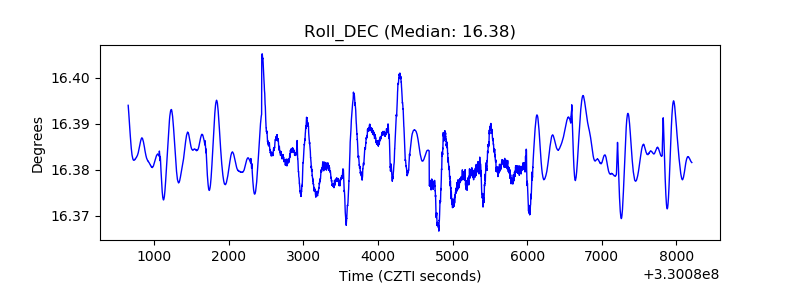 |
| _Roll_RA |  |
| Veto Counter | 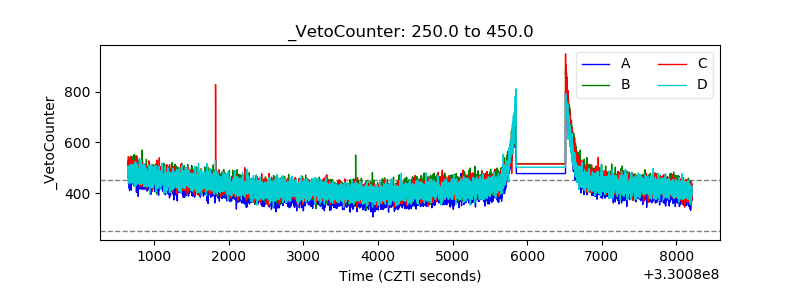 |