| Param | Original file | Final file |
|---|---|---|
| Filename | modeM0/AS1A07_147T01_9000003722_25523cztM0_level2.evt | modeM0/AS1A07_147T01_9000003722_25523cztM0_level2_quad_clean.evt |
| Size (bytes) | 517,366,080 | 100,578,240 |
| Size | 493.4 MB | 95.9 MB |
| Events in quadrant A | 3,494,872 | 655,763 |
| Events in quadrant B | 3,557,271 | 662,367 |
| Events in quadrant C | 3,512,436 | 622,417 |
| Events in quadrant D | 4,618,898 | 608,159 |
| Mode M0 | |||
|---|---|---|---|
| Quadrant | BADHDUFLAG | Total packets | Discarded packets |
| A | 0 | 14760 | 0 |
| B | 0 | 14917 | 0 |
| C | 0 | 14816 | 0 |
| D | 0 | 18566 | 0 |
| Mode M9 | |||
|---|---|---|---|
| Quadrant | BADHDUFLAG | Total packets | Discarded packets |
| A | 0 | 3 | 0 |
| B | 0 | 3 | 0 |
| C | 0 | 3 | 0 |
| D | 0 | 3 | 0 |
| Quadrant | Total seconds | Saturated seconds | Saturation percentage |
|---|---|---|---|
| A | 7147 | 146 | 2.042815% |
| B | 7146 | 175 | 2.448922% |
| C | 7146 | 188 | 2.630842% |
| D | 7146 | 160 | 2.239015% |
Noise dominated data is calculated using 1-second bins in cleaned event files. If a bin has >2000 counts, and if more than 50% of those come from <1% of pixels, then it is considered to be noise-dominated and hence unusable.
| Quadrant | # 1 sec bins | Bins with >0 counts | Bins with >2000 counts | High rate bins dominated by noise | Noise dominated (total time) | Noise dominated (detector-on time) | Marked lightcurve |
|---|---|---|---|---|---|---|---|
| A | 7457 | 7148 | 0 | 0 | 0.00% | 0.00% | 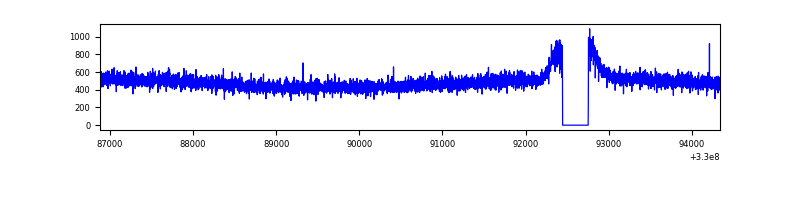 |
| B | 7456 | 7147 | 5 | 5 | 0.07% | 0.07% | 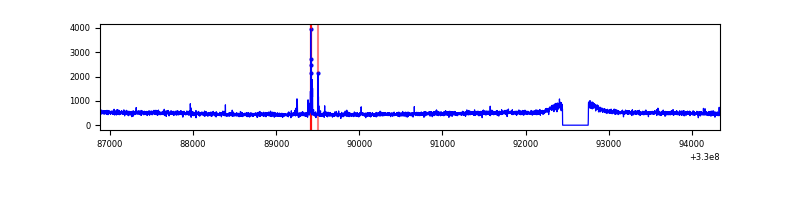 |
| C | 7456 | 7147 | 0 | 0 | 0.00% | 0.00% | 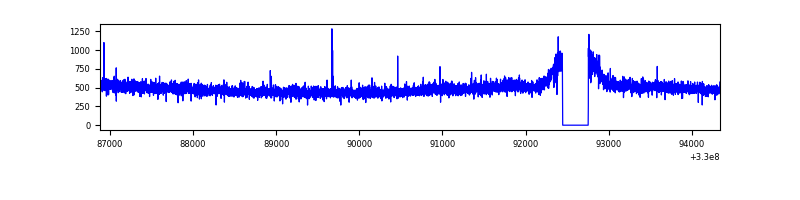 |
| D | 7456 | 7147 | 35 | 35 | 0.47% | 0.49% | 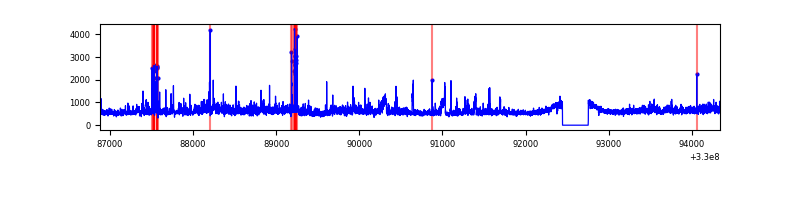 |
Top three noisy pixels from each quadrant. If the there are fewer than three noisy pixels in the level2.evt file, extra rows are filled as -1
| Pixel properties | Quadrant properties | ||||||
|---|---|---|---|---|---|---|---|
| Quadrant | DetID | PixID | Counts | Sigma | Mean | Median | Sigma |
| A | 13 | 254 | 10311 | 50.95 | 906 | 889 | 184.9 |
| A | 3 | 137 | 8505 | 41.18 | 906 | 889 | 184.9 |
| A | 0 | 226 | 7790 | 37.32 | 906 | 889 | 184.9 |
| B | 5 | 235 | 38885 | 221.52 | 893 | 871 | 171.6 |
| B | 12 | 111 | 21605 | 120.82 | 893 | 871 | 171.6 |
| B | 11 | 111 | 19401 | 107.98 | 893 | 871 | 171.6 |
| C | 14 | 238 | 136693 | 674.59 | 859 | 866 | 201.3 |
| C | 2 | 16 | 14060 | 65.53 | 859 | 866 | 201.3 |
| C | 7 | 247 | 9207 | 41.43 | 859 | 866 | 201.3 |
| D | 8 | 195 | 878252 | 4116.14 | 877 | 853 | 213.2 |
| D | 1 | 52 | 336801 | 1576.03 | 877 | 853 | 213.2 |
| D | 13 | 104 | 43244 | 198.87 | 877 | 853 | 213.2 |
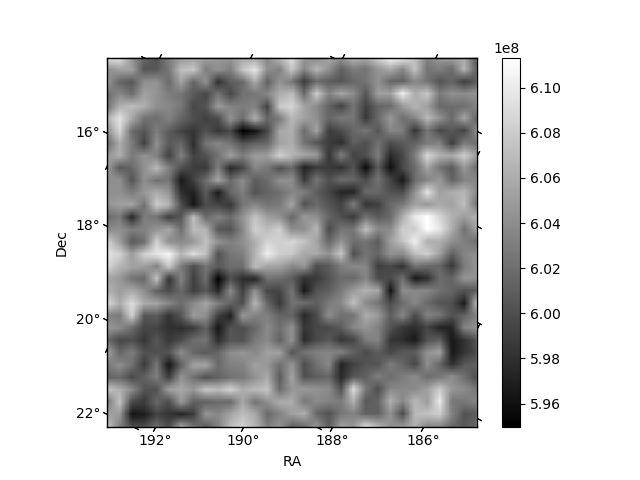
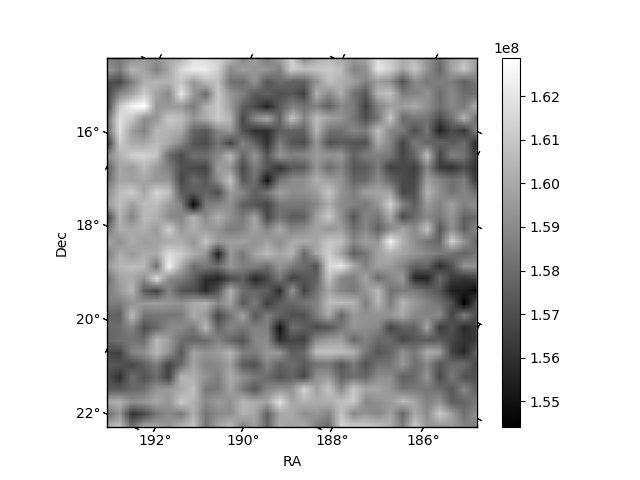
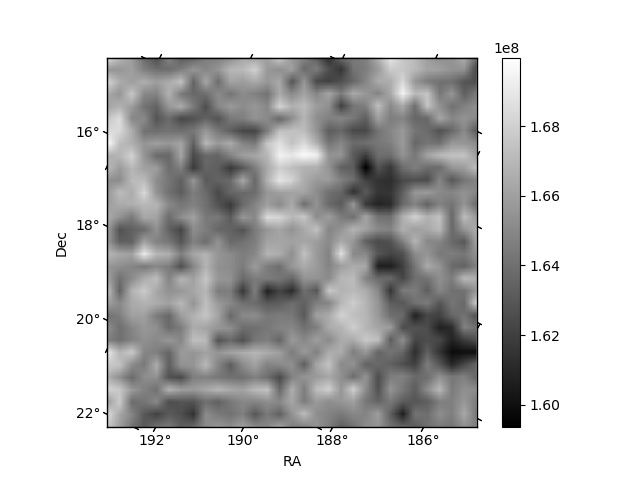
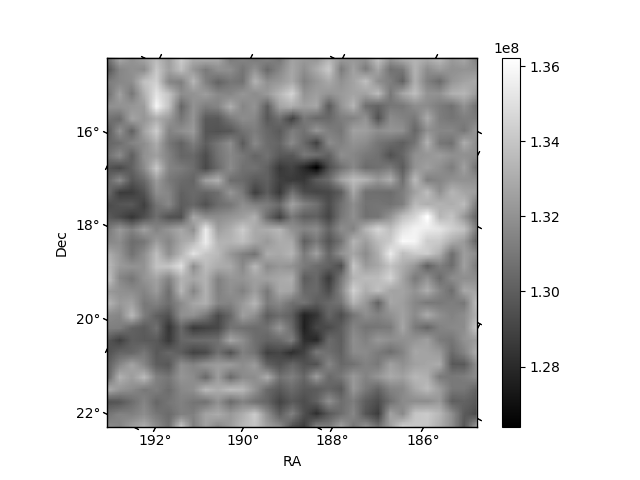
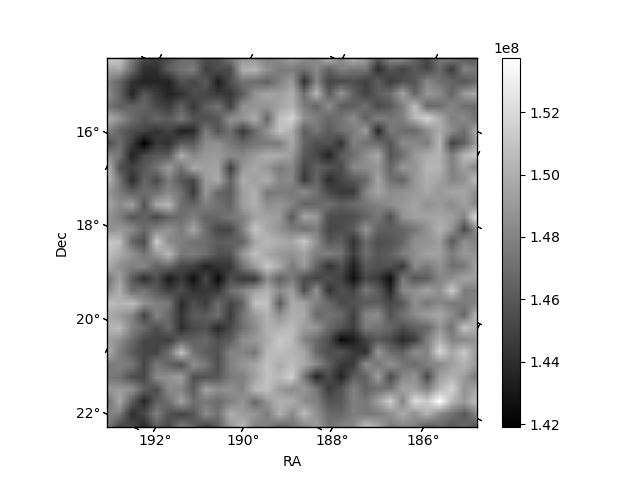
Histogram calculated using DETX and DETY for each event in the final _common_clean file
| Quadrant A | 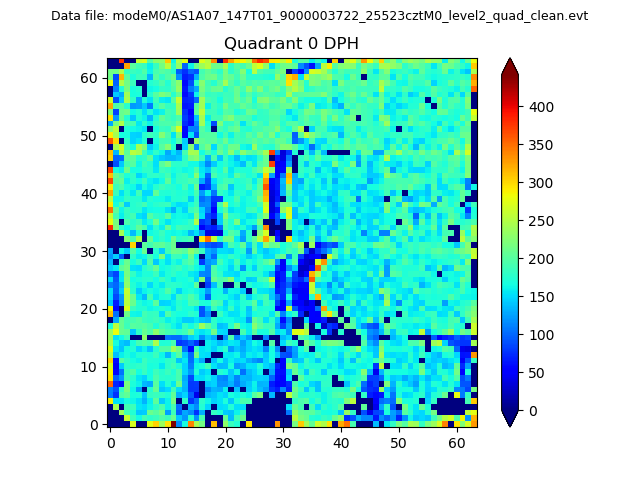 |
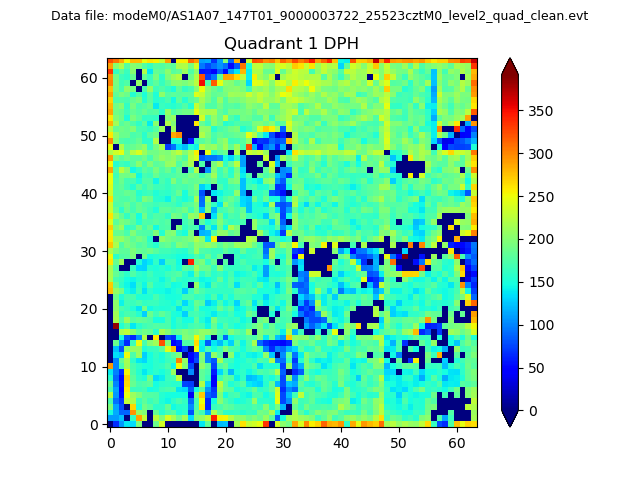 |
Quadrant B |
|---|---|---|---|
| Quadrant D |  |
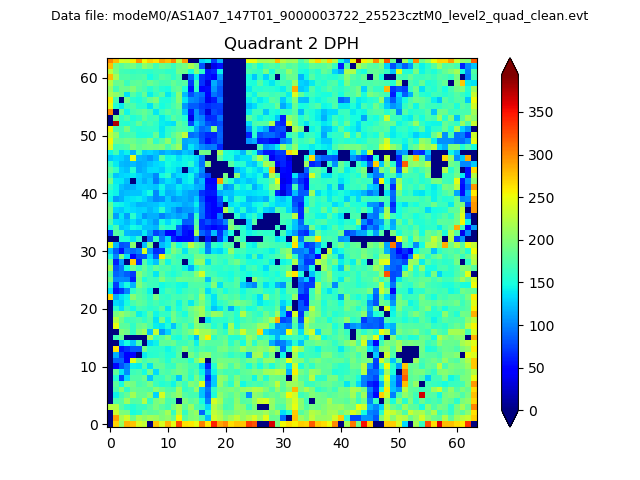 |
Quadrant C |
| Plot type | Count rate plots | Images |
|---|---|---|
| Comparison with Poisson distribution Blue bars denote a histogram of data divided into 1 sec bins. Red curve is a Poisson curve with rate = median count rate of data. |
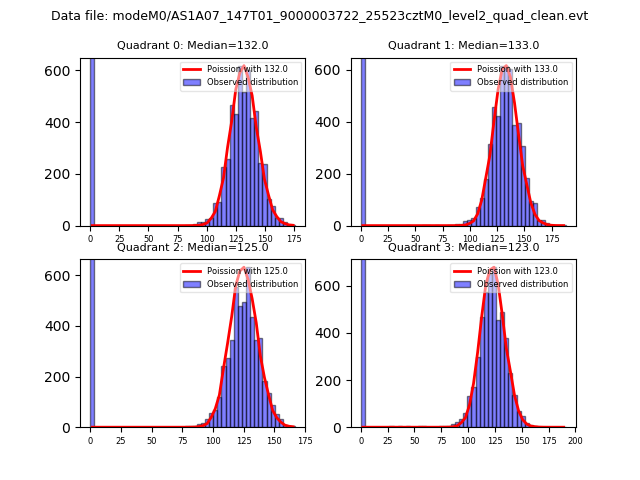 |
 |
| Quadrant-wise count rates Data is divided into 100 sec bins |
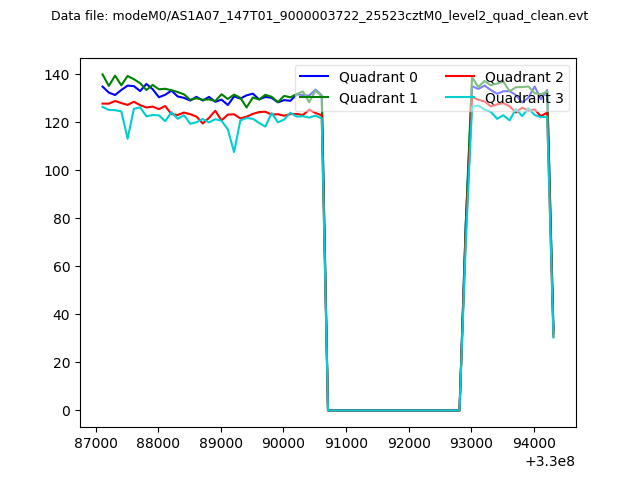 |
|
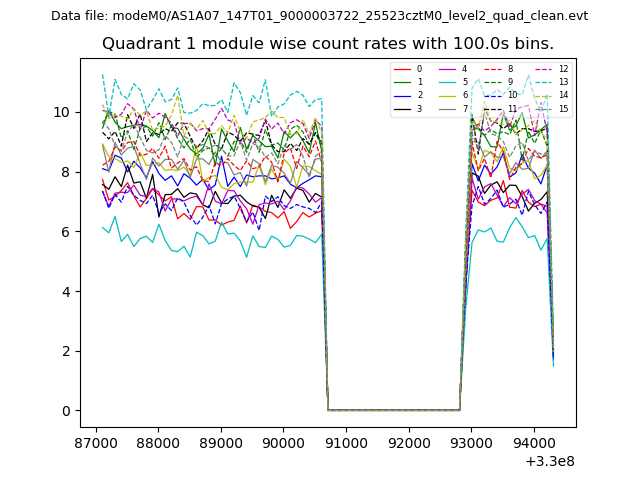
| Module-wise count rates for Quadrant A Data is divided into 100 sec bins |
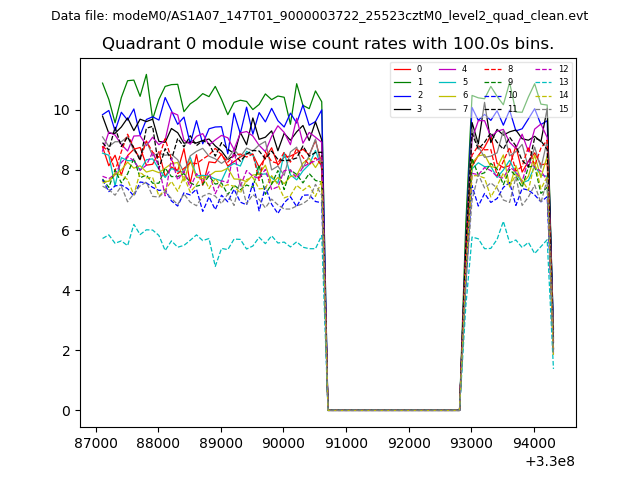 |
 |
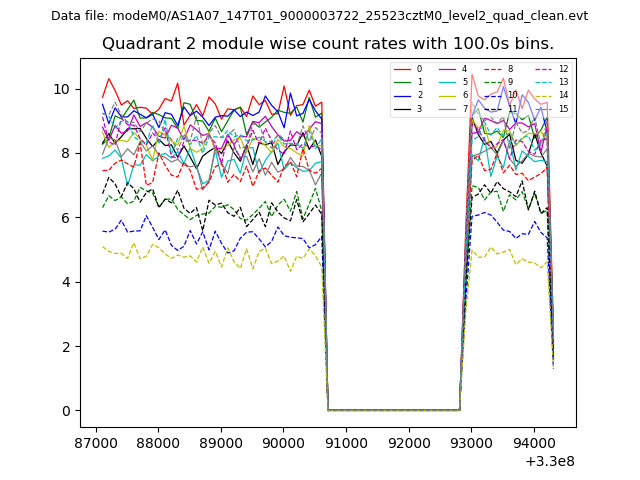
| Module-wise count rates for Quadrant B Data is divided into 100 sec bins |
 |
 |
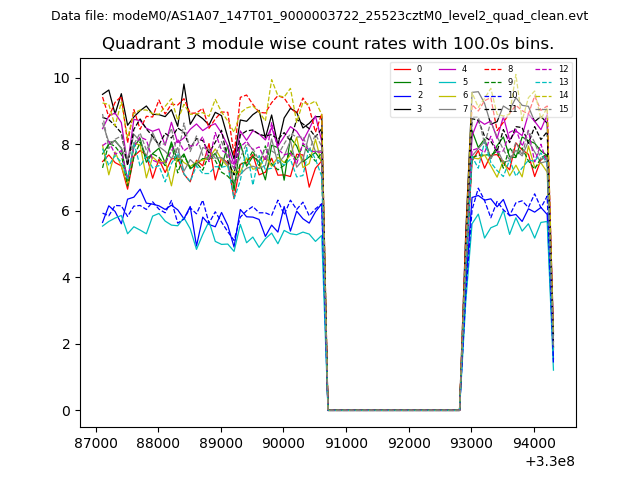
| Module-wise count rates for Quadrant C Data is divided into 100 sec bins |
 |
 |
| Module-wise count rates for Quadrant D Data is divided into 100 sec bins |
 |
 |
| Parameter | Plot |
|---|---|
| CZT HV Monitor |  |
| D_VDD | 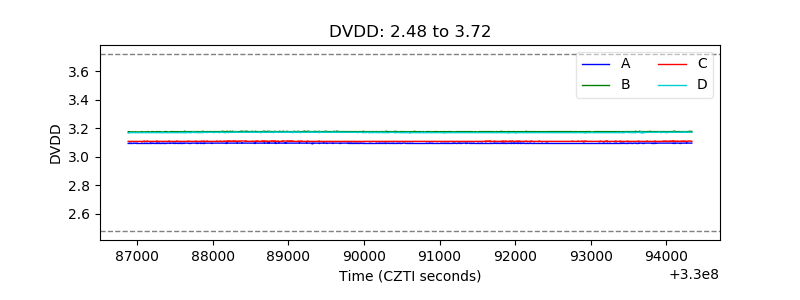 |
| Temperature 1 | 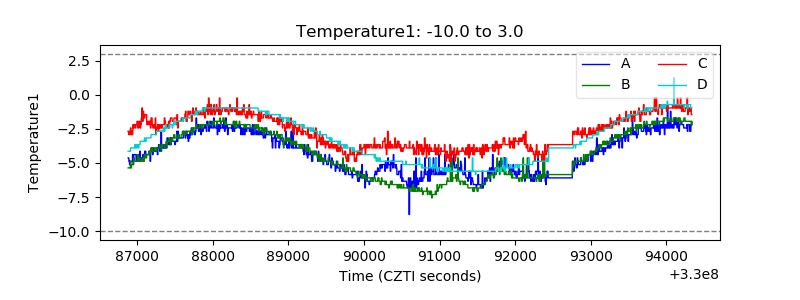 |
| Veto HV Monitor | 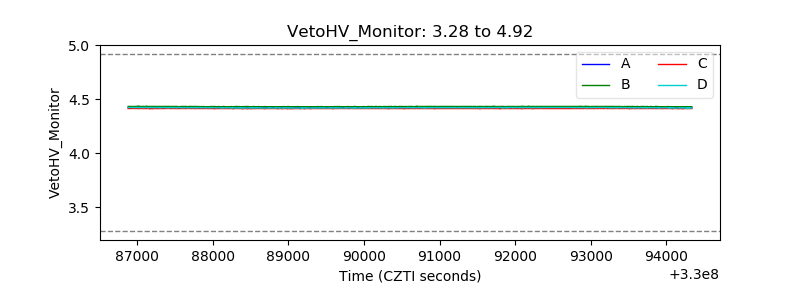 |
| Veto LLD |  |
| Alpha Counter | 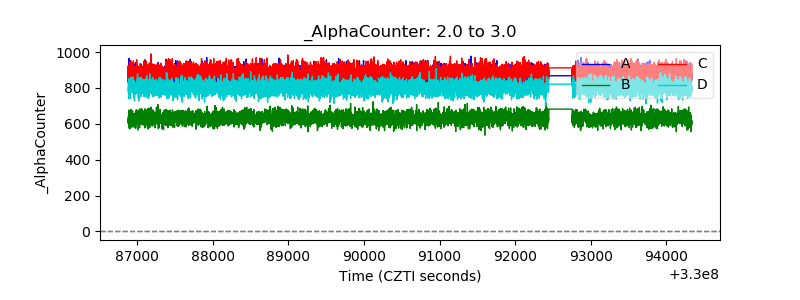 |
| _CPM_Rate | 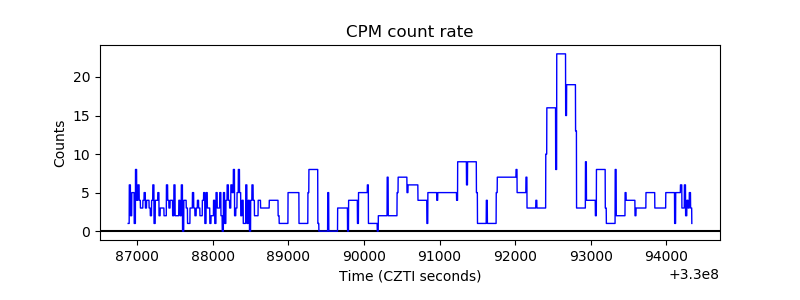 |
| CZT Counter | 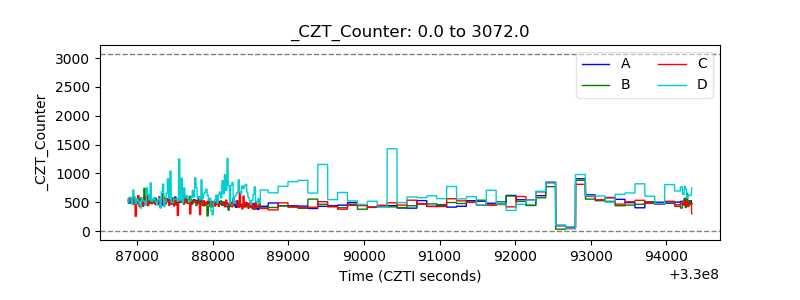 |
| +2.5 Volts monitor |  |
| +5 Volts monitor |  |
| _ROLL_ROT |  |
| _Roll_DEC | 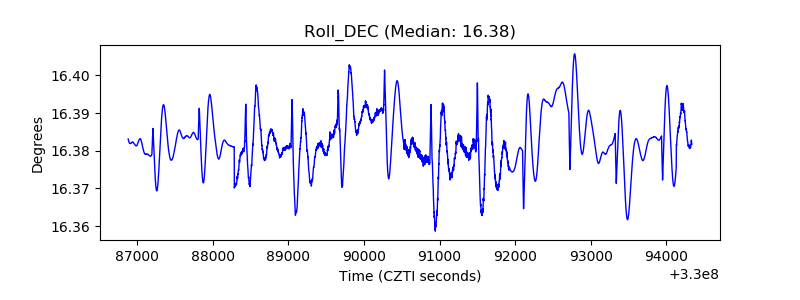 |
| _Roll_RA | 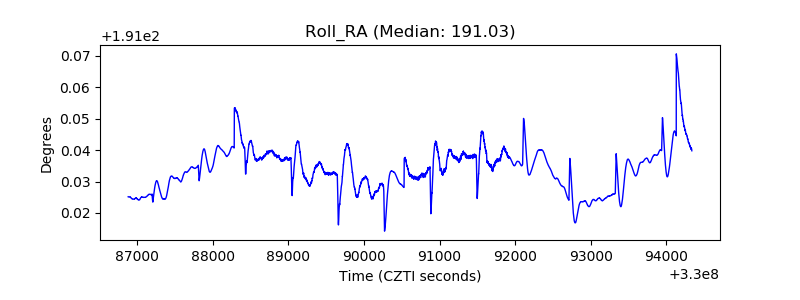 |
| Veto Counter |  |