| Param | Original file | Final file |
|---|---|---|
| Filename | modeM0/AS1A07_147T01_9000003722_25524cztM0_level2.evt | modeM0/AS1A07_147T01_9000003722_25524cztM0_level2_quad_clean.evt |
| Size (bytes) | 499,818,240 | 90,990,720 |
| Size | 476.7 MB | 86.8 MB |
| Events in quadrant A | 3,246,356 | 587,551 |
| Events in quadrant B | 3,315,562 | 591,203 |
| Events in quadrant C | 3,268,092 | 556,567 |
| Events in quadrant D | 4,849,998 | 550,782 |
| Mode M0 | |||
|---|---|---|---|
| Quadrant | BADHDUFLAG | Total packets | Discarded packets |
| A | 0 | 13960 | 0 |
| B | 0 | 14106 | 0 |
| C | 0 | 13936 | 0 |
| D | 0 | 18993 | 0 |
| Mode M9 | |||
|---|---|---|---|
| Quadrant | BADHDUFLAG | Total packets | Discarded packets |
| A | 0 | 3 | 0 |
| B | 0 | 3 | 0 |
| C | 0 | 3 | 0 |
| D | 0 | 3 | 0 |
| Quadrant | Total seconds | Saturated seconds | Saturation percentage |
|---|---|---|---|
| A | 6735 | 98 | 1.455085% |
| B | 6736 | 123 | 1.826010% |
| C | 6736 | 142 | 2.108076% |
| D | 6735 | 258 | 3.830735% |
Noise dominated data is calculated using 1-second bins in cleaned event files. If a bin has >2000 counts, and if more than 50% of those come from <1% of pixels, then it is considered to be noise-dominated and hence unusable.
| Quadrant | # 1 sec bins | Bins with >0 counts | Bins with >2000 counts | High rate bins dominated by noise | Noise dominated (total time) | Noise dominated (detector-on time) | Marked lightcurve |
|---|---|---|---|---|---|---|---|
| A | 7015 | 6736 | 0 | 0 | 0.00% | 0.00% | 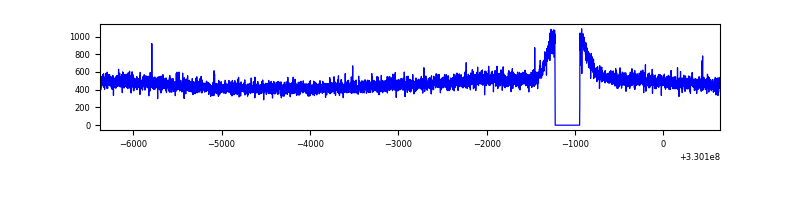 |
| B | 7016 | 6737 | 0 | 0 | 0.00% | 0.00% | 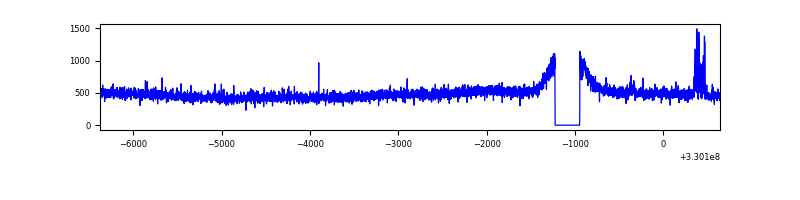 |
| C | 7016 | 6737 | 0 | 0 | 0.00% | 0.00% | 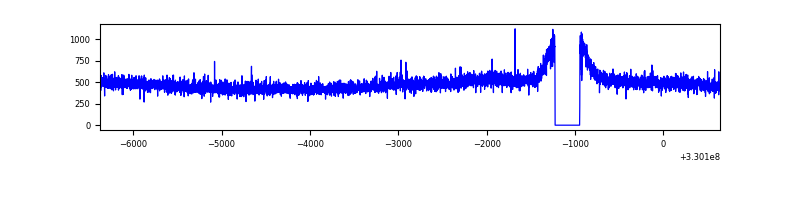 |
| D | 7015 | 6736 | 203 | 203 | 2.89% | 3.01% | 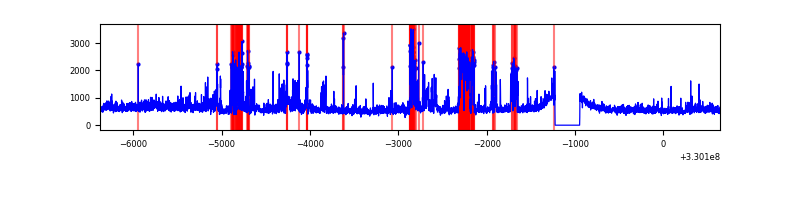 |
Top three noisy pixels from each quadrant. If the there are fewer than three noisy pixels in the level2.evt file, extra rows are filled as -1
| Pixel properties | Quadrant properties | ||||||
|---|---|---|---|---|---|---|---|
| Quadrant | DetID | PixID | Counts | Sigma | Mean | Median | Sigma |
| A | 13 | 254 | 9441 | 50.16 | 841 | 822 | 171.8 |
| A | 3 | 137 | 7839 | 40.83 | 841 | 822 | 171.8 |
| A | 0 | 226 | 7182 | 37.01 | 841 | 822 | 171.8 |
| B | 15 | 33 | 40205 | 244.55 | 832 | 810 | 161.1 |
| B | 12 | 111 | 19798 | 117.87 | 832 | 810 | 161.1 |
| B | 11 | 111 | 18025 | 106.86 | 832 | 810 | 161.1 |
| C | 14 | 238 | 126836 | 671.61 | 798 | 803 | 187.7 |
| C | 7 | 247 | 20351 | 104.17 | 798 | 803 | 187.7 |
| C | 2 | 16 | 5896 | 27.14 | 798 | 803 | 187.7 |
| D | 1 | 52 | 1070728 | 5357.17 | 812 | 789 | 199.7 |
| D | 8 | 195 | 693615 | 3468.97 | 812 | 789 | 199.7 |
| D | 2 | 234 | 28511 | 138.8 | 812 | 789 | 199.7 |
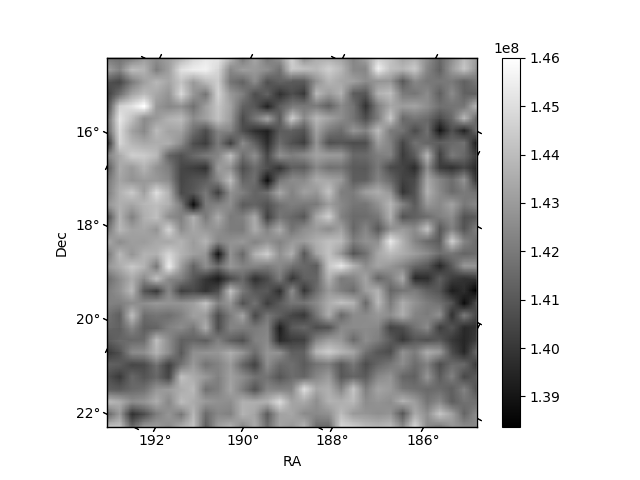
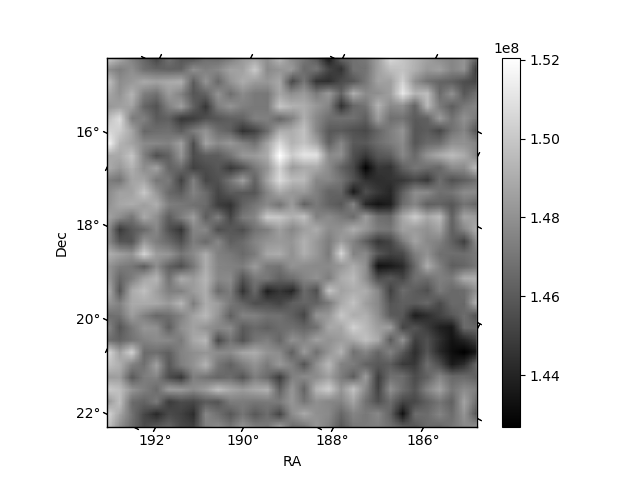
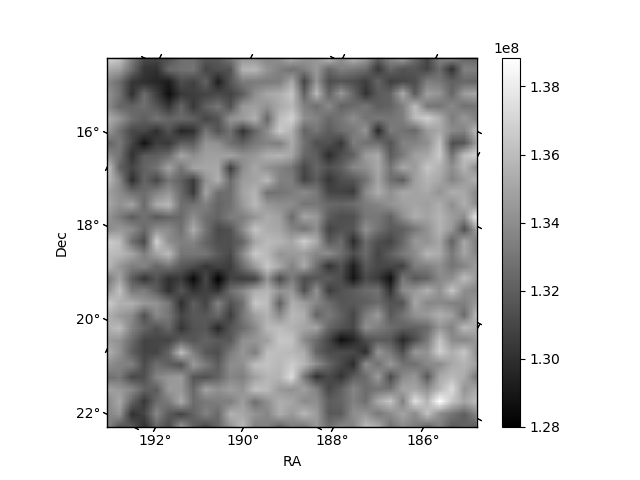
Histogram calculated using DETX and DETY for each event in the final _common_clean file
| Quadrant A |  |
 |
Quadrant B |
|---|---|---|---|
| Quadrant D |  |
 |
Quadrant C |
| Plot type | Count rate plots | Images |
|---|---|---|
| Comparison with Poisson distribution Blue bars denote a histogram of data divided into 1 sec bins. Red curve is a Poisson curve with rate = median count rate of data. |
 |
 |
| Quadrant-wise count rates Data is divided into 100 sec bins |
 |
|
| Module-wise count rates for Quadrant A Data is divided into 100 sec bins |
 |
 |
| Module-wise count rates for Quadrant B Data is divided into 100 sec bins |
 |
 |
| Module-wise count rates for Quadrant C Data is divided into 100 sec bins |
 |
 |
| Module-wise count rates for Quadrant D Data is divided into 100 sec bins |
 |
 |
| Parameter | Plot |
|---|---|
| CZT HV Monitor |  |
| D_VDD | 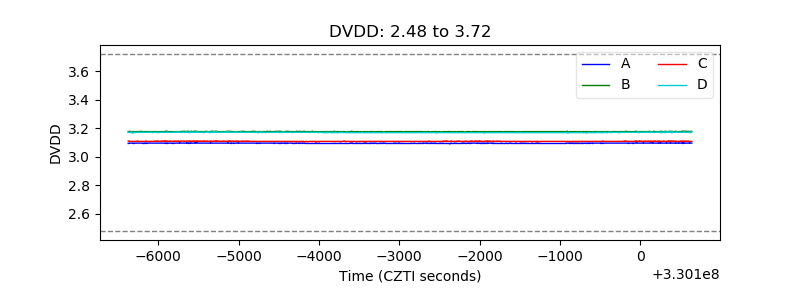 |
| Temperature 1 |  |
| Veto HV Monitor |  |
| Veto LLD |  |
| Alpha Counter |  |
| _CPM_Rate |  |
| CZT Counter |  |
| +2.5 Volts monitor |  |
| +5 Volts monitor |  |
| _ROLL_ROT |  |
| _Roll_DEC |  |
| _Roll_RA |  |
| Veto Counter |  |