| Param | Original file | Final file |
|---|---|---|
| Filename | modeM0/AS1A07_147T01_9000003722_25527cztM0_level2.evt | modeM0/AS1A07_147T01_9000003722_25527cztM0_level2_quad_clean.evt |
| Size (bytes) | 1,293,575,040 | 230,189,760 |
| Size | 1.2 GB | 219.5 MB |
| Events in quadrant A | 8,519,225 | 1,470,485 |
| Events in quadrant B | 8,842,453 | 1,484,360 |
| Events in quadrant C | 8,562,052 | 1,405,818 |
| Events in quadrant D | 12,030,990 | 1,365,296 |
| Mode M0 | |||
|---|---|---|---|
| Quadrant | BADHDUFLAG | Total packets | Discarded packets |
| A | 0 | 37188 | 0 |
| B | 0 | 37912 | 0 |
| C | 0 | 37195 | 0 |
| D | 0 | 47804 | 0 |
| Mode M9 | |||
|---|---|---|---|
| Quadrant | BADHDUFLAG | Total packets | Discarded packets |
| A | 0 | 19 | 0 |
| B | 0 | 19 | 0 |
| C | 0 | 19 | 0 |
| D | 0 | 19 | 0 |
| Quadrant | Total seconds | Saturated seconds | Saturation percentage |
|---|---|---|---|
| A | 18080 | 126 | 0.696903% |
| B | 18080 | 176 | 0.973451% |
| C | 18080 | 232 | 1.283186% |
| D | 18080 | 430 | 2.378319% |
Noise dominated data is calculated using 1-second bins in cleaned event files. If a bin has >2000 counts, and if more than 50% of those come from <1% of pixels, then it is considered to be noise-dominated and hence unusable.
| Quadrant | # 1 sec bins | Bins with >0 counts | Bins with >2000 counts | High rate bins dominated by noise | Noise dominated (total time) | Noise dominated (detector-on time) | Marked lightcurve |
|---|---|---|---|---|---|---|---|
| A | 19900 | 18083 | 0 | 0 | 0.00% | 0.00% |  |
| B | 19900 | 18083 | 2 | 2 | 0.01% | 0.01% | 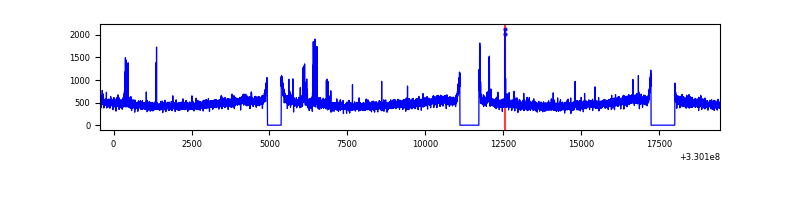 |
| C | 19900 | 18083 | 1 | 1 | 0.01% | 0.01% | 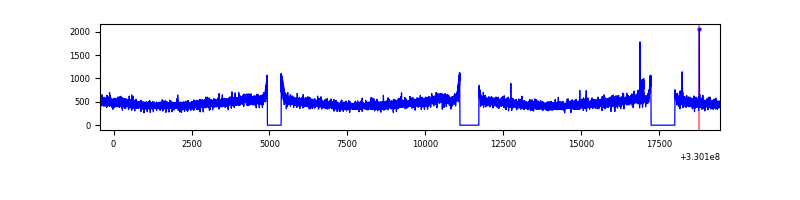 |
| D | 19900 | 18083 | 283 | 283 | 1.42% | 1.57% | 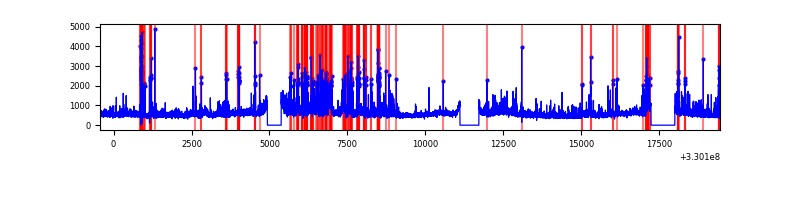 |
Top three noisy pixels from each quadrant. If the there are fewer than three noisy pixels in the level2.evt file, extra rows are filled as -1
| Pixel properties | Quadrant properties | ||||||
|---|---|---|---|---|---|---|---|
| Quadrant | DetID | PixID | Counts | Sigma | Mean | Median | Sigma |
| A | 6 | 16 | 33145 | 70.37 | 2201 | 2155 | 440.4 |
| A | 13 | 254 | 26218 | 54.64 | 2201 | 2155 | 440.4 |
| A | 3 | 137 | 21076 | 42.97 | 2201 | 2155 | 440.4 |
| B | 15 | 33 | 176484 | 415.15 | 2186 | 2132 | 420.0 |
| B | 12 | 111 | 52126 | 119.04 | 2186 | 2132 | 420.0 |
| B | 0 | 190 | 49239 | 112.17 | 2186 | 2132 | 420.0 |
| C | 14 | 238 | 333921 | 673.37 | 2099 | 2113 | 492.8 |
| C | 2 | 16 | 30050 | 56.69 | 2099 | 2113 | 492.8 |
| C | 3 | 233 | 17857 | 31.95 | 2099 | 2113 | 492.8 |
| D | 1 | 52 | 2639598 | 5162.68 | 2114 | 2052 | 510.9 |
| D | 8 | 195 | 1316002 | 2571.9 | 2114 | 2052 | 510.9 |
| D | 2 | 234 | 70582 | 134.14 | 2114 | 2052 | 510.9 |
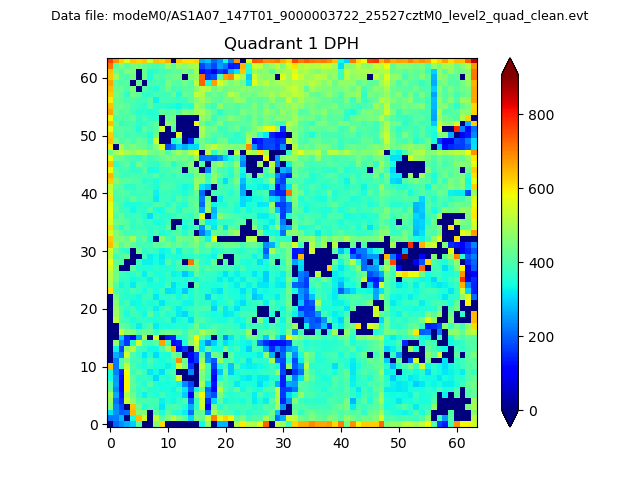
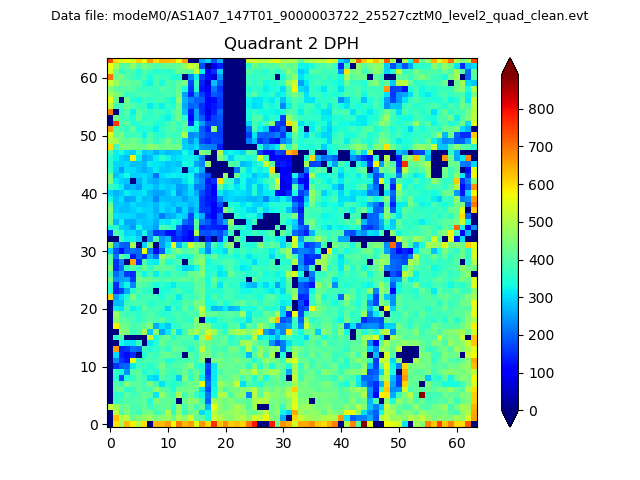
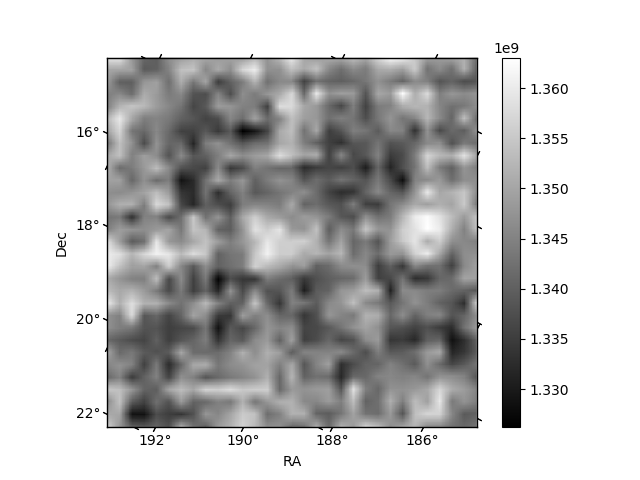
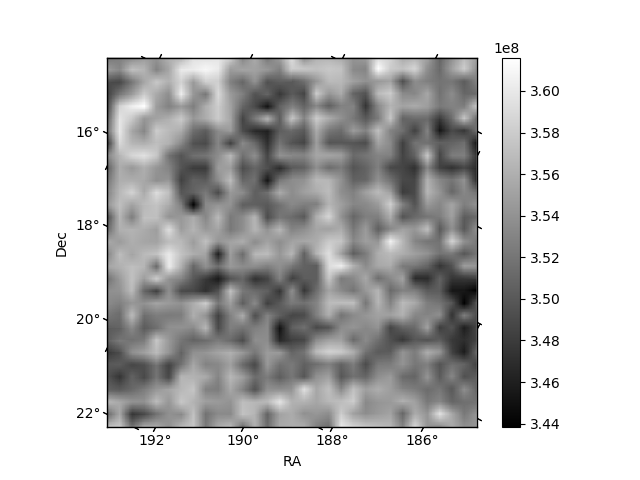
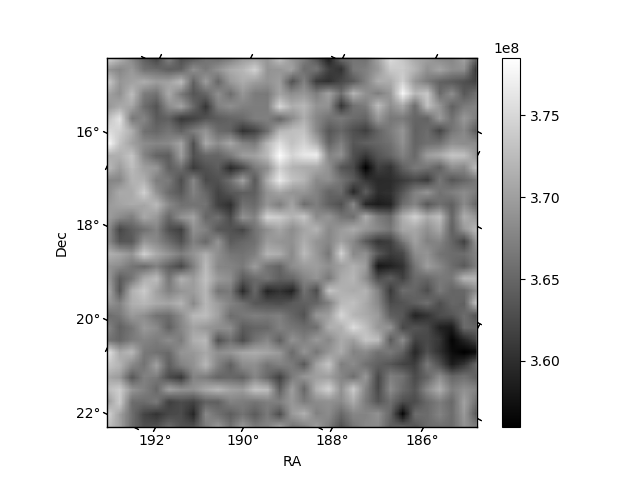
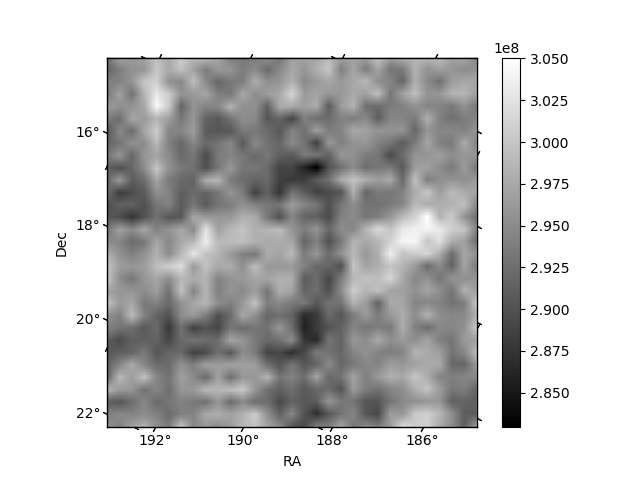
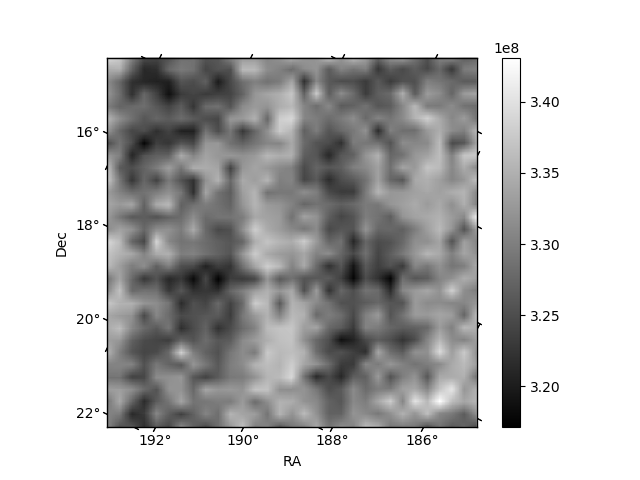
Histogram calculated using DETX and DETY for each event in the final _common_clean file
| Quadrant A | 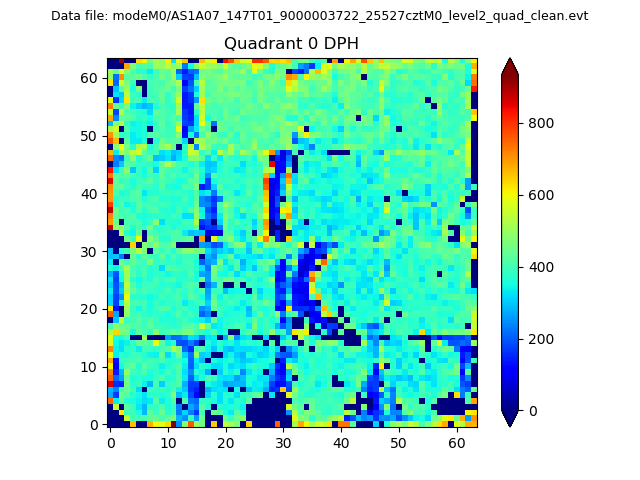 |
 |
Quadrant B |
|---|---|---|---|
| Quadrant D | 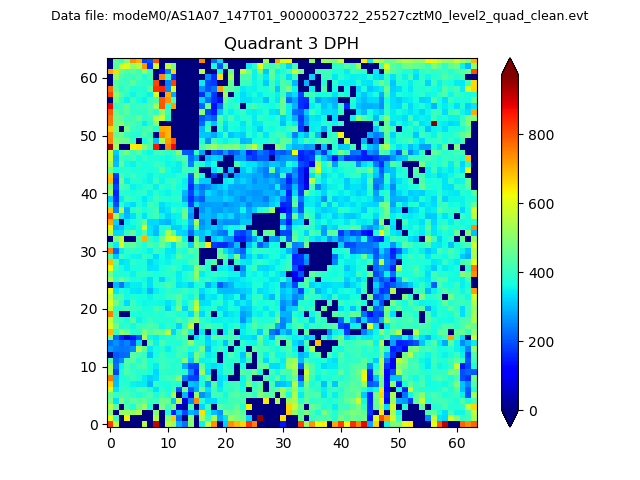 |
 |
Quadrant C |
| Plot type | Count rate plots | Images |
|---|---|---|
| Comparison with Poisson distribution Blue bars denote a histogram of data divided into 1 sec bins. Red curve is a Poisson curve with rate = median count rate of data. |
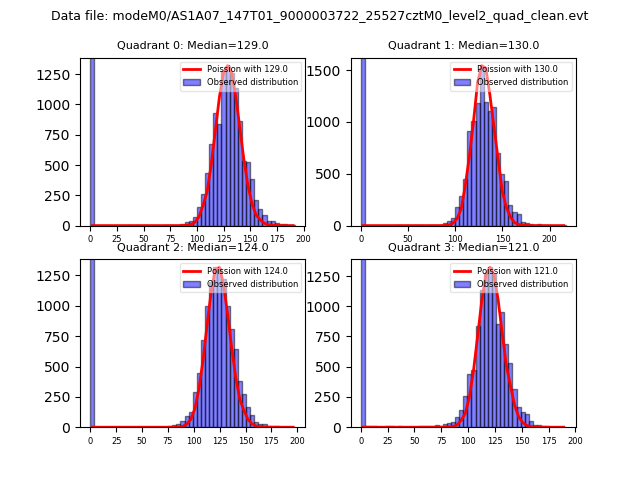 |
 |
| Quadrant-wise count rates Data is divided into 100 sec bins |
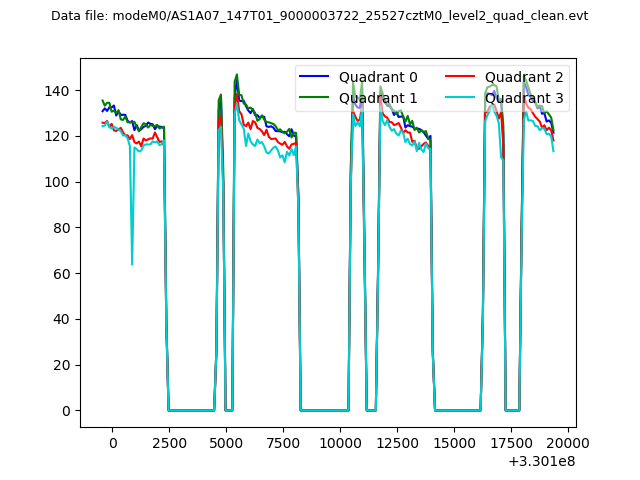 |
|
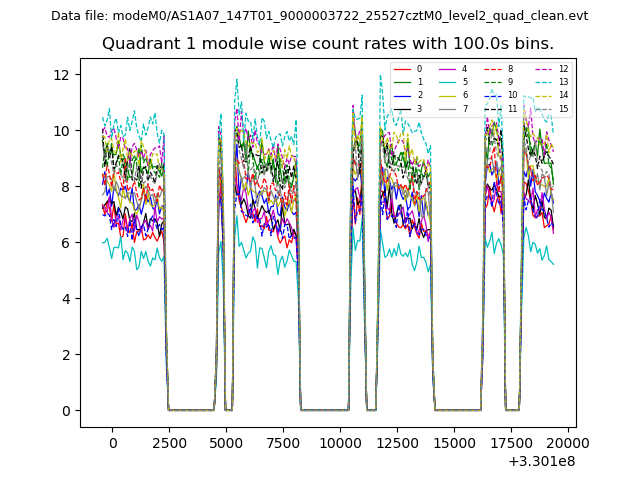
| Module-wise count rates for Quadrant A Data is divided into 100 sec bins |
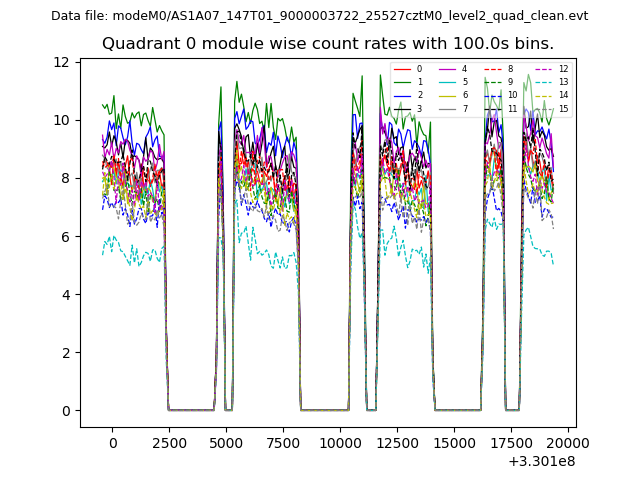 |
 |
| Module-wise count rates for Quadrant B Data is divided into 100 sec bins |
 |
 |
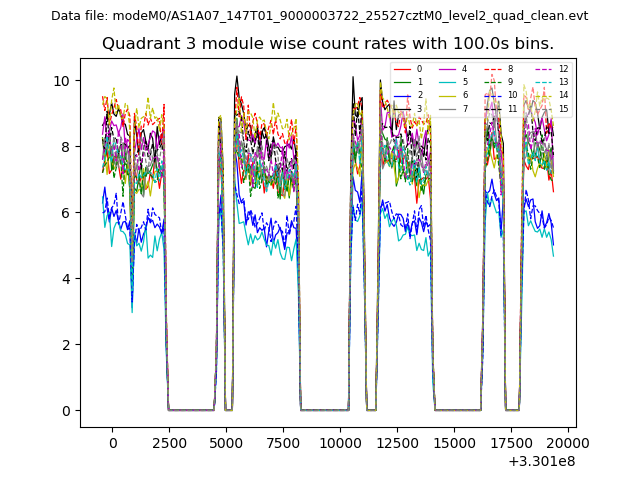
| Module-wise count rates for Quadrant C Data is divided into 100 sec bins |
 |
 |
| Module-wise count rates for Quadrant D Data is divided into 100 sec bins |
 |
 |
| Parameter | Plot |
|---|---|
| CZT HV Monitor | 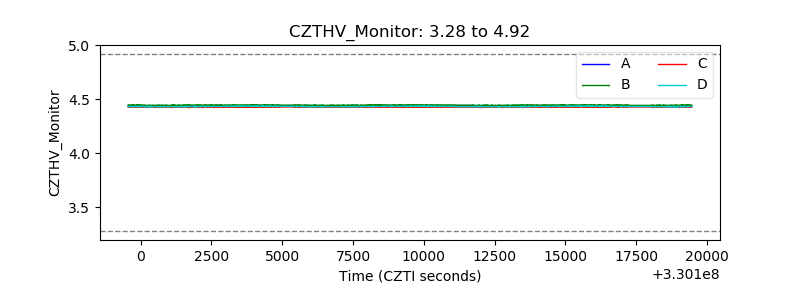 |
| D_VDD | 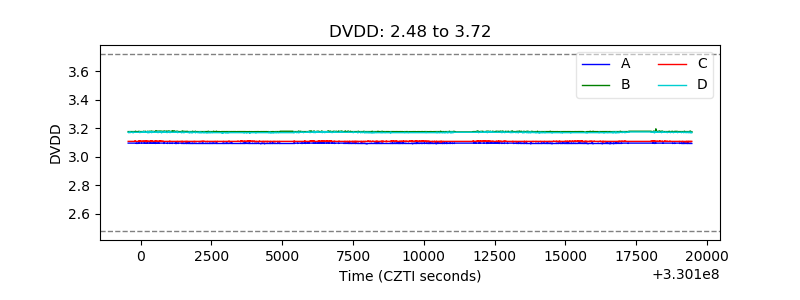 |
| Temperature 1 | 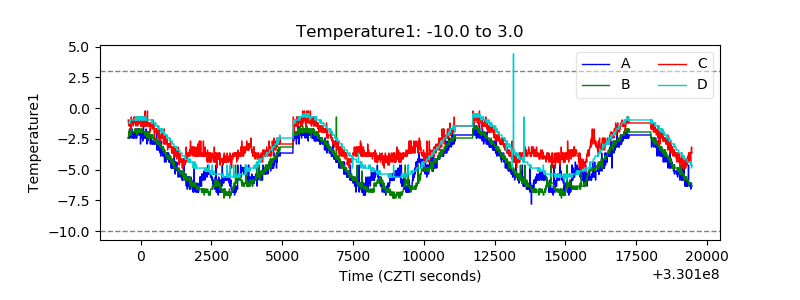 |
| Veto HV Monitor | 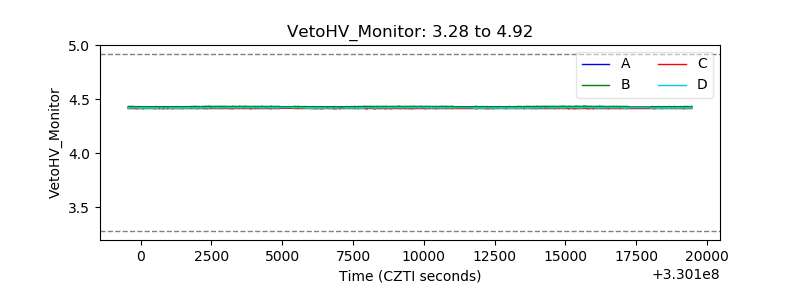 |
| Veto LLD | 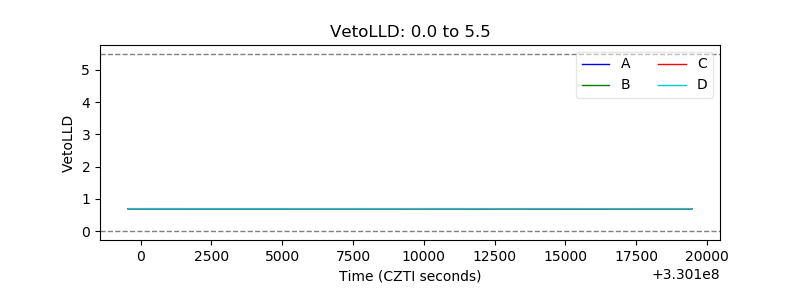 |
| Alpha Counter | 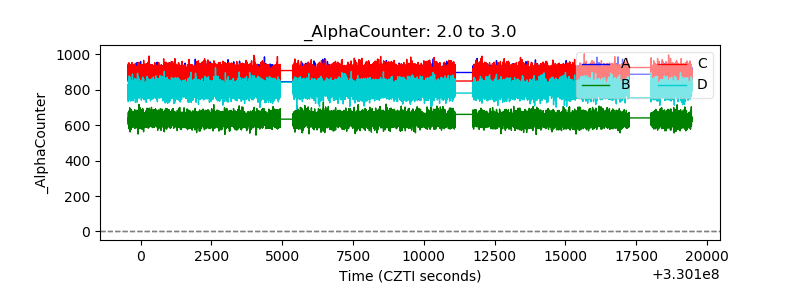 |
| _CPM_Rate | 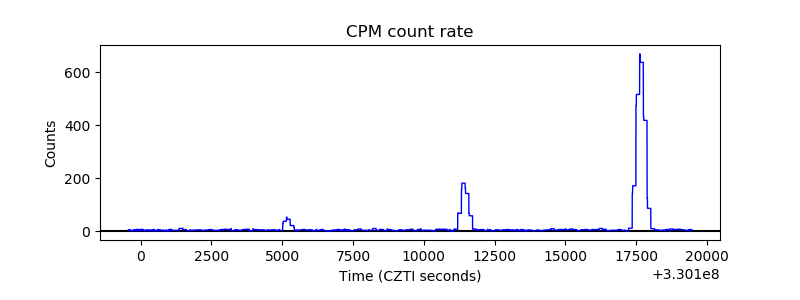 |
| CZT Counter | 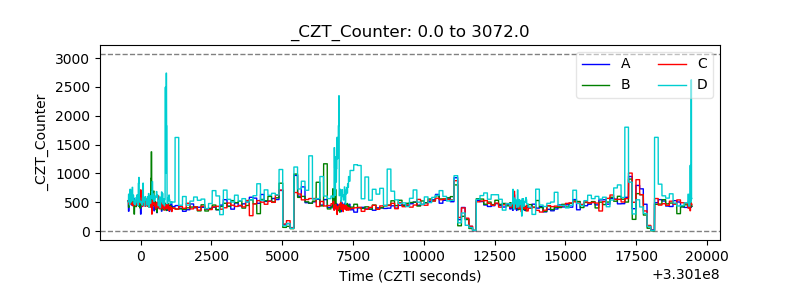 |
| +2.5 Volts monitor |  |
| +5 Volts monitor |  |
| _ROLL_ROT | 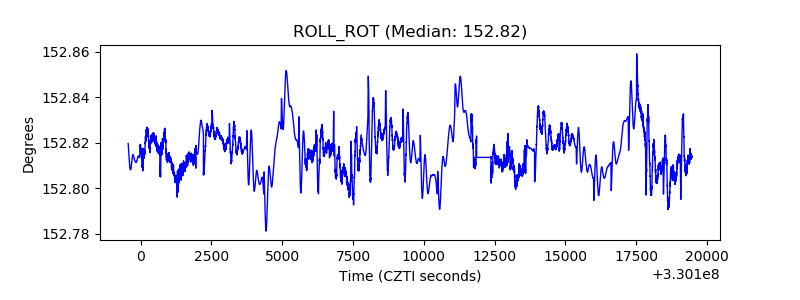 |
| _Roll_DEC | 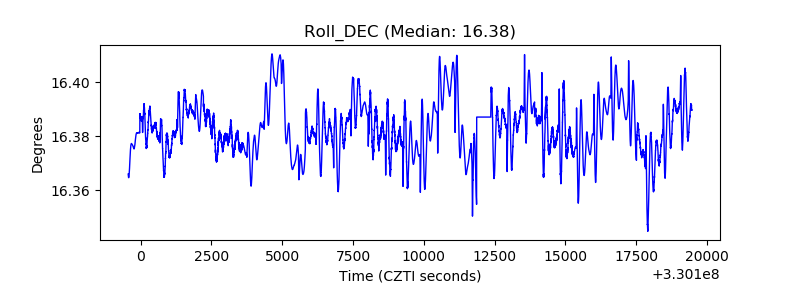 |
| _Roll_RA | 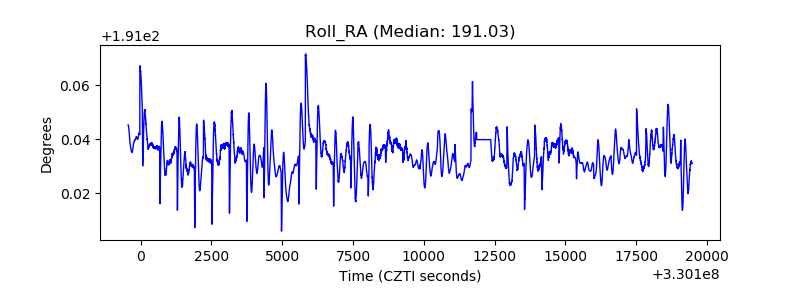 |
| Veto Counter | 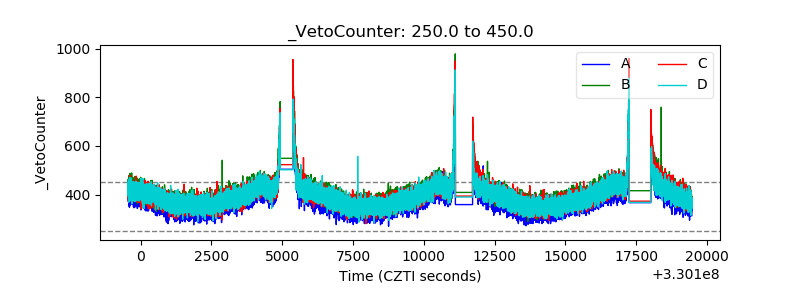 |