| Param | Original file | Final file |
|---|---|---|
| Filename | modeM0/AS1A07_147T01_9000003722_25528cztM0_level2.evt | modeM0/AS1A07_147T01_9000003722_25528cztM0_level2_quad_clean.evt |
| Size (bytes) | 496,293,120 | 96,001,920 |
| Size | 473.3 MB | 91.6 MB |
| Events in quadrant A | 3,281,574 | 624,373 |
| Events in quadrant B | 3,324,592 | 634,450 |
| Events in quadrant C | 3,308,688 | 597,747 |
| Events in quadrant D | 4,650,539 | 573,566 |
| Mode M0 | |||
|---|---|---|---|
| Quadrant | BADHDUFLAG | Total packets | Discarded packets |
| A | 0 | 14116 | 0 |
| B | 0 | 14129 | 0 |
| C | 0 | 14165 | 0 |
| D | 0 | 18601 | 0 |
| Mode M9 | |||
|---|---|---|---|
| Quadrant | BADHDUFLAG | Total packets | Discarded packets |
| A | 0 | 18 | 0 |
| B | 0 | 18 | 0 |
| C | 0 | 18 | 0 |
| D | 0 | 18 | 0 |
| Quadrant | Total seconds | Saturated seconds | Saturation percentage |
|---|---|---|---|
| A | 6849 | 41 | 0.598628% |
| B | 6850 | 49 | 0.715328% |
| C | 6850 | 89 | 1.299270% |
| D | 6850 | 219 | 3.197080% |
Noise dominated data is calculated using 1-second bins in cleaned event files. If a bin has >2000 counts, and if more than 50% of those come from <1% of pixels, then it is considered to be noise-dominated and hence unusable.
| Quadrant | # 1 sec bins | Bins with >0 counts | Bins with >2000 counts | High rate bins dominated by noise | Noise dominated (total time) | Noise dominated (detector-on time) | Marked lightcurve |
|---|---|---|---|---|---|---|---|
| A | 8549 | 6851 | 0 | 0 | 0.00% | 0.00% | 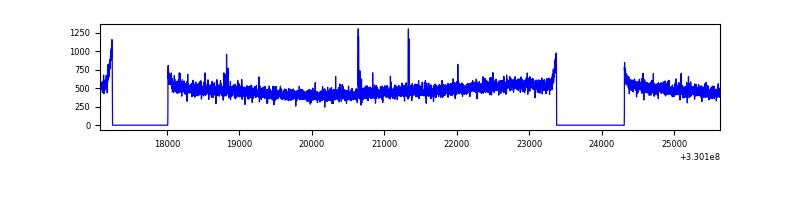 |
| B | 8549 | 6851 | 0 | 0 | 0.00% | 0.00% | 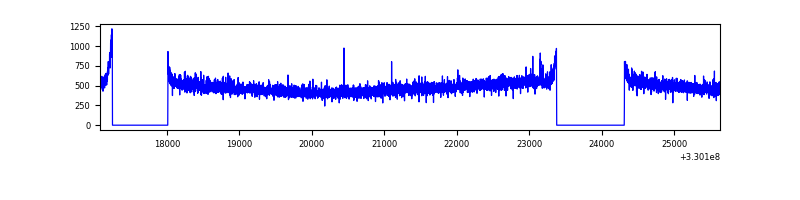 |
| C | 8549 | 6851 | 1 | 1 | 0.01% | 0.01% | 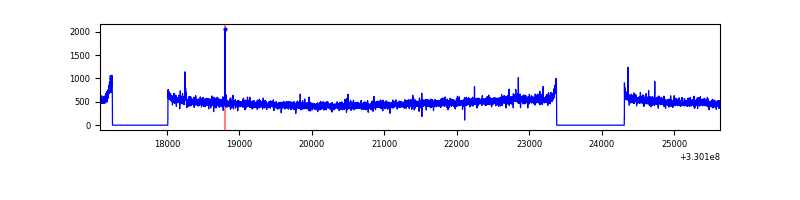 |
| D | 8550 | 6852 | 140 | 140 | 1.64% | 2.04% | 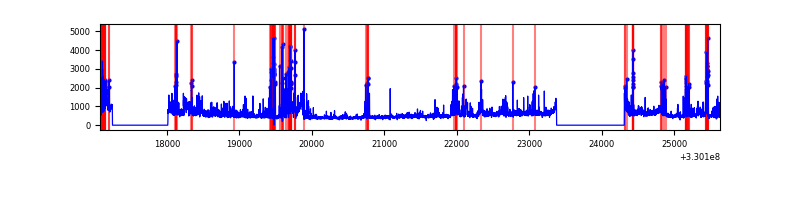 |
Top three noisy pixels from each quadrant. If the there are fewer than three noisy pixels in the level2.evt file, extra rows are filled as -1
| Pixel properties | Quadrant properties | ||||||
|---|---|---|---|---|---|---|---|
| Quadrant | DetID | PixID | Counts | Sigma | Mean | Median | Sigma |
| A | 6 | 16 | 30444 | 173.89 | 843 | 825 | 170.3 |
| A | 13 | 254 | 10021 | 53.99 | 843 | 825 | 170.3 |
| A | 3 | 137 | 8013 | 42.2 | 843 | 825 | 170.3 |
| B | 12 | 111 | 20058 | 120.03 | 839 | 817 | 160.3 |
| B | 11 | 111 | 17752 | 105.65 | 839 | 817 | 160.3 |
| B | 3 | 112 | 16479 | 97.71 | 839 | 817 | 160.3 |
| C | 14 | 238 | 127474 | 663.13 | 808 | 813 | 191.0 |
| C | 2 | 16 | 19794 | 99.37 | 808 | 813 | 191.0 |
| C | 3 | 233 | 15276 | 75.72 | 808 | 813 | 191.0 |
| D | 1 | 52 | 1278211 | 6488.61 | 808 | 783 | 196.9 |
| D | 8 | 195 | 235248 | 1190.95 | 808 | 783 | 196.9 |
| D | 2 | 244 | 61400 | 307.9 | 808 | 783 | 196.9 |
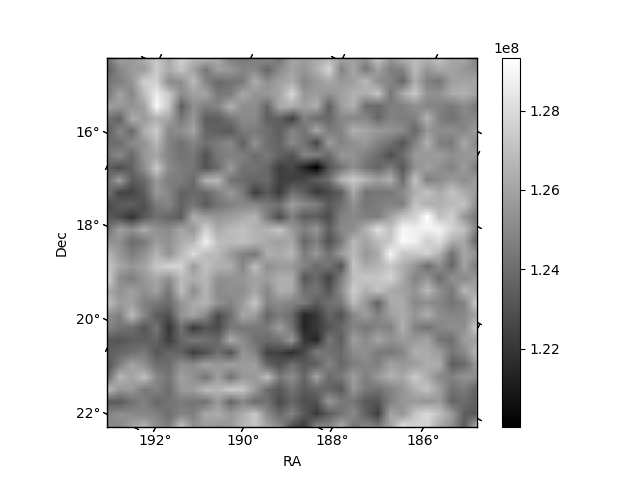
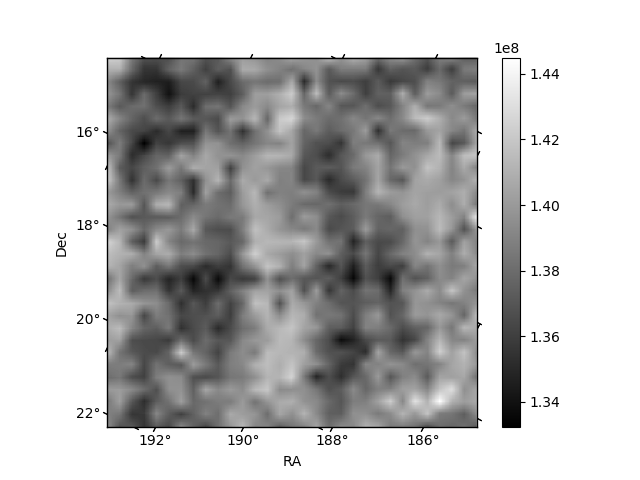
Histogram calculated using DETX and DETY for each event in the final _common_clean file
| Quadrant A |  |
 |
Quadrant B |
|---|---|---|---|
| Quadrant D |  |
 |
Quadrant C |
| Plot type | Count rate plots | Images |
|---|---|---|
| Comparison with Poisson distribution Blue bars denote a histogram of data divided into 1 sec bins. Red curve is a Poisson curve with rate = median count rate of data. |
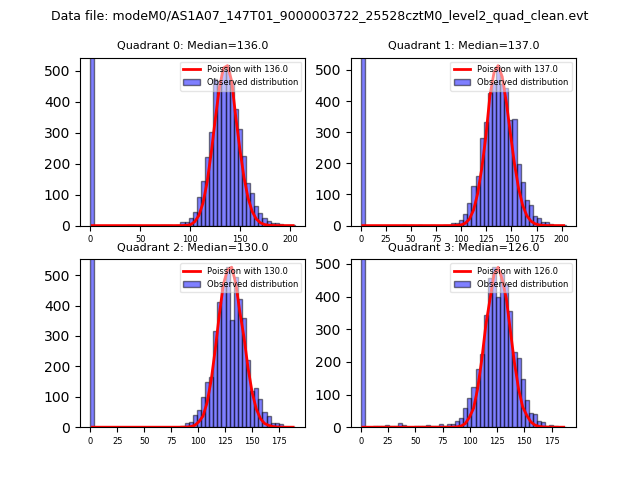 |
 |
| Quadrant-wise count rates Data is divided into 100 sec bins |
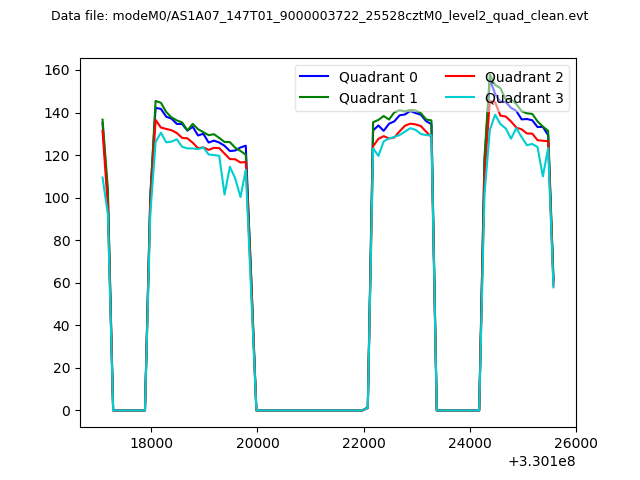 |
|
| Module-wise count rates for Quadrant A Data is divided into 100 sec bins |
 |
 |
| Module-wise count rates for Quadrant B Data is divided into 100 sec bins |
 |
 |
| Module-wise count rates for Quadrant C Data is divided into 100 sec bins |
 |
 |
| Module-wise count rates for Quadrant D Data is divided into 100 sec bins |
 |
 |
| Parameter | Plot |
|---|---|
| CZT HV Monitor |  |
| D_VDD |  |
| Temperature 1 |  |
| Veto HV Monitor |  |
| Veto LLD |  |
| Alpha Counter | 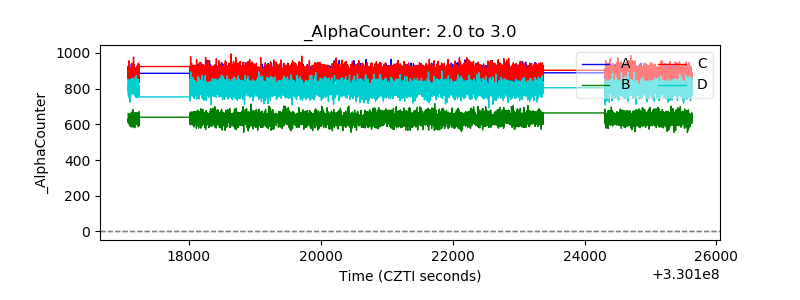 |
| _CPM_Rate | 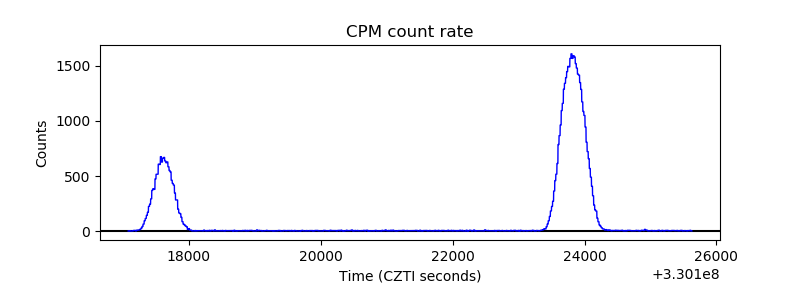 |
| CZT Counter |  |
| +2.5 Volts monitor |  |
| +5 Volts monitor |  |
| _ROLL_ROT |  |
| _Roll_DEC |  |
| _Roll_RA |  |
| Veto Counter |  |