| Param | Original file | Final file |
|---|---|---|
| Filename | modeM0/AS1A07_147T01_9000003722_25529cztM0_level2.evt | modeM0/AS1A07_147T01_9000003722_25529cztM0_level2_quad_clean.evt |
| Size (bytes) | 459,339,840 | 88,450,560 |
| Size | 438.1 MB | 84.4 MB |
| Events in quadrant A | 3,125,823 | 571,924 |
| Events in quadrant B | 3,202,032 | 583,926 |
| Events in quadrant C | 3,176,543 | 544,295 |
| Events in quadrant D | 3,967,047 | 526,814 |
| Mode M0 | |||
|---|---|---|---|
| Quadrant | BADHDUFLAG | Total packets | Discarded packets |
| A | 0 | 13289 | 0 |
| B | 0 | 13443 | 0 |
| C | 0 | 13399 | 0 |
| D | 0 | 16052 | 0 |
| Mode M9 | |||
|---|---|---|---|
| Quadrant | BADHDUFLAG | Total packets | Discarded packets |
| A | 0 | 13 | 0 |
| B | 0 | 14 | 0 |
| C | 0 | 14 | 0 |
| D | 0 | 14 | 0 |
| Quadrant | Total seconds | Saturated seconds | Saturation percentage |
|---|---|---|---|
| A | 6479 | 26 | 0.401296% |
| B | 6479 | 30 | 0.463034% |
| C | 6479 | 63 | 0.972372% |
| D | 6478 | 80 | 1.234949% |
Noise dominated data is calculated using 1-second bins in cleaned event files. If a bin has >2000 counts, and if more than 50% of those come from <1% of pixels, then it is considered to be noise-dominated and hence unusable.
| Quadrant | # 1 sec bins | Bins with >0 counts | Bins with >2000 counts | High rate bins dominated by noise | Noise dominated (total time) | Noise dominated (detector-on time) | Marked lightcurve |
|---|---|---|---|---|---|---|---|
| A | 7559 | 6480 | 0 | 0 | 0.00% | 0.00% | 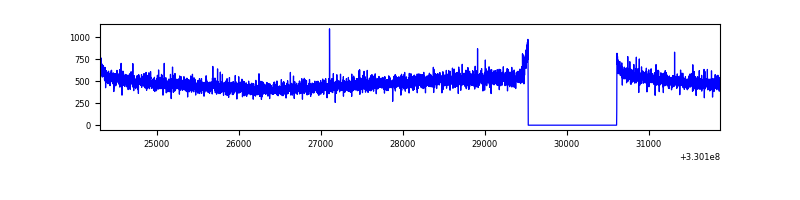 |
| B | 7559 | 6480 | 0 | 0 | 0.00% | 0.00% | 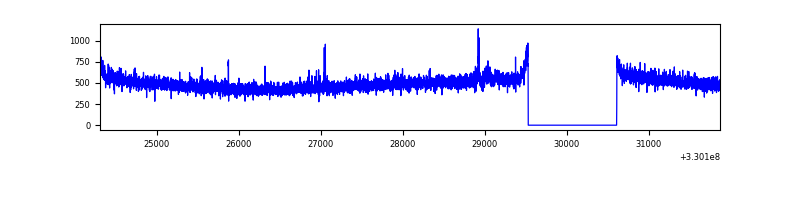 |
| C | 7559 | 6480 | 0 | 0 | 0.00% | 0.00% | 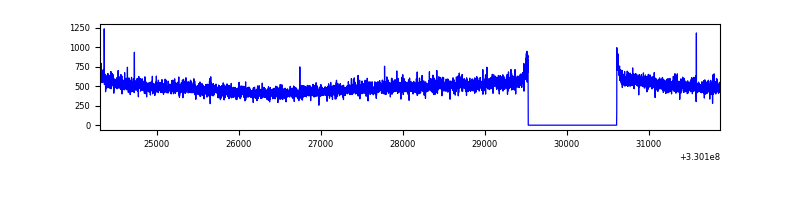 |
| D | 7558 | 6479 | 65 | 65 | 0.86% | 1.00% | 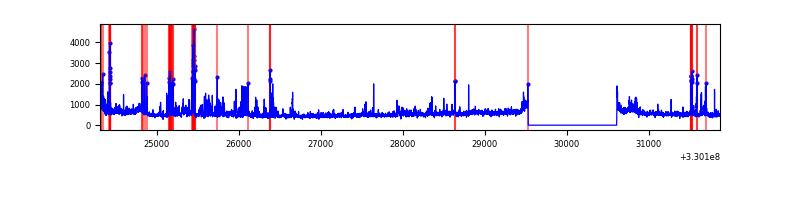 |
Top three noisy pixels from each quadrant. If the there are fewer than three noisy pixels in the level2.evt file, extra rows are filled as -1
| Pixel properties | Quadrant properties | ||||||
|---|---|---|---|---|---|---|---|
| Quadrant | DetID | PixID | Counts | Sigma | Mean | Median | Sigma |
| A | 13 | 254 | 9521 | 53.14 | 810 | 794 | 164.2 |
| A | 3 | 137 | 7251 | 39.32 | 810 | 794 | 164.2 |
| A | 0 | 226 | 6902 | 37.19 | 810 | 794 | 164.2 |
| B | 12 | 111 | 18842 | 117.39 | 809 | 790 | 153.8 |
| B | 11 | 111 | 16765 | 103.88 | 809 | 790 | 153.8 |
| B | 0 | 190 | 15861 | 98.0 | 809 | 790 | 153.8 |
| C | 14 | 238 | 125268 | 688.41 | 773 | 780 | 180.8 |
| C | 3 | 233 | 32156 | 173.51 | 773 | 780 | 180.8 |
| C | 2 | 16 | 8797 | 44.33 | 773 | 780 | 180.8 |
| D | 1 | 52 | 784325 | 4167.02 | 776 | 754 | 188.0 |
| D | 8 | 195 | 224666 | 1190.76 | 776 | 754 | 188.0 |
| D | 2 | 234 | 25873 | 133.58 | 776 | 754 | 188.0 |
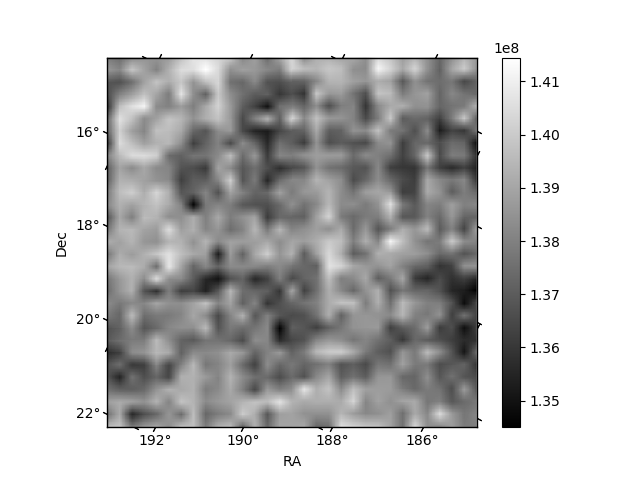
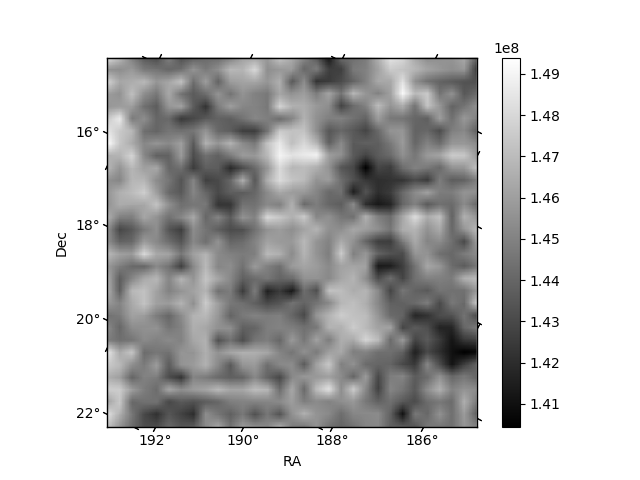
Histogram calculated using DETX and DETY for each event in the final _common_clean file
| Quadrant A | 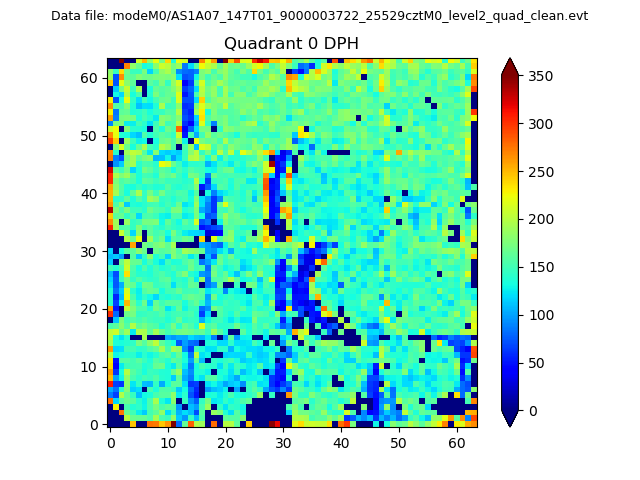 |
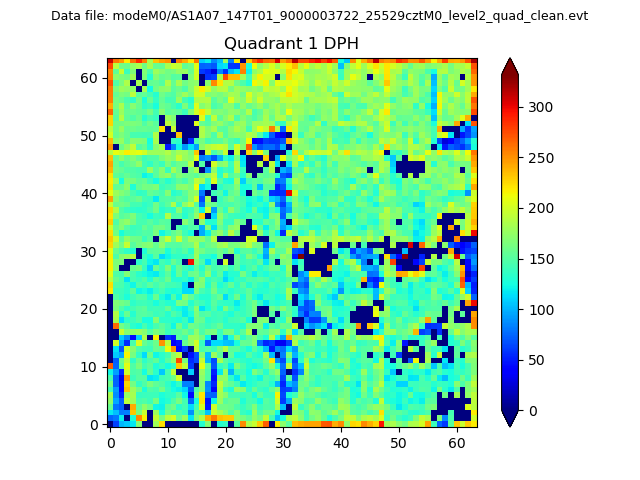 |
Quadrant B |
|---|---|---|---|
| Quadrant D |  |
 |
Quadrant C |
| Plot type | Count rate plots | Images |
|---|---|---|
| Comparison with Poisson distribution Blue bars denote a histogram of data divided into 1 sec bins. Red curve is a Poisson curve with rate = median count rate of data. |
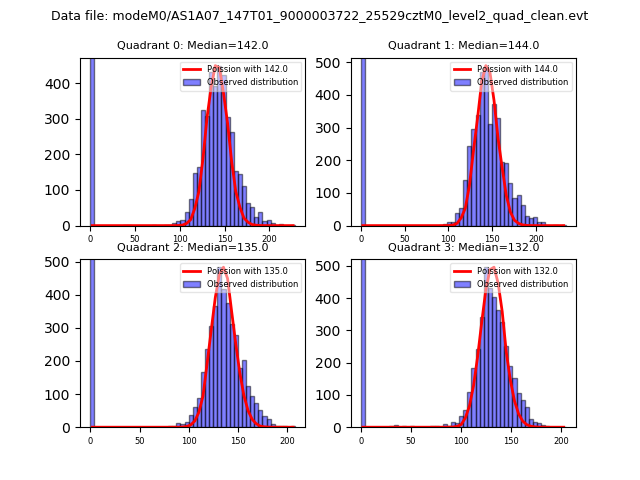 |
 |
| Quadrant-wise count rates Data is divided into 100 sec bins |
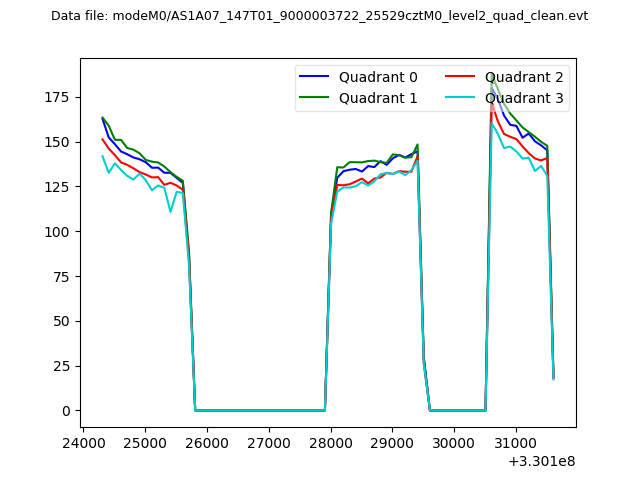 |
|
| Module-wise count rates for Quadrant A Data is divided into 100 sec bins |
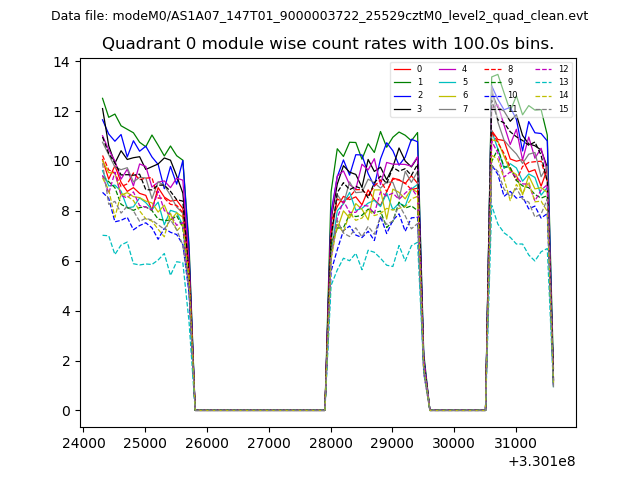 |
 |
| Module-wise count rates for Quadrant B Data is divided into 100 sec bins |
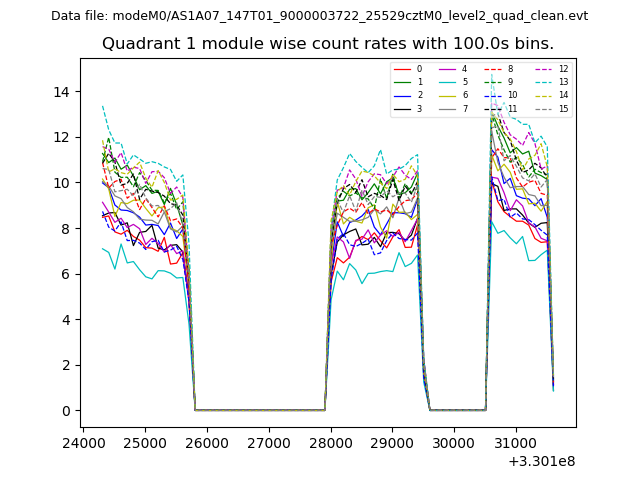 |
 |
| Module-wise count rates for Quadrant C Data is divided into 100 sec bins |
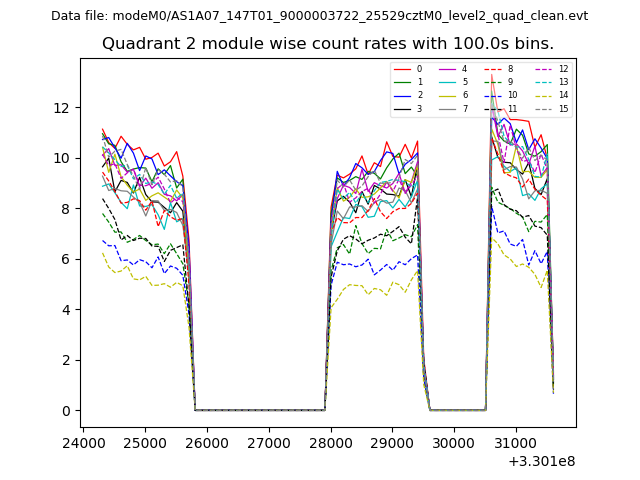 |
 |
| Module-wise count rates for Quadrant D Data is divided into 100 sec bins |
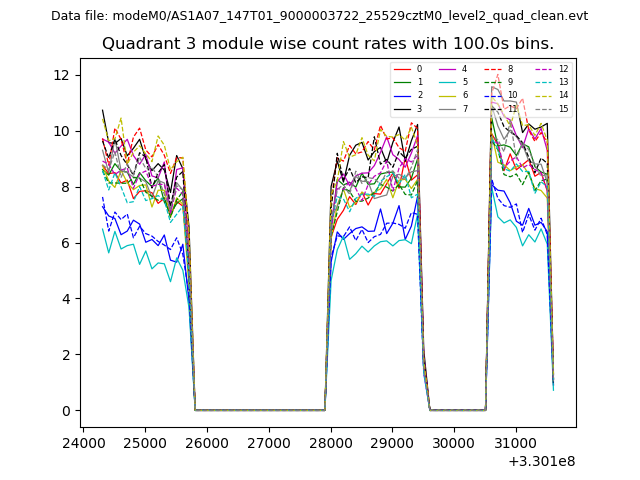 |
 |
| Parameter | Plot |
|---|---|
| CZT HV Monitor | 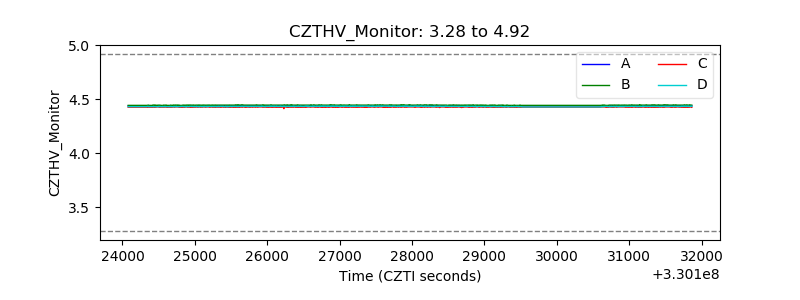 |
| D_VDD | 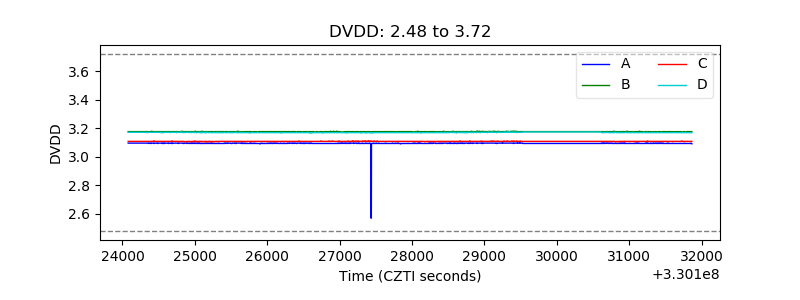 |
| Temperature 1 | 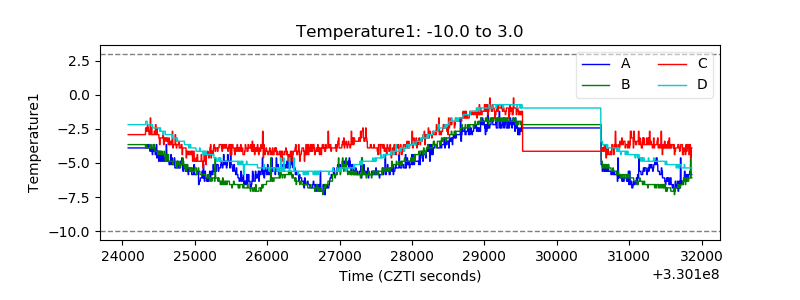 |
| Veto HV Monitor | 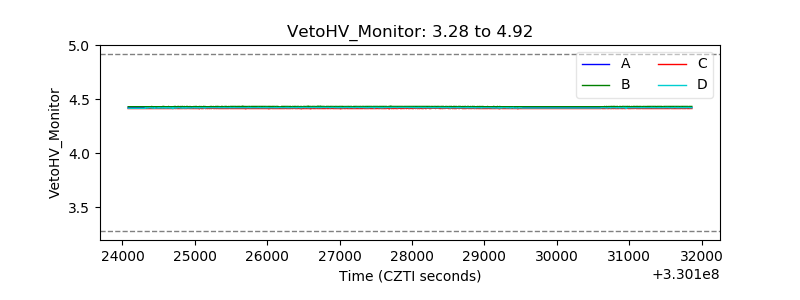 |
| Veto LLD | 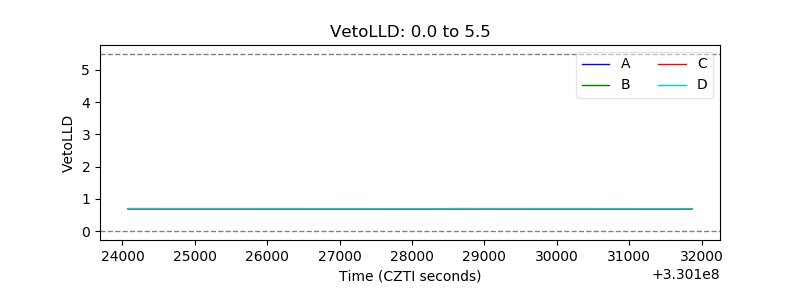 |
| Alpha Counter | 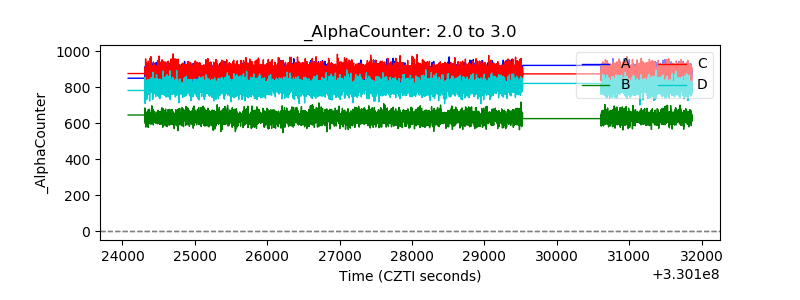 |
| _CPM_Rate | 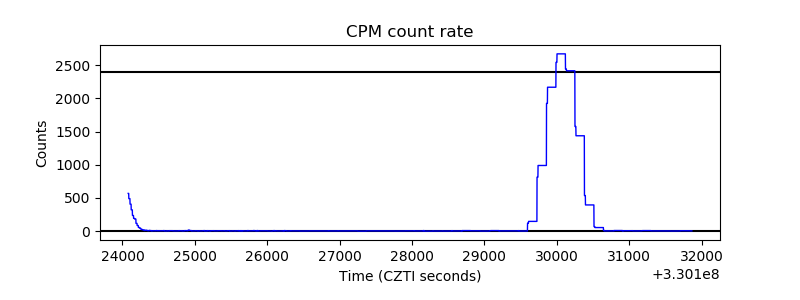 |
| CZT Counter |  |
| +2.5 Volts monitor |  |
| +5 Volts monitor | 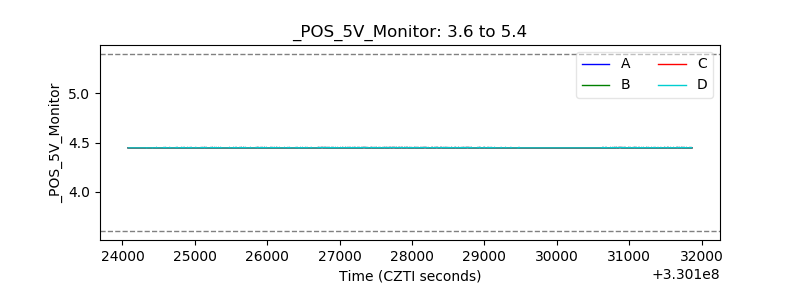 |
| _ROLL_ROT | 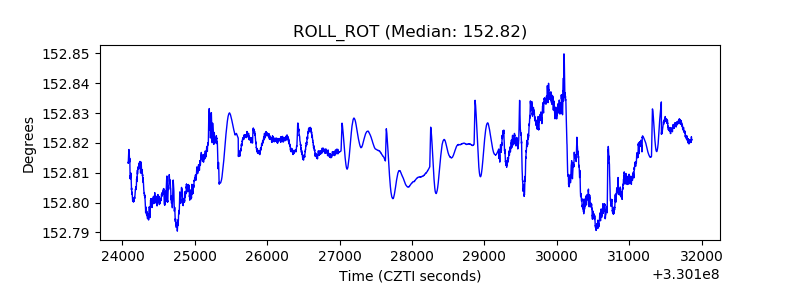 |
| _Roll_DEC | 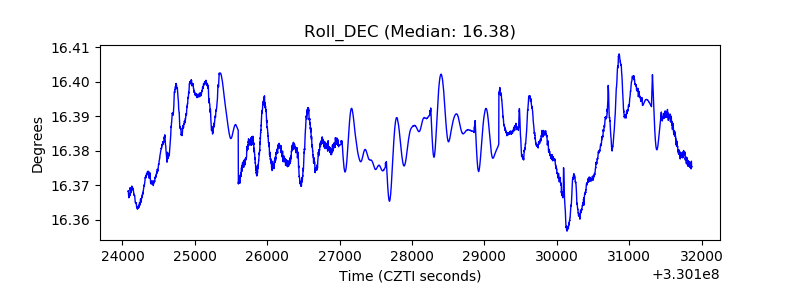 |
| _Roll_RA |  |
| Veto Counter | 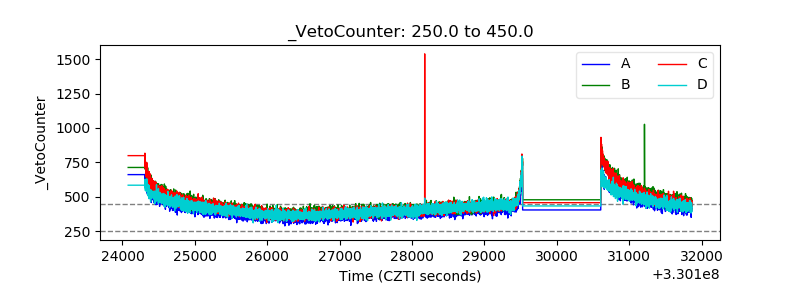 |