| Param | Original file | Final file |
|---|---|---|
| Filename | modeM0/AS1A07_147T01_9000003722_25531cztM0_level2.evt | modeM0/AS1A07_147T01_9000003722_25531cztM0_level2_quad_clean.evt |
| Size (bytes) | 452,799,360 | 82,065,600 |
| Size | 431.8 MB | 78.3 MB |
| Events in quadrant A | 3,198,146 | 525,402 |
| Events in quadrant B | 3,288,471 | 539,912 |
| Events in quadrant C | 3,377,515 | 496,055 |
| Events in quadrant D | 3,418,819 | 481,854 |
| Mode M0 | |||
|---|---|---|---|
| Quadrant | BADHDUFLAG | Total packets | Discarded packets |
| A | 0 | 13291 | 0 |
| B | 0 | 13519 | 0 |
| C | 0 | 13878 | 0 |
| D | 0 | 14017 | 0 |
| Mode M9 | |||
|---|---|---|---|
| Quadrant | BADHDUFLAG | Total packets | Discarded packets |
| A | 0 | 19 | 0 |
| B | 0 | 20 | 0 |
| C | 0 | 20 | 0 |
| D | 0 | 20 | 0 |
| Quadrant | Total seconds | Saturated seconds | Saturation percentage |
|---|---|---|---|
| A | 6334 | 22 | 0.347332% |
| B | 6334 | 33 | 0.520998% |
| C | 6334 | 92 | 1.452479% |
| D | 6334 | 33 | 0.520998% |
Noise dominated data is calculated using 1-second bins in cleaned event files. If a bin has >2000 counts, and if more than 50% of those come from <1% of pixels, then it is considered to be noise-dominated and hence unusable.
| Quadrant | # 1 sec bins | Bins with >0 counts | Bins with >2000 counts | High rate bins dominated by noise | Noise dominated (total time) | Noise dominated (detector-on time) | Marked lightcurve |
|---|---|---|---|---|---|---|---|
| A | 7524 | 6335 | 0 | 0 | 0.00% | 0.00% | 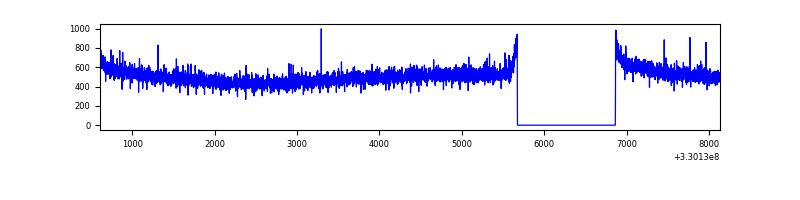 |
| B | 7524 | 6335 | 0 | 0 | 0.00% | 0.00% | 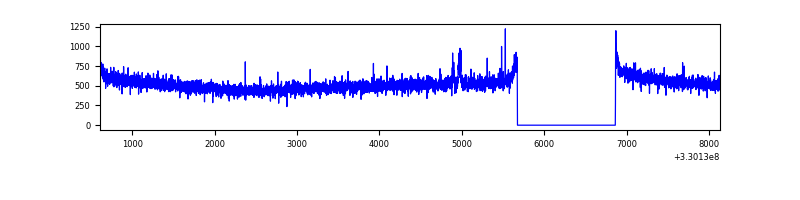 |
| C | 7524 | 6335 | 5 | 5 | 0.07% | 0.08% | 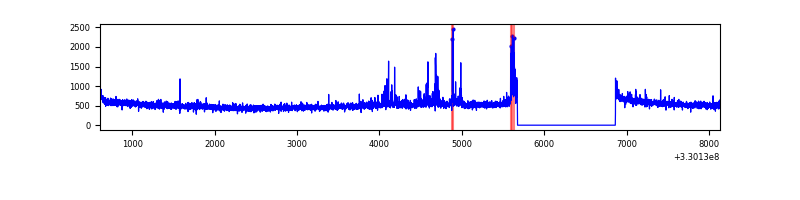 |
| D | 7524 | 6335 | 24 | 24 | 0.32% | 0.38% | 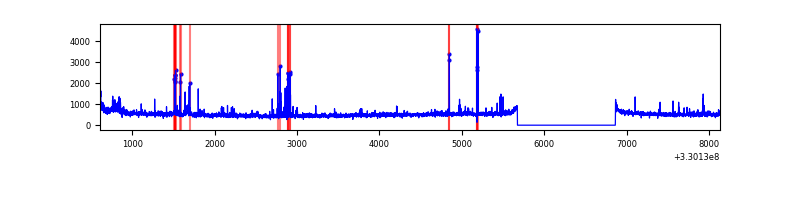 |
Top three noisy pixels from each quadrant. If the there are fewer than three noisy pixels in the level2.evt file, extra rows are filled as -1
| Pixel properties | Quadrant properties | ||||||
|---|---|---|---|---|---|---|---|
| Quadrant | DetID | PixID | Counts | Sigma | Mean | Median | Sigma |
| A | 13 | 254 | 9197 | 50.69 | 829 | 813 | 165.4 |
| A | 3 | 137 | 7307 | 39.26 | 829 | 813 | 165.4 |
| A | 0 | 226 | 7063 | 37.79 | 829 | 813 | 165.4 |
| B | 12 | 111 | 18960 | 114.82 | 831 | 812 | 158.1 |
| B | 0 | 190 | 18425 | 111.43 | 831 | 812 | 158.1 |
| B | 11 | 111 | 16924 | 101.94 | 831 | 812 | 158.1 |
| C | 3 | 233 | 167434 | 900.97 | 789 | 795 | 185.0 |
| C | 14 | 238 | 127963 | 687.56 | 789 | 795 | 185.0 |
| C | 2 | 16 | 9775 | 48.55 | 789 | 795 | 185.0 |
| D | 1 | 52 | 254533 | 1318.05 | 790 | 767 | 192.5 |
| D | 8 | 195 | 145970 | 754.18 | 790 | 767 | 192.5 |
| D | 2 | 234 | 21973 | 110.14 | 790 | 767 | 192.5 |
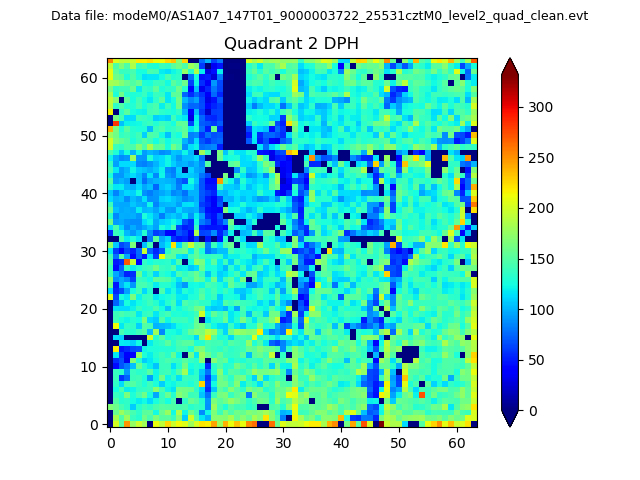
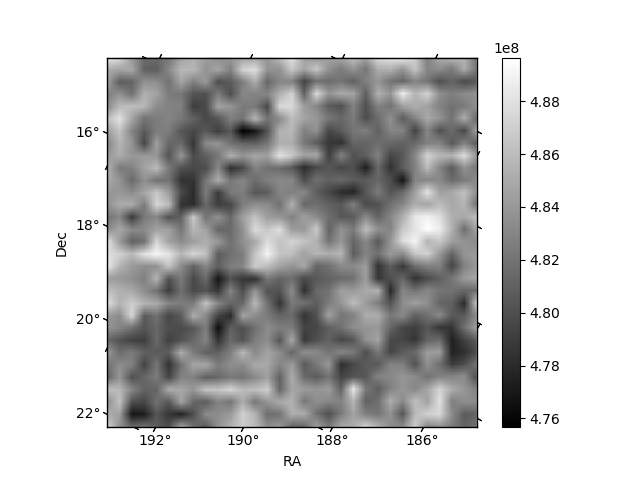
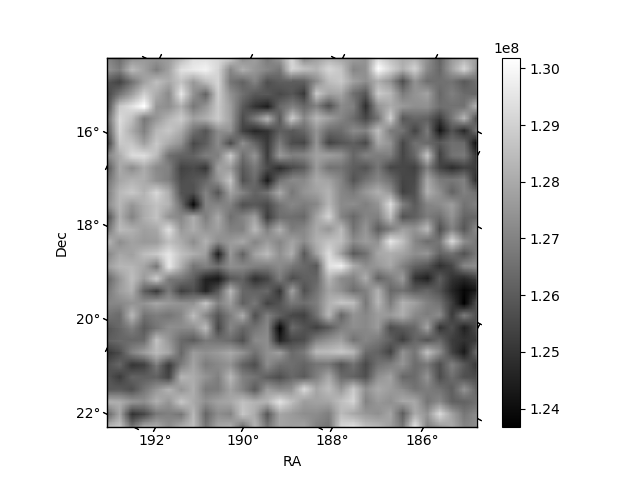
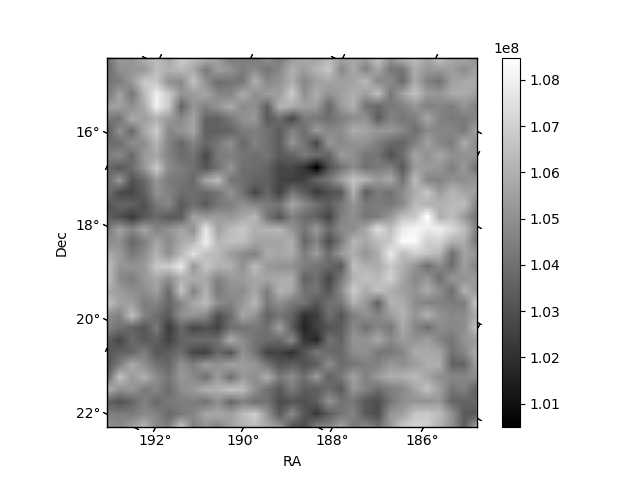
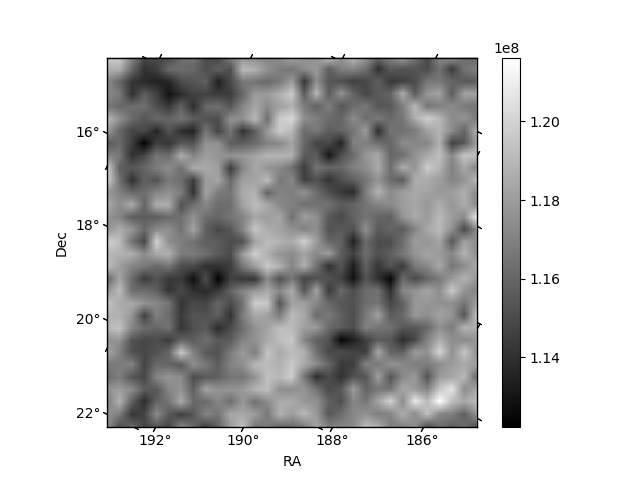
Histogram calculated using DETX and DETY for each event in the final _common_clean file
| Quadrant A | 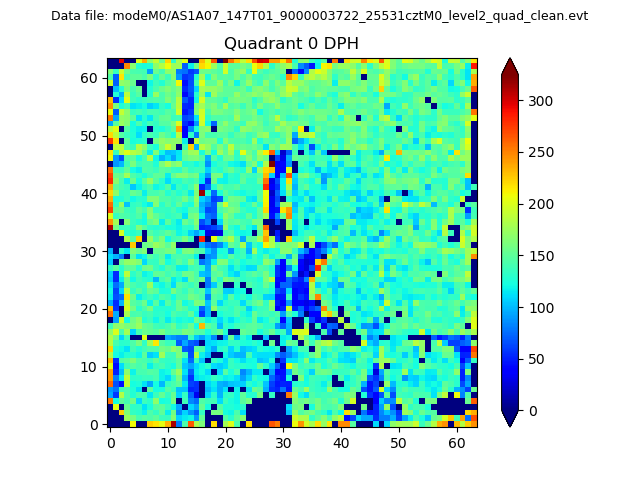 |
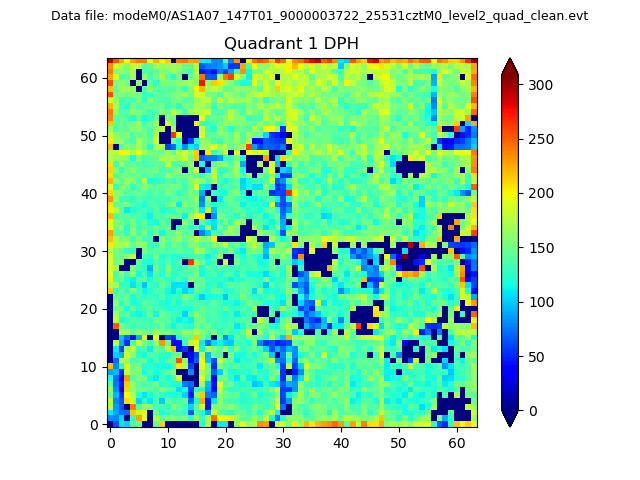 |
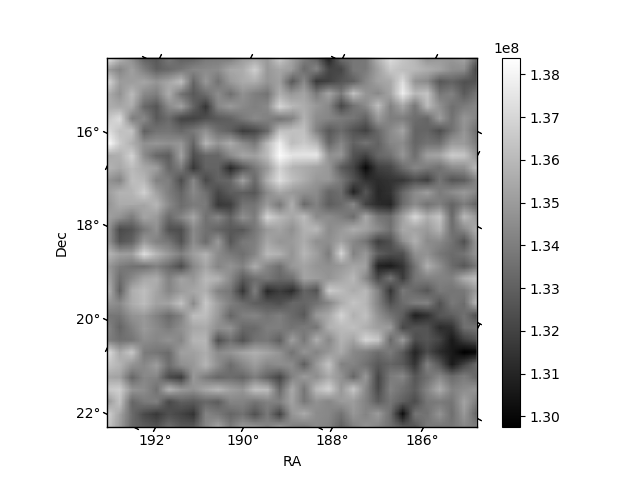
Quadrant B |
|---|---|---|---|
| Quadrant D | 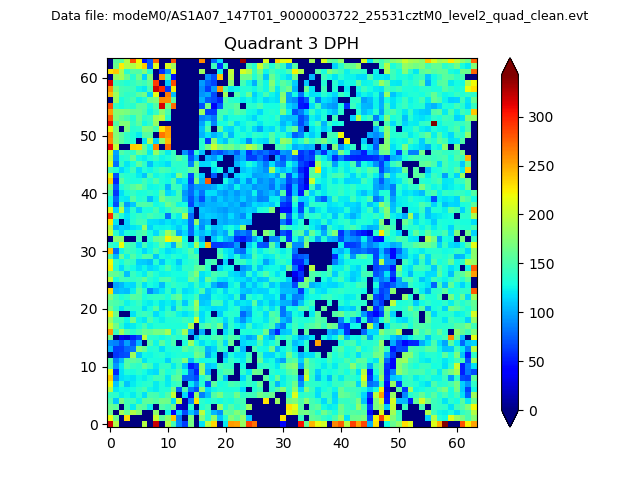 |
 |
Quadrant C |
| Plot type | Count rate plots | Images |
|---|---|---|
| Comparison with Poisson distribution Blue bars denote a histogram of data divided into 1 sec bins. Red curve is a Poisson curve with rate = median count rate of data. |
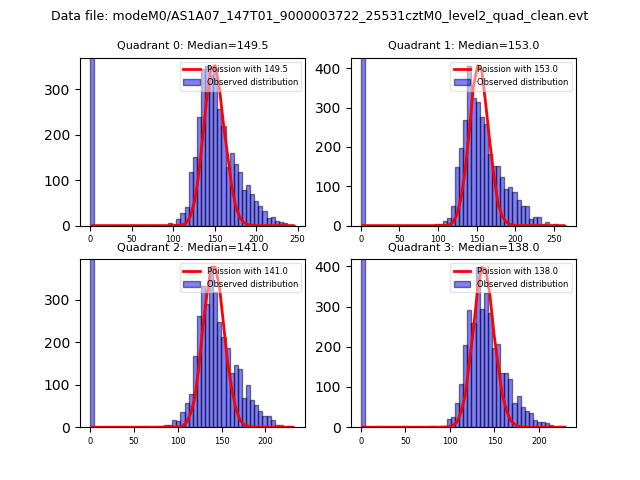 |
 |
| Quadrant-wise count rates Data is divided into 100 sec bins |
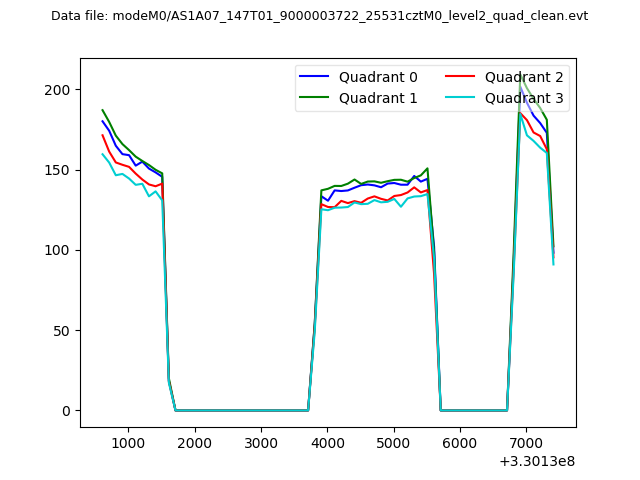 |
|
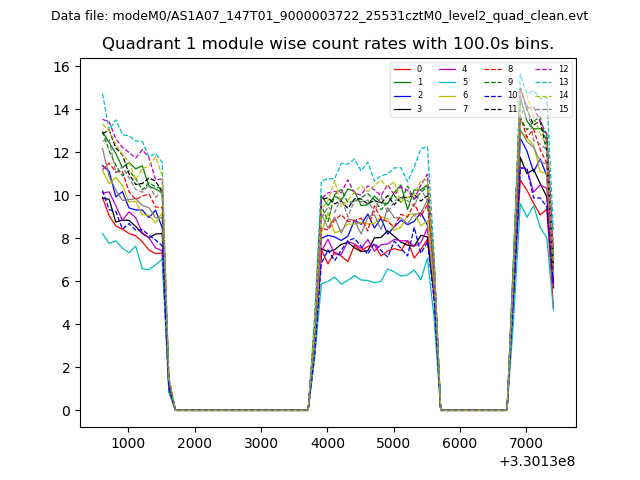
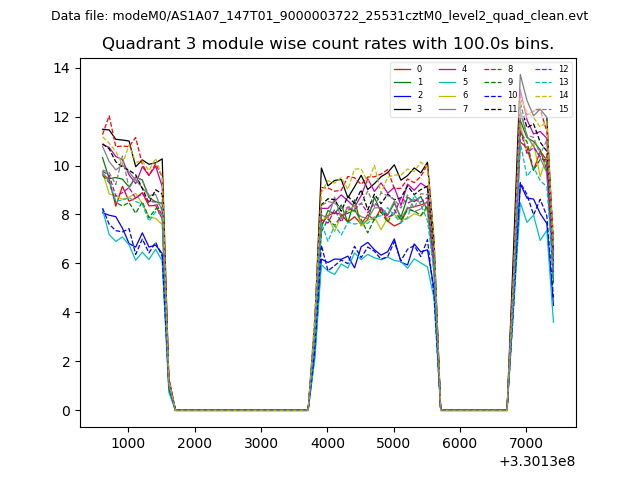
| Module-wise count rates for Quadrant A Data is divided into 100 sec bins |
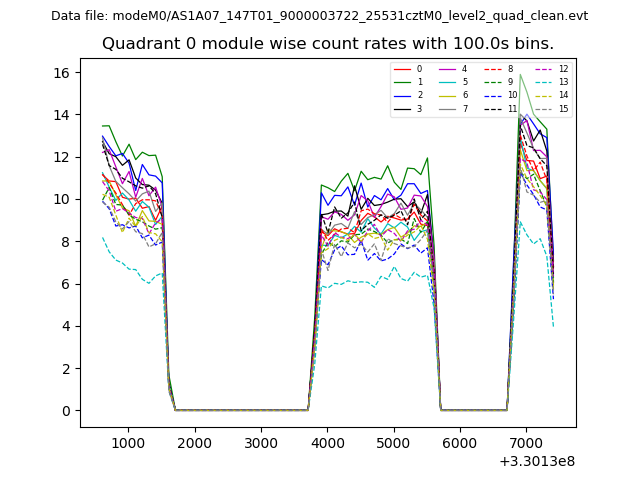 |
 |
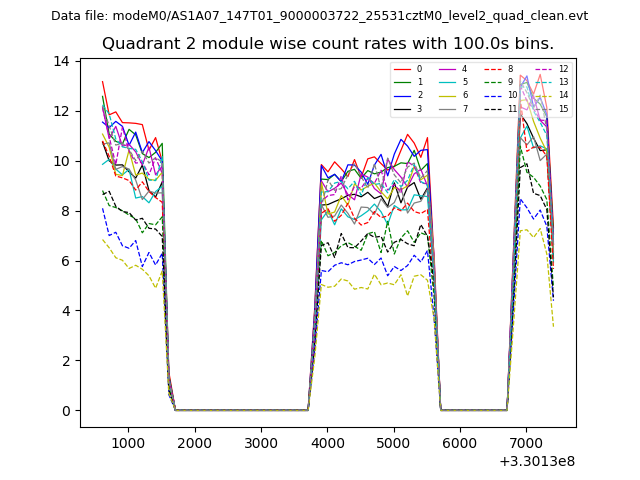
| Module-wise count rates for Quadrant B Data is divided into 100 sec bins |
 |
 |
| Module-wise count rates for Quadrant C Data is divided into 100 sec bins |
 |
 |
| Module-wise count rates for Quadrant D Data is divided into 100 sec bins |
 |
 |
| Parameter | Plot |
|---|---|
| CZT HV Monitor | 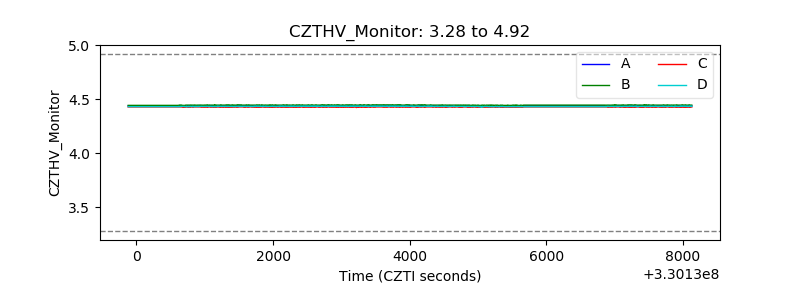 |
| D_VDD | 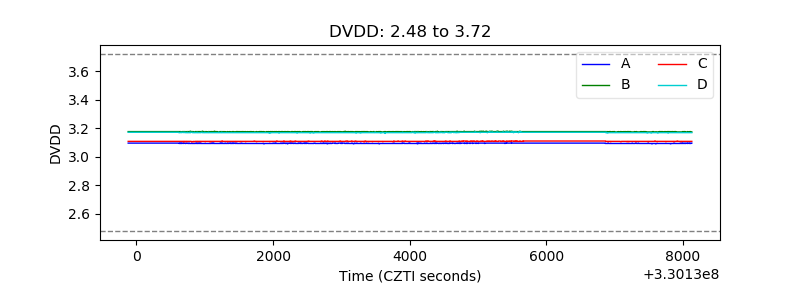 |
| Temperature 1 | 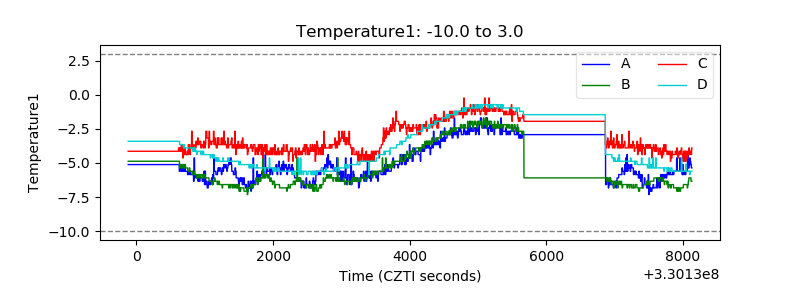 |
| Veto HV Monitor | 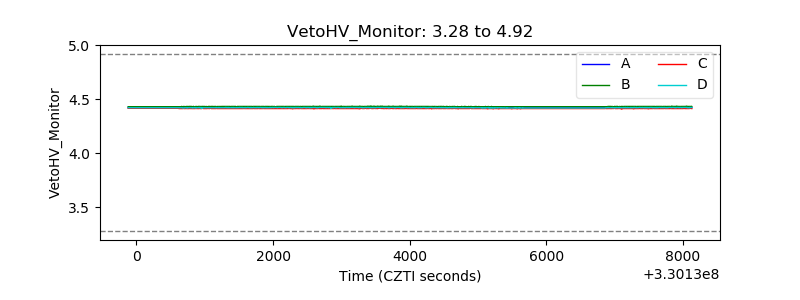 |
| Veto LLD | 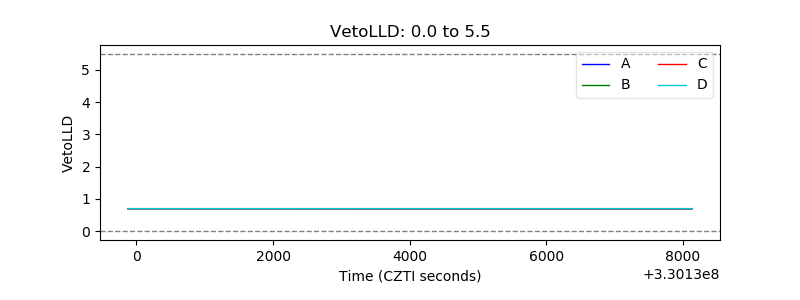 |
| Alpha Counter |  |
| _CPM_Rate | 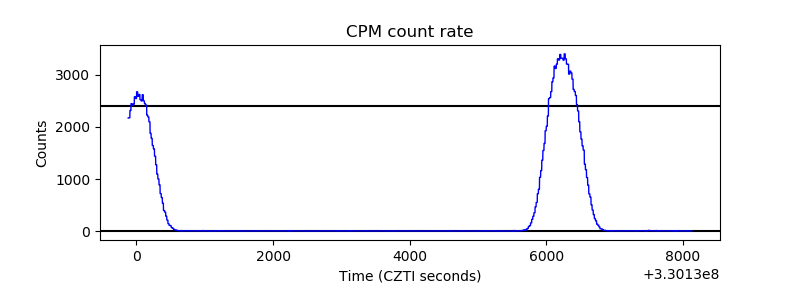 |
| CZT Counter | 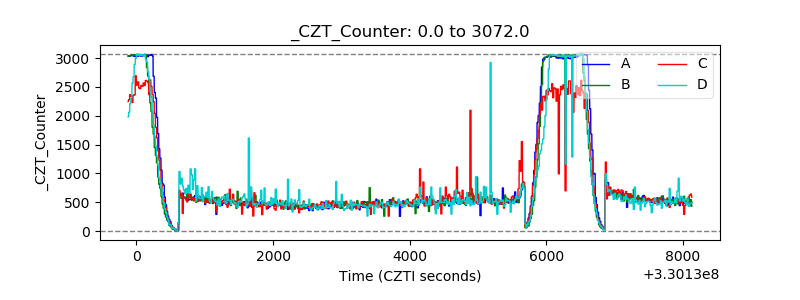 |
| +2.5 Volts monitor |  |
| +5 Volts monitor | 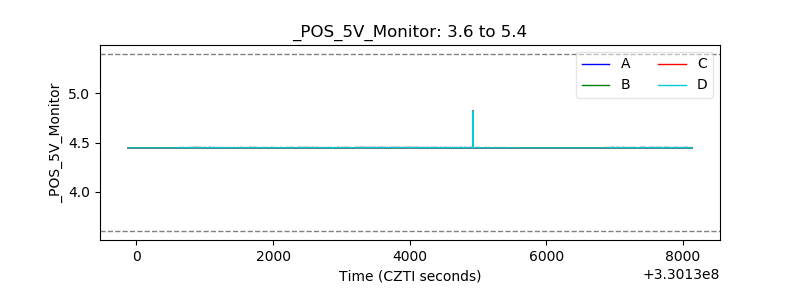 |
| _ROLL_ROT | 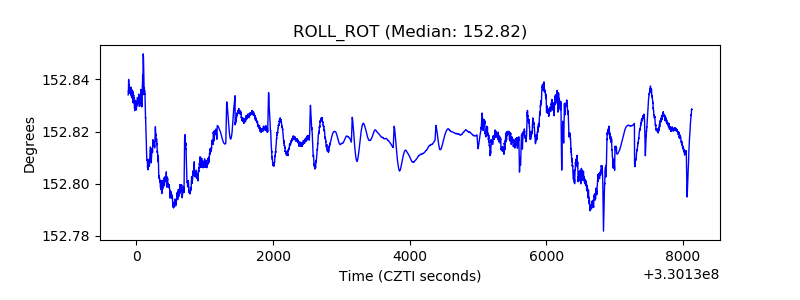 |
| _Roll_DEC | 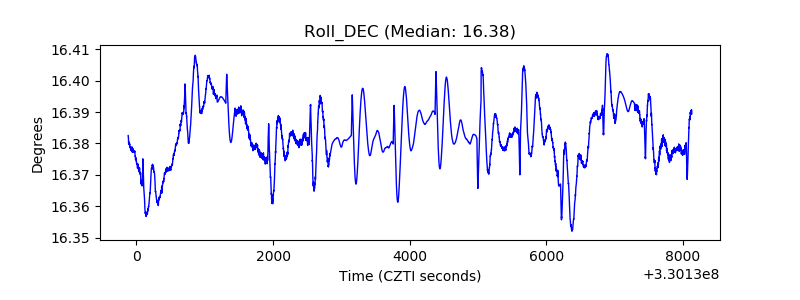 |
| _Roll_RA | 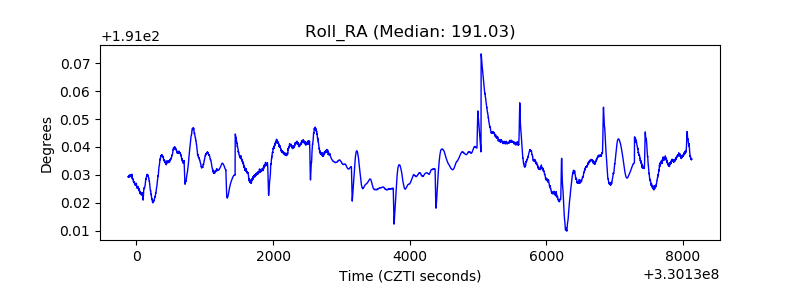 |
| Veto Counter | 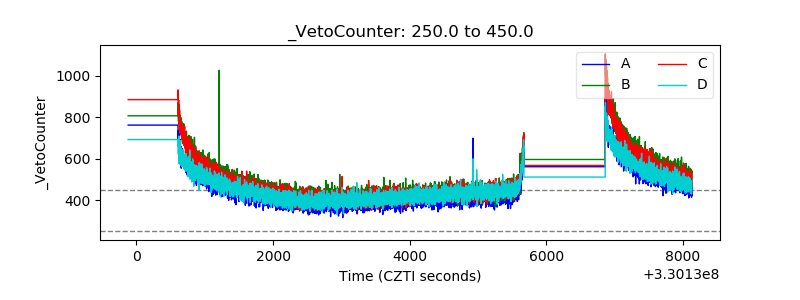 |