| Param | Original file | Final file |
|---|---|---|
| Filename | modeM0/AS1A07_147T01_9000003722_25532cztM0_level2.evt | modeM0/AS1A07_147T01_9000003722_25532cztM0_level2_quad_clean.evt |
| Size (bytes) | 489,801,600 | 79,064,640 |
| Size | 467.1 MB | 75.4 MB |
| Events in quadrant A | 3,507,930 | 498,575 |
| Events in quadrant B | 3,601,994 | 512,141 |
| Events in quadrant C | 3,582,586 | 469,031 |
| Events in quadrant D | 3,697,360 | 458,270 |
| Mode M0 | |||
|---|---|---|---|
| Quadrant | BADHDUFLAG | Total packets | Discarded packets |
| A | 0 | 14225 | 0 |
| B | 0 | 14535 | 0 |
| C | 0 | 14503 | 0 |
| D | 0 | 14991 | 0 |
| Mode M9 | |||
|---|---|---|---|
| Quadrant | BADHDUFLAG | Total packets | Discarded packets |
| A | 0 | 25 | 0 |
| B | 0 | 25 | 0 |
| C | 0 | 25 | 0 |
| D | 0 | 25 | 0 |
| Quadrant | Total seconds | Saturated seconds | Saturation percentage |
|---|---|---|---|
| A | 6542 | 58 | 0.886579% |
| B | 6542 | 69 | 1.054723% |
| C | 6542 | 127 | 1.941302% |
| D | 6542 | 48 | 0.733721% |
Noise dominated data is calculated using 1-second bins in cleaned event files. If a bin has >2000 counts, and if more than 50% of those come from <1% of pixels, then it is considered to be noise-dominated and hence unusable.
| Quadrant | # 1 sec bins | Bins with >0 counts | Bins with >2000 counts | High rate bins dominated by noise | Noise dominated (total time) | Noise dominated (detector-on time) | Marked lightcurve |
|---|---|---|---|---|---|---|---|
| A | 9012 | 6544 | 0 | 0 | 0.00% | 0.00% | 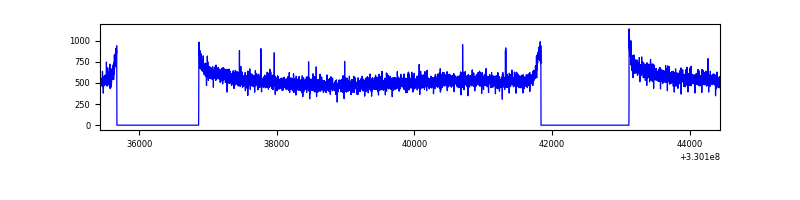 |
| B | 9012 | 6544 | 2 | 2 | 0.02% | 0.03% | 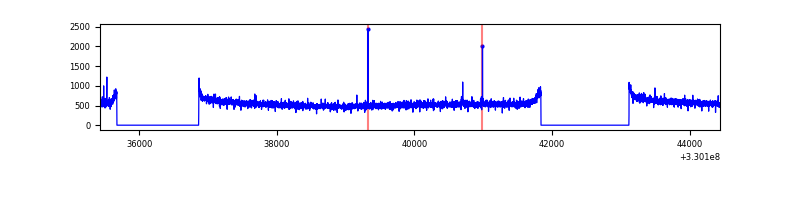 |
| C | 9012 | 6544 | 3 | 3 | 0.03% | 0.05% | 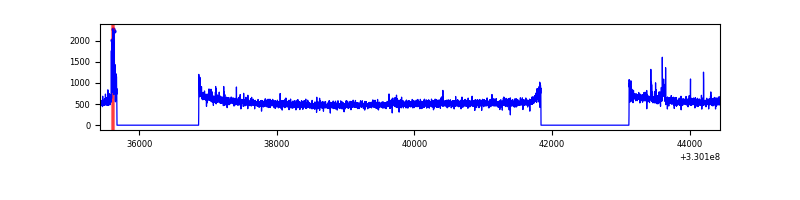 |
| D | 9012 | 6544 | 8 | 8 | 0.09% | 0.12% | 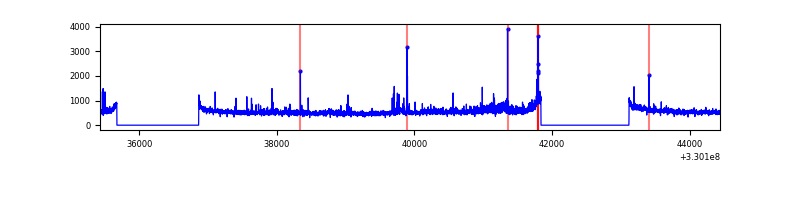 |
Top three noisy pixels from each quadrant. If the there are fewer than three noisy pixels in the level2.evt file, extra rows are filled as -1
| Pixel properties | Quadrant properties | ||||||
|---|---|---|---|---|---|---|---|
| Quadrant | DetID | PixID | Counts | Sigma | Mean | Median | Sigma |
| A | 13 | 254 | 9317 | 46.82 | 910 | 894 | 179.9 |
| A | 0 | 226 | 7797 | 38.37 | 910 | 894 | 179.9 |
| A | 3 | 137 | 7599 | 37.27 | 910 | 894 | 179.9 |
| B | 0 | 229 | 22633 | 128.15 | 911 | 893 | 169.6 |
| B | 12 | 111 | 20026 | 112.78 | 911 | 893 | 169.6 |
| B | 11 | 111 | 18078 | 101.3 | 911 | 893 | 169.6 |
| C | 14 | 238 | 141604 | 712.32 | 855 | 859 | 197.6 |
| C | 3 | 233 | 68625 | 342.97 | 855 | 859 | 197.6 |
| C | 2 | 16 | 39971 | 197.95 | 855 | 859 | 197.6 |
| D | 8 | 195 | 251813 | 1188.57 | 861 | 833 | 211.2 |
| D | 1 | 52 | 188269 | 887.64 | 861 | 833 | 211.2 |
| D | 2 | 234 | 23613 | 107.88 | 861 | 833 | 211.2 |
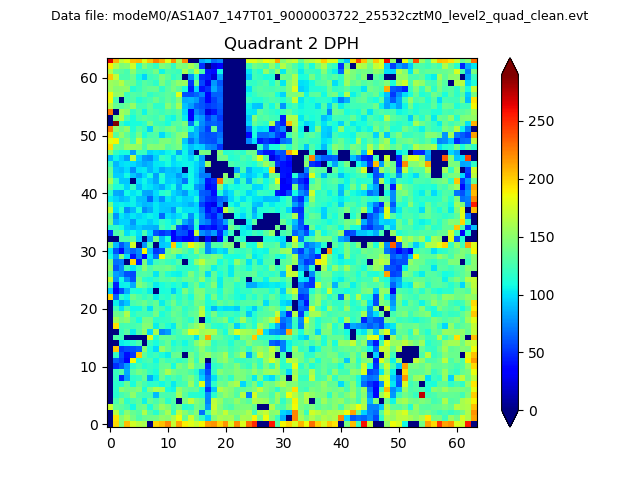
Histogram calculated using DETX and DETY for each event in the final _common_clean file
| Quadrant A | 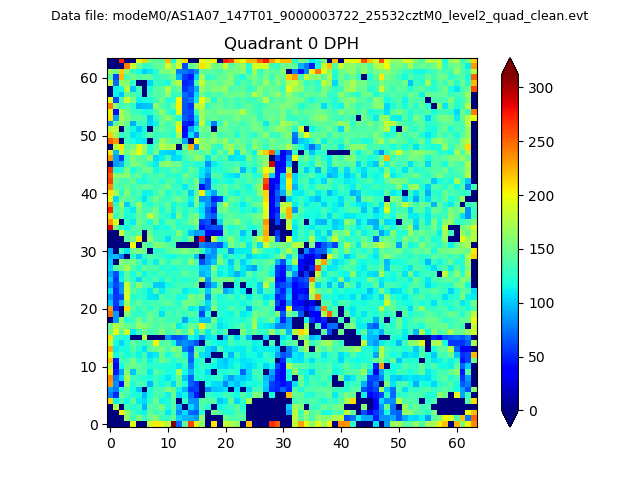 |
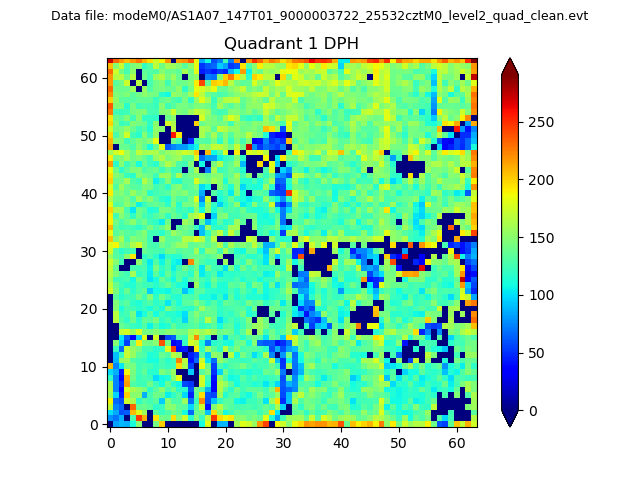 |
Quadrant B |
|---|---|---|---|
| Quadrant D | 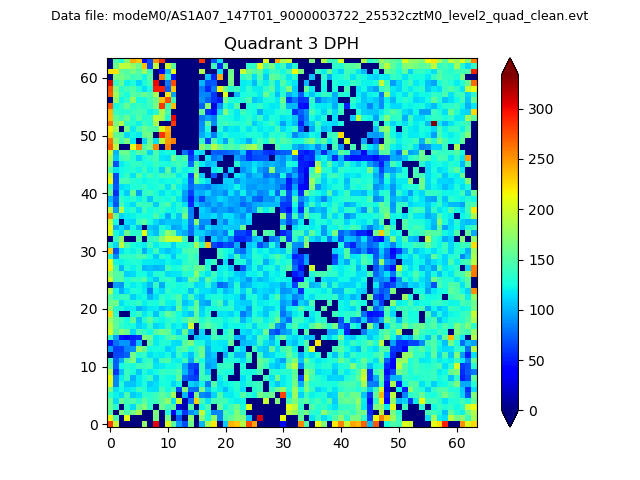 |
 |
Quadrant C |
| Plot type | Count rate plots | Images |
|---|---|---|
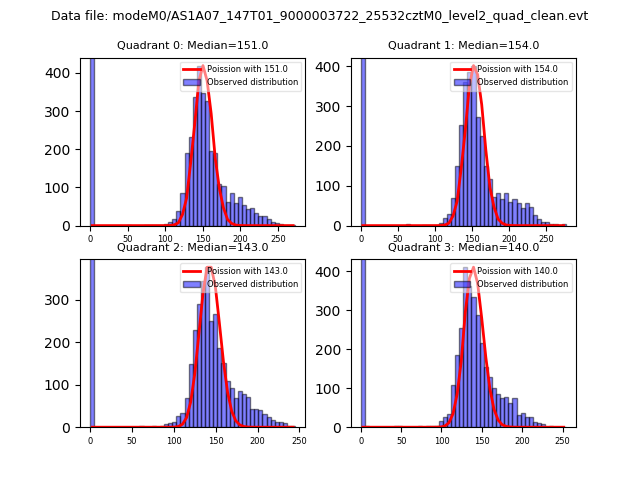
| Comparison with Poisson distribution Blue bars denote a histogram of data divided into 1 sec bins. Red curve is a Poisson curve with rate = median count rate of data. |
 |
 |
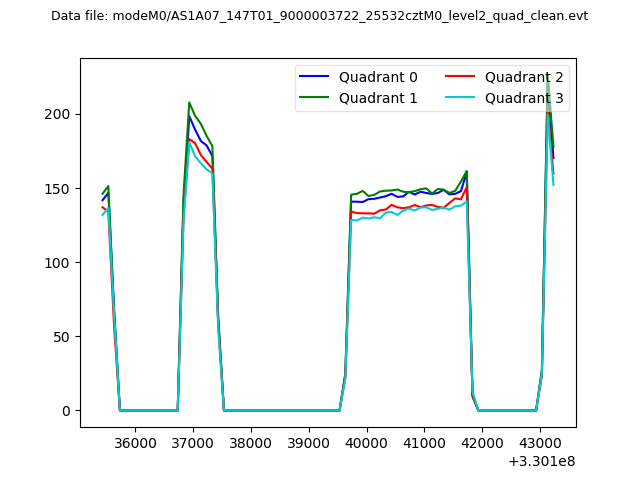
| Quadrant-wise count rates Data is divided into 100 sec bins |
 |
|
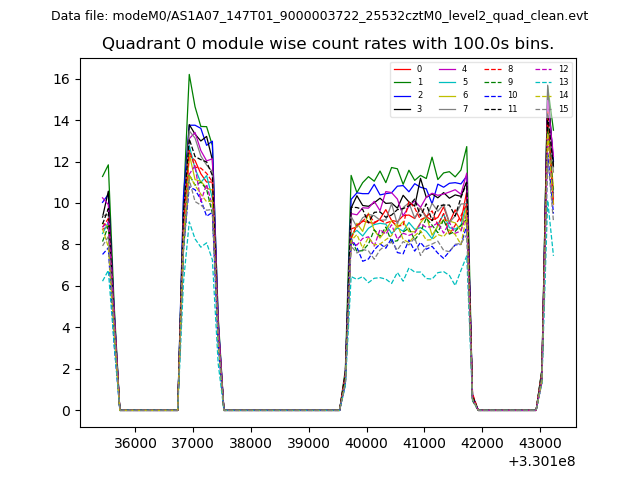
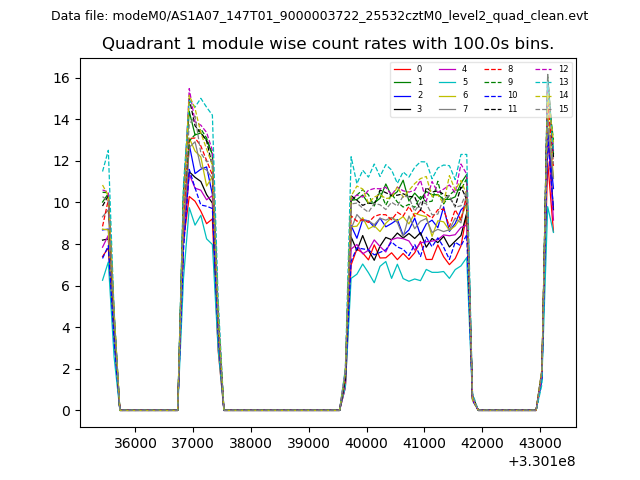
| Module-wise count rates for Quadrant A Data is divided into 100 sec bins |
 |
 |
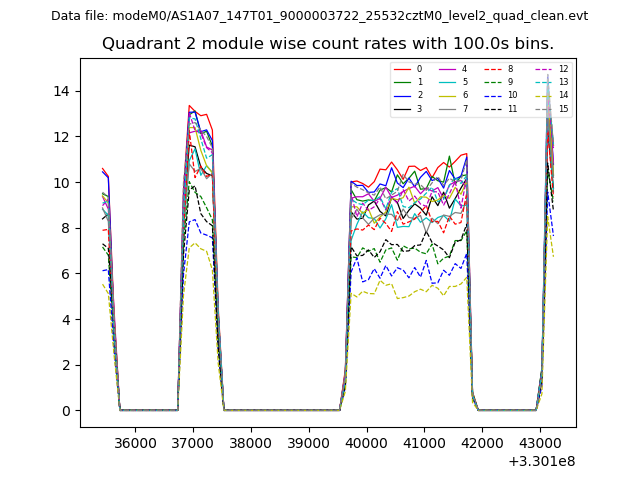
| Module-wise count rates for Quadrant B Data is divided into 100 sec bins |
 |
 |
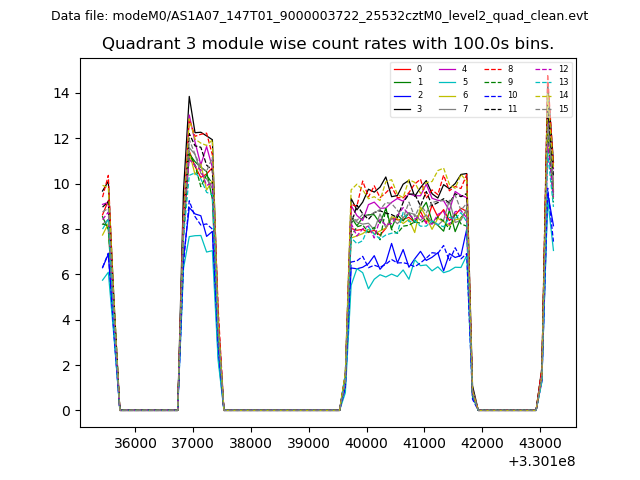
| Module-wise count rates for Quadrant C Data is divided into 100 sec bins |
 |
 |
| Module-wise count rates for Quadrant D Data is divided into 100 sec bins |
 |
 |
| Parameter | Plot |
|---|---|
| CZT HV Monitor | 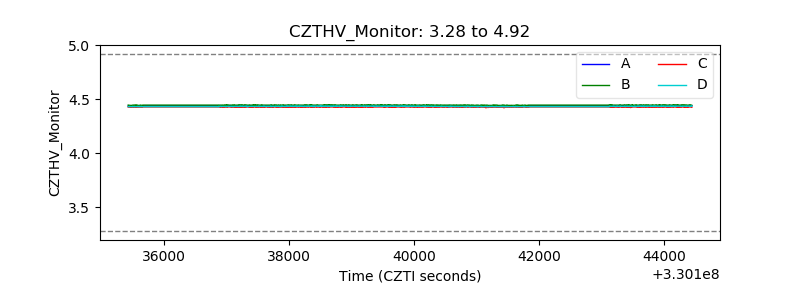 |
| D_VDD | 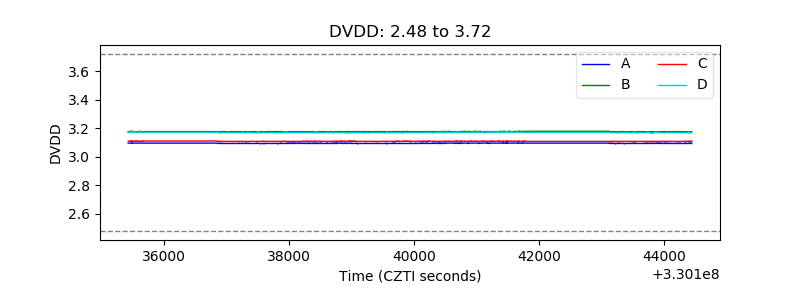 |
| Temperature 1 | 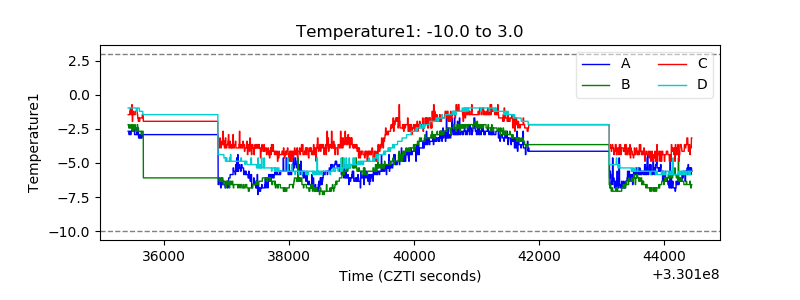 |
| Veto HV Monitor | 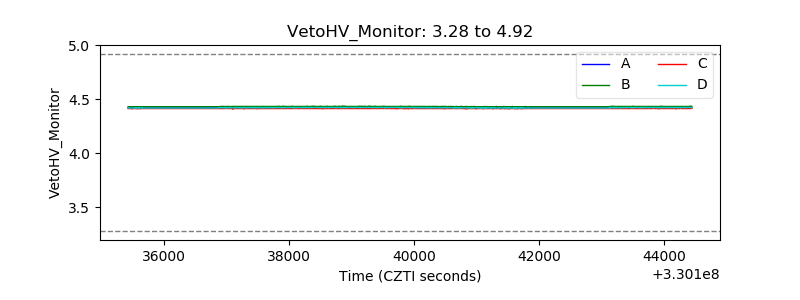 |
| Veto LLD | 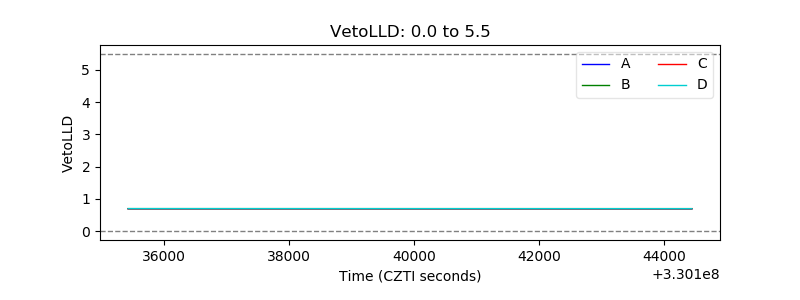 |
| Alpha Counter | 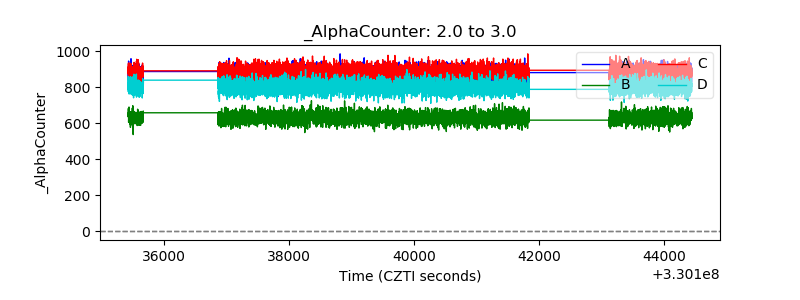 |
| _CPM_Rate | 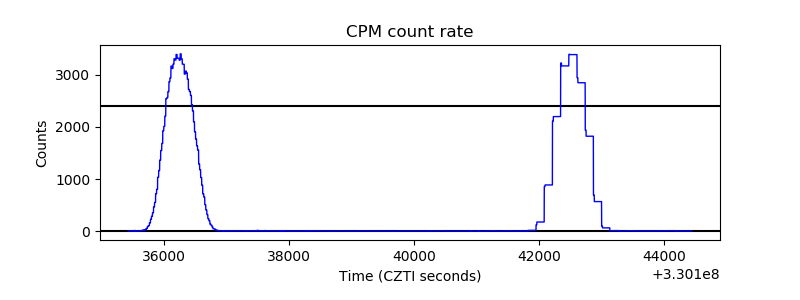 |
| CZT Counter |  |
| +2.5 Volts monitor |  |
| +5 Volts monitor |  |
| _ROLL_ROT | 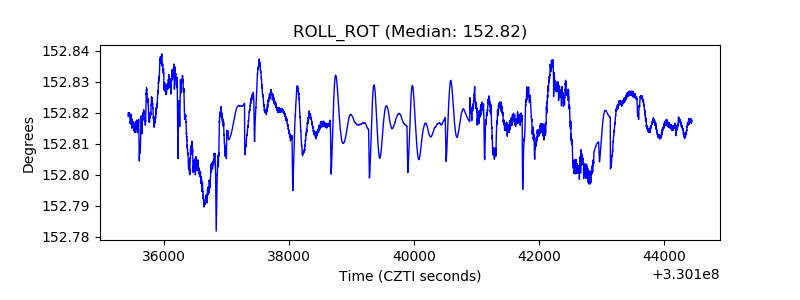 |
| _Roll_DEC | 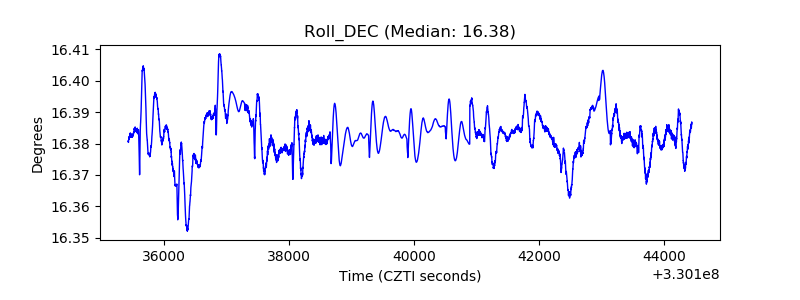 |
| _Roll_RA |  |
| Veto Counter | 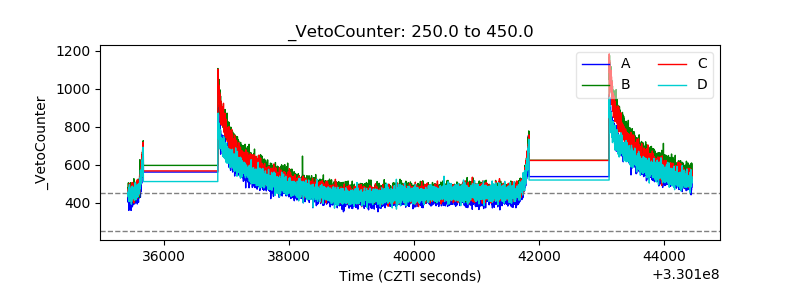 |