| Param | Original file | Final file |
|---|---|---|
| Filename | modeM0/AS1A07_147T01_9000003722_25533cztM0_level2.evt | modeM0/AS1A07_147T01_9000003722_25533cztM0_level2_quad_clean.evt |
| Size (bytes) | 495,339,840 | 67,651,200 |
| Size | 472.4 MB | 64.5 MB |
| Events in quadrant A | 3,548,833 | 414,817 |
| Events in quadrant B | 3,593,558 | 423,772 |
| Events in quadrant C | 3,563,668 | 387,636 |
| Events in quadrant D | 3,865,105 | 379,308 |
| Mode M0 | |||
|---|---|---|---|
| Quadrant | BADHDUFLAG | Total packets | Discarded packets |
| A | 0 | 14204 | 0 |
| B | 0 | 14410 | 0 |
| C | 0 | 14321 | 0 |
| D | 0 | 15469 | 0 |
| Mode M9 | |||
|---|---|---|---|
| Quadrant | BADHDUFLAG | Total packets | Discarded packets |
| A | 0 | 19 | 0 |
| B | 0 | 20 | 0 |
| C | 0 | 20 | 0 |
| D | 0 | 20 | 0 |
| Quadrant | Total seconds | Saturated seconds | Saturation percentage |
|---|---|---|---|
| A | 6341 | 67 | 1.056616% |
| B | 6341 | 81 | 1.277401% |
| C | 6341 | 113 | 1.782053% |
| D | 6340 | 42 | 0.662461% |
Noise dominated data is calculated using 1-second bins in cleaned event files. If a bin has >2000 counts, and if more than 50% of those come from <1% of pixels, then it is considered to be noise-dominated and hence unusable.
| Quadrant | # 1 sec bins | Bins with >0 counts | Bins with >2000 counts | High rate bins dominated by noise | Noise dominated (total time) | Noise dominated (detector-on time) | Marked lightcurve |
|---|---|---|---|---|---|---|---|
| A | 7661 | 6342 | 0 | 0 | 0.00% | 0.00% | 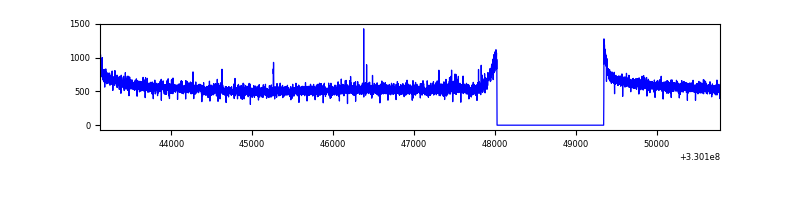 |
| B | 7661 | 6342 | 0 | 0 | 0.00% | 0.00% | 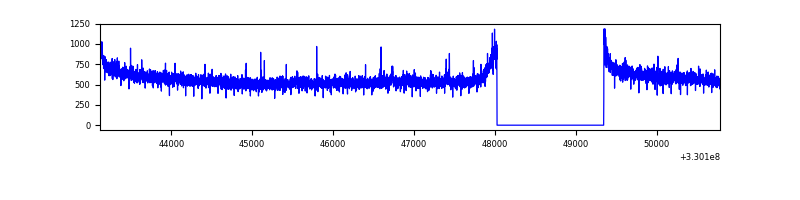 |
| C | 7661 | 6342 | 0 | 0 | 0.00% | 0.00% | 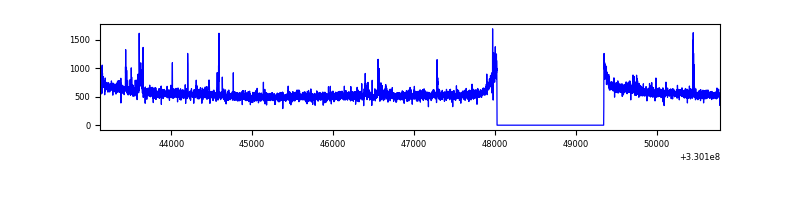 |
| D | 7660 | 6341 | 3 | 3 | 0.04% | 0.05% | 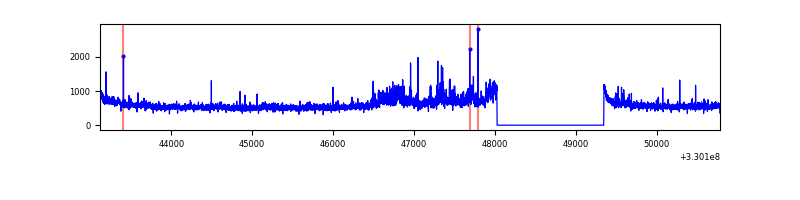 |
Top three noisy pixels from each quadrant. If the there are fewer than three noisy pixels in the level2.evt file, extra rows are filled as -1
| Pixel properties | Quadrant properties | ||||||
|---|---|---|---|---|---|---|---|
| Quadrant | DetID | PixID | Counts | Sigma | Mean | Median | Sigma |
| A | 6 | 16 | 17992 | 94.75 | 916 | 904 | 180.3 |
| A | 13 | 254 | 9063 | 45.24 | 916 | 904 | 180.3 |
| A | 0 | 226 | 7843 | 38.48 | 916 | 904 | 180.3 |
| B | 12 | 111 | 19832 | 111.87 | 914 | 897 | 169.3 |
| B | 11 | 111 | 18185 | 102.14 | 914 | 897 | 169.3 |
| B | 14 | 111 | 16756 | 93.7 | 914 | 897 | 169.3 |
| C | 14 | 238 | 141417 | 716.12 | 852 | 859 | 196.3 |
| C | 2 | 16 | 86151 | 434.55 | 852 | 859 | 196.3 |
| C | 3 | 233 | 15737 | 75.8 | 852 | 859 | 196.3 |
| D | 8 | 195 | 478398 | 2295.15 | 862 | 839 | 208.1 |
| D | 1 | 52 | 136823 | 653.54 | 862 | 839 | 208.1 |
| D | 2 | 234 | 21492 | 99.26 | 862 | 839 | 208.1 |
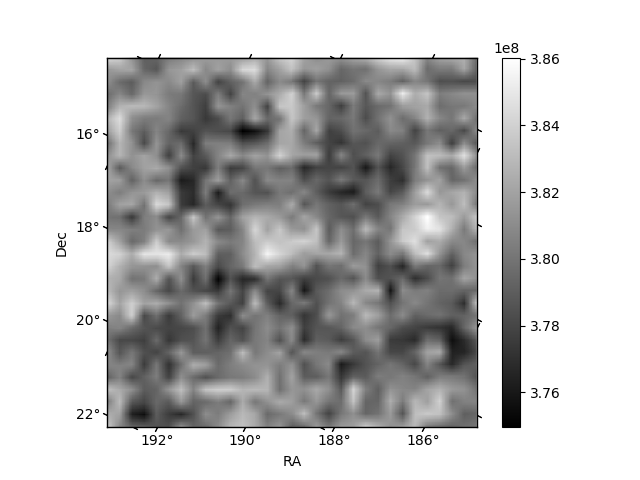
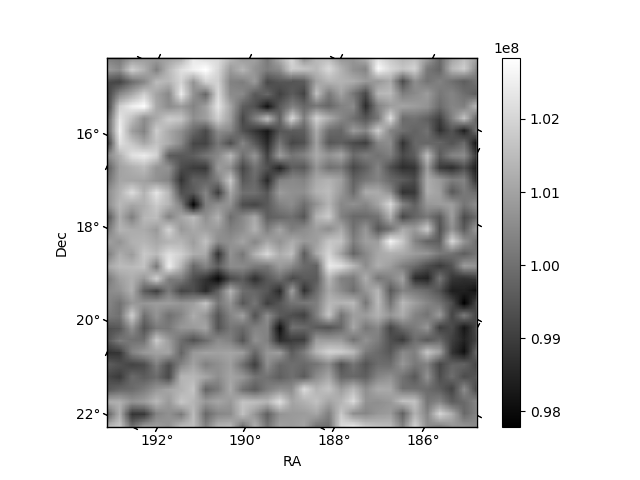
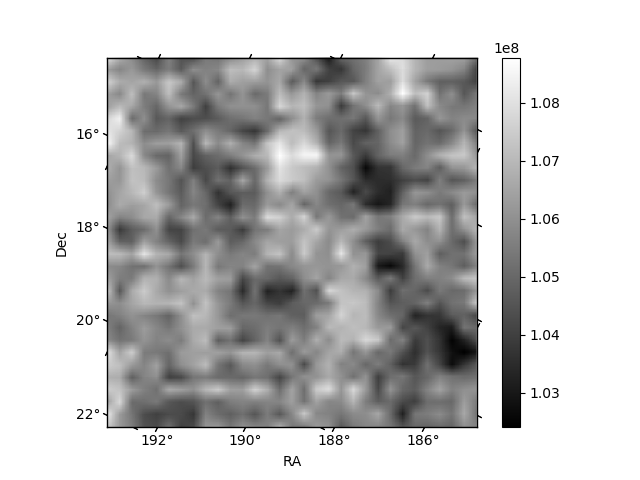
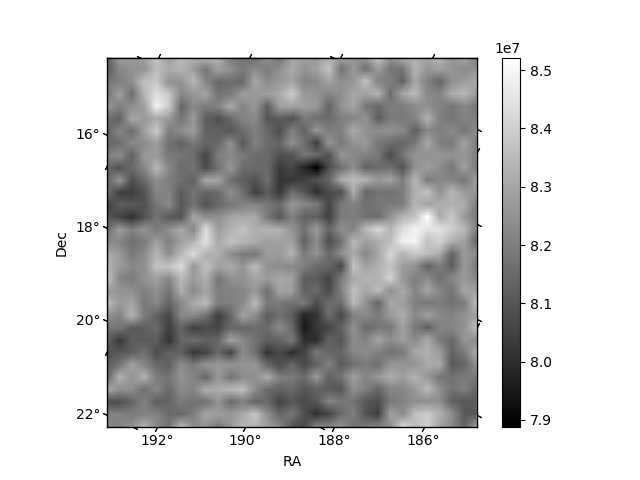
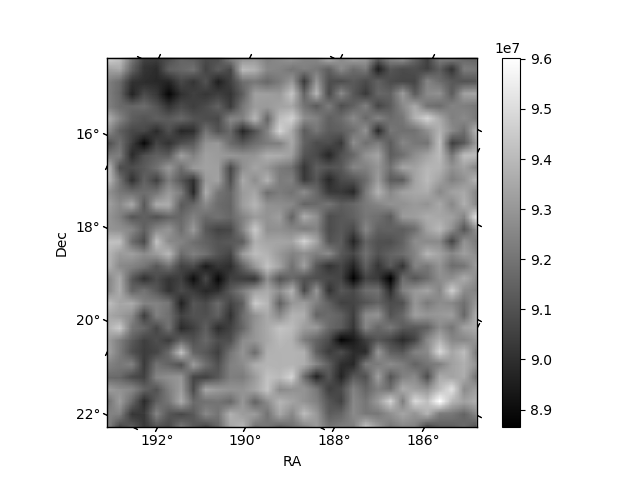
Histogram calculated using DETX and DETY for each event in the final _common_clean file
| Quadrant A | 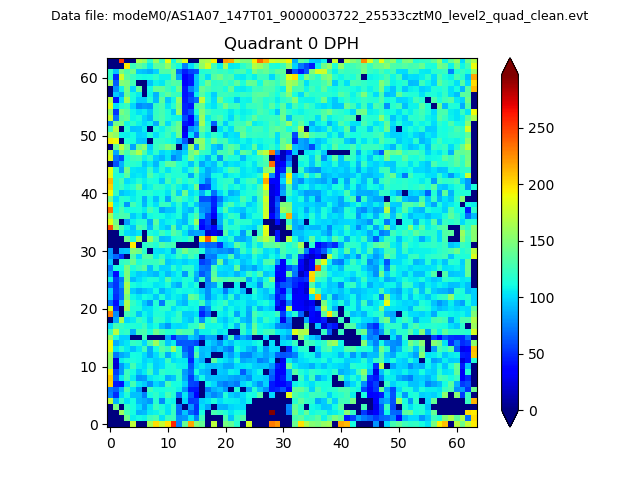 |
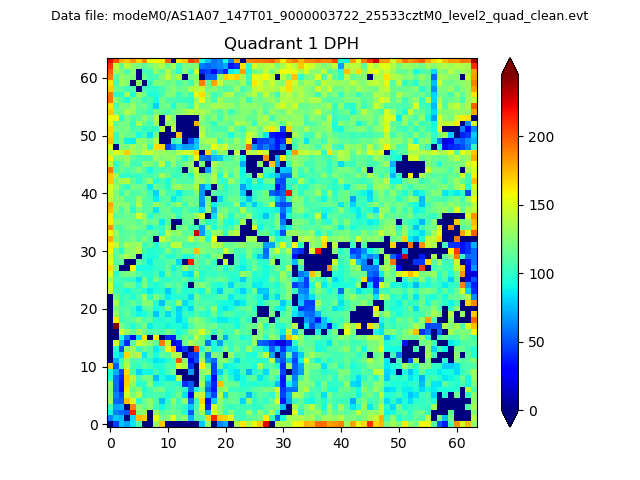 |
Quadrant B |
|---|---|---|---|
| Quadrant D | 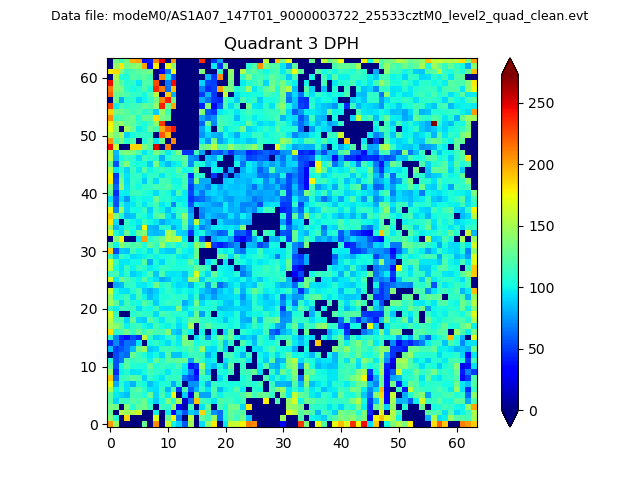 |
 |
Quadrant C |
| Plot type | Count rate plots | Images |
|---|---|---|
| Comparison with Poisson distribution Blue bars denote a histogram of data divided into 1 sec bins. Red curve is a Poisson curve with rate = median count rate of data. |
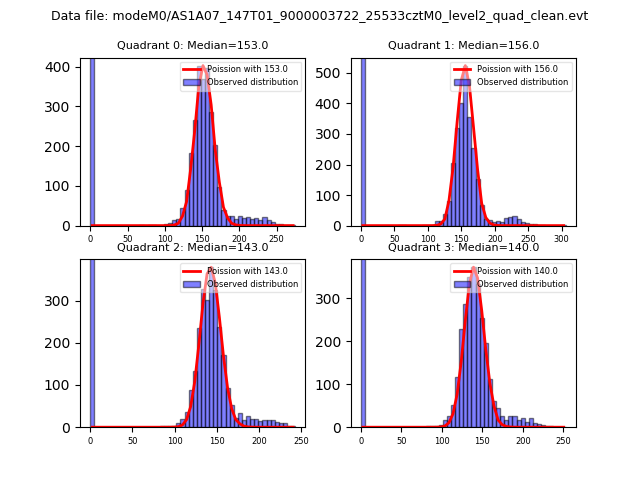 |
 |
| Quadrant-wise count rates Data is divided into 100 sec bins |
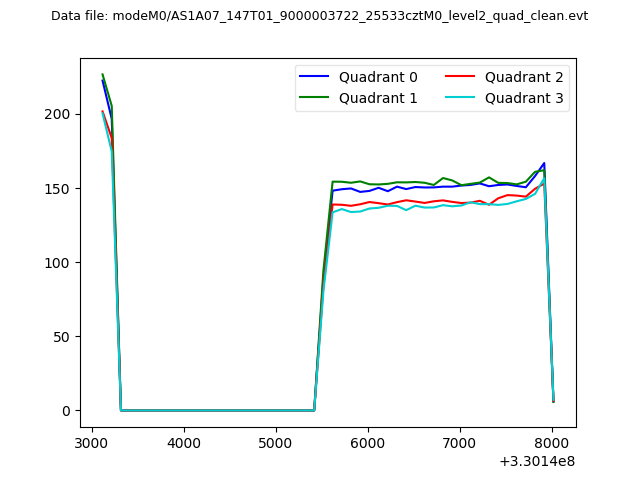 |
|
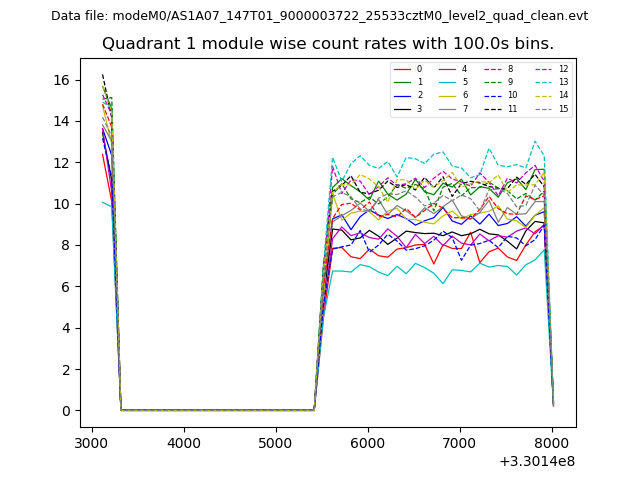
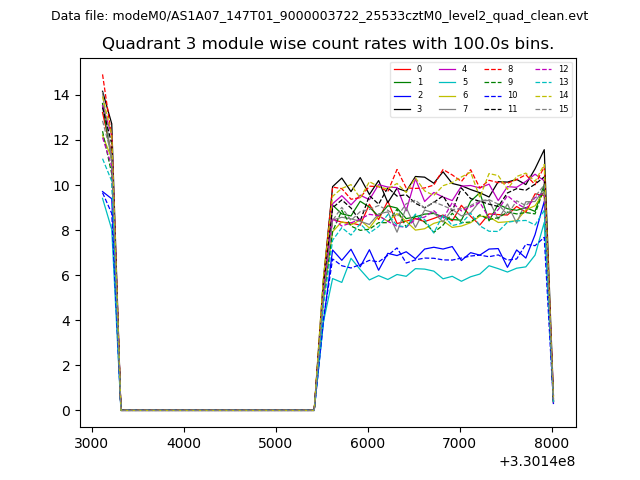
| Module-wise count rates for Quadrant A Data is divided into 100 sec bins |
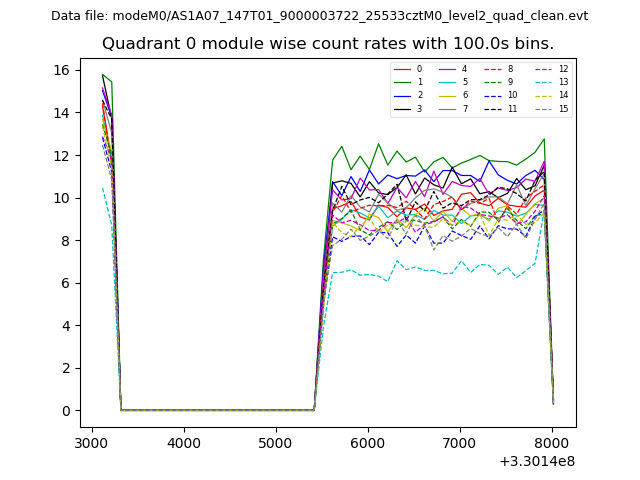 |
 |
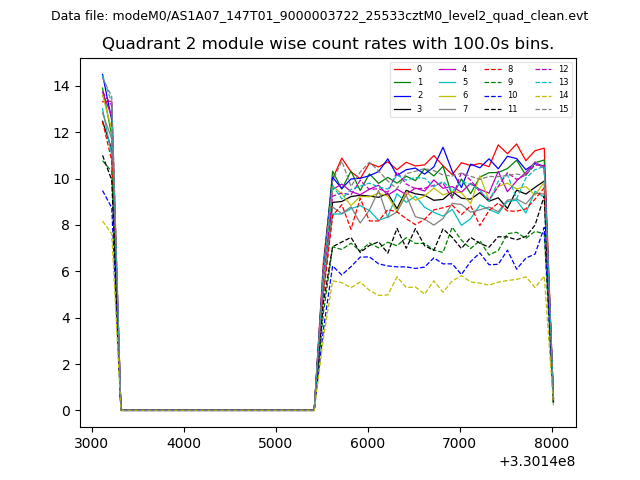
| Module-wise count rates for Quadrant B Data is divided into 100 sec bins |
 |
 |
| Module-wise count rates for Quadrant C Data is divided into 100 sec bins |
 |
 |
| Module-wise count rates for Quadrant D Data is divided into 100 sec bins |
 |
 |
| Parameter | Plot |
|---|---|
| CZT HV Monitor | 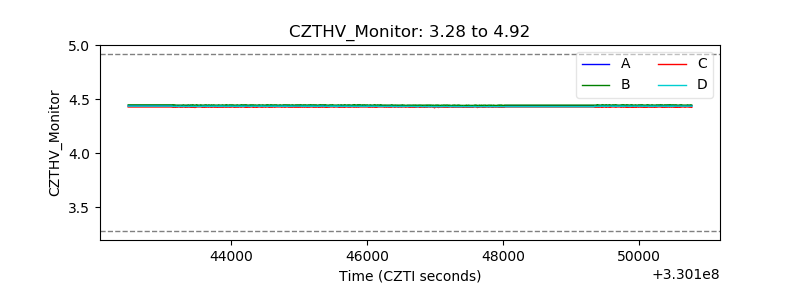 |
| D_VDD | 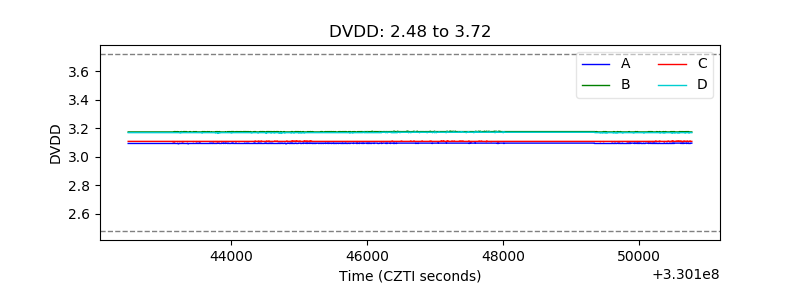 |
| Temperature 1 | 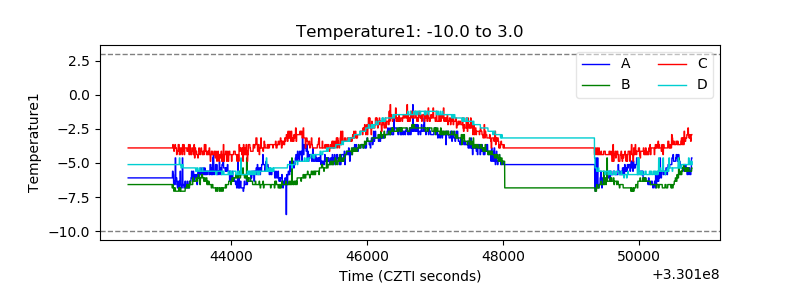 |
| Veto HV Monitor | 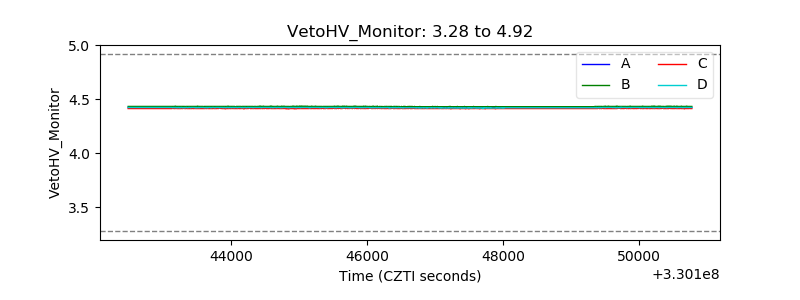 |
| Veto LLD | 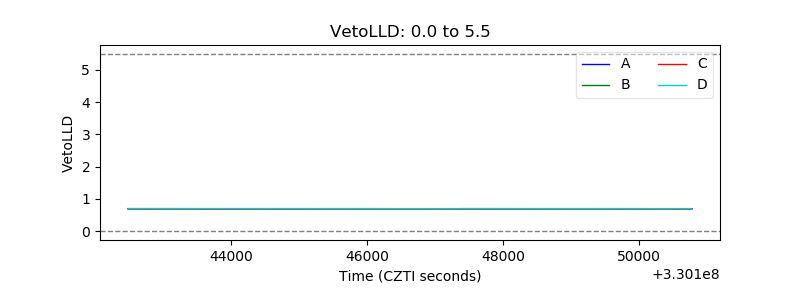 |
| Alpha Counter | 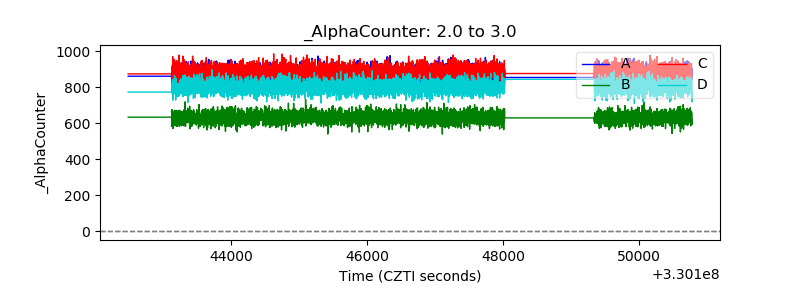 |
| _CPM_Rate | 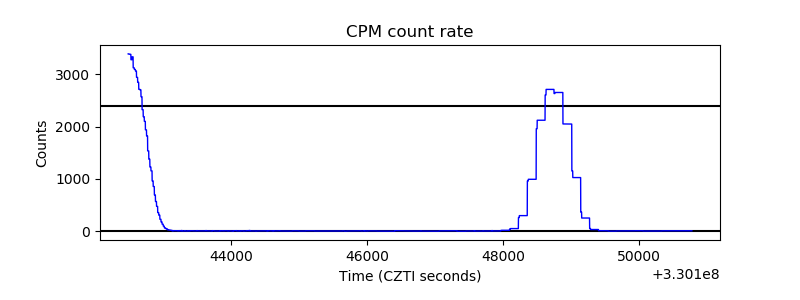 |
| CZT Counter |  |
| +2.5 Volts monitor |  |
| +5 Volts monitor | 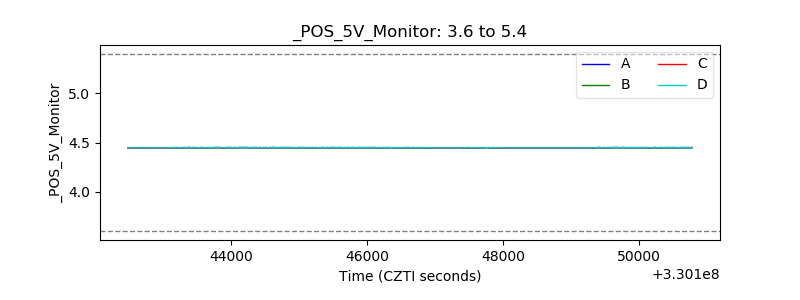 |
| _ROLL_ROT | 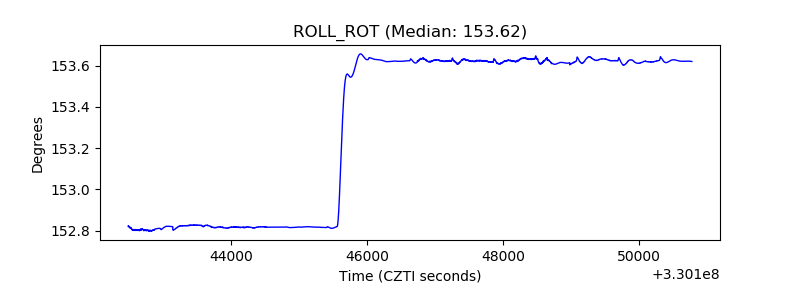 |
| _Roll_DEC | 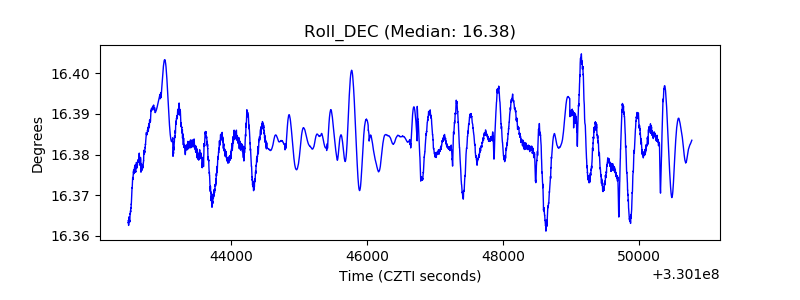 |
| _Roll_RA | 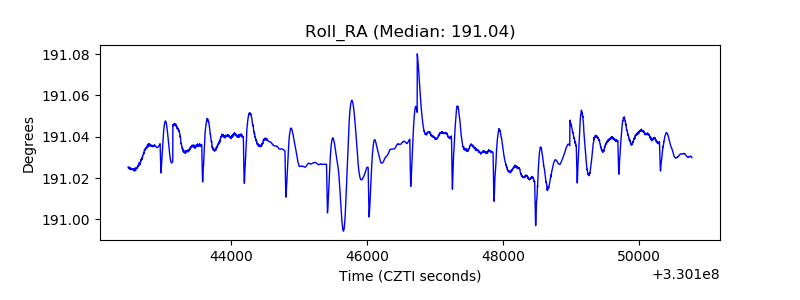 |
| Veto Counter | 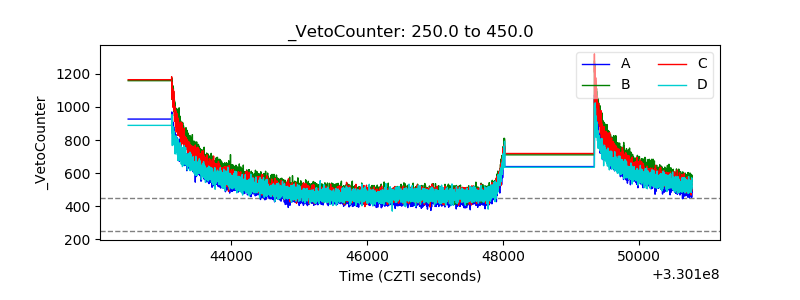 |