| Param | Original file | Final file |
|---|---|---|
| Filename | modeM0/AS1A07_147T01_9000003722_25534cztM0_level2.evt | modeM0/AS1A07_147T01_9000003722_25534cztM0_level2_quad_clean.evt |
| Size (bytes) | 480,337,920 | 70,009,920 |
| Size | 458.1 MB | 66.8 MB |
| Events in quadrant A | 3,482,867 | 435,413 |
| Events in quadrant B | 3,519,356 | 441,676 |
| Events in quadrant C | 3,457,522 | 404,976 |
| Events in quadrant D | 3,660,691 | 398,752 |
| Mode M0 | |||
|---|---|---|---|
| Quadrant | BADHDUFLAG | Total packets | Discarded packets |
| A | 0 | 13923 | 0 |
| B | 0 | 14103 | 0 |
| C | 0 | 13872 | 0 |
| D | 0 | 14663 | 0 |
| Mode M9 | |||
|---|---|---|---|
| Quadrant | BADHDUFLAG | Total packets | Discarded packets |
| A | 0 | 14 | 0 |
| B | 0 | 14 | 0 |
| C | 0 | 14 | 0 |
| D | 0 | 14 | 0 |
| Quadrant | Total seconds | Saturated seconds | Saturation percentage |
|---|---|---|---|
| A | 6295 | 44 | 0.698967% |
| B | 6295 | 78 | 1.239079% |
| C | 6295 | 91 | 1.445592% |
| D | 6296 | 30 | 0.476493% |
Noise dominated data is calculated using 1-second bins in cleaned event files. If a bin has >2000 counts, and if more than 50% of those come from <1% of pixels, then it is considered to be noise-dominated and hence unusable.
| Quadrant | # 1 sec bins | Bins with >0 counts | Bins with >2000 counts | High rate bins dominated by noise | Noise dominated (total time) | Noise dominated (detector-on time) | Marked lightcurve |
|---|---|---|---|---|---|---|---|
| A | 7640 | 6296 | 0 | 0 | 0.00% | 0.00% | 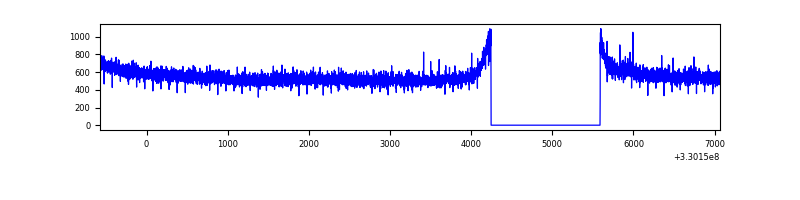 |
| B | 7640 | 6296 | 0 | 0 | 0.00% | 0.00% | 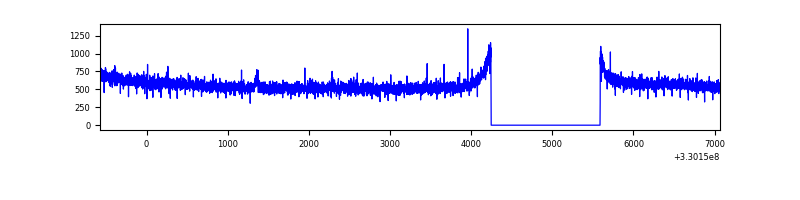 |
| C | 7640 | 6296 | 1 | 1 | 0.01% | 0.02% | 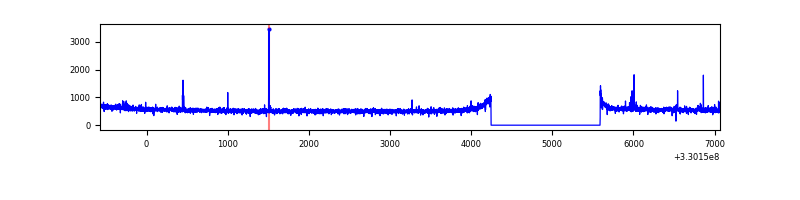 |
| D | 7641 | 6297 | 7 | 7 | 0.09% | 0.11% | 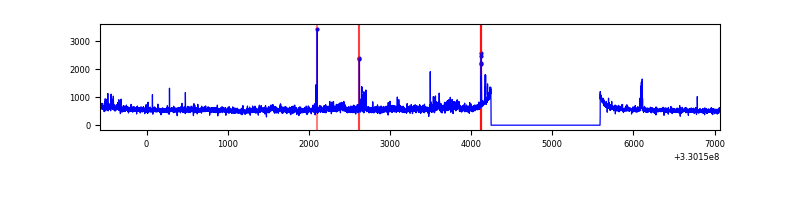 |
Top three noisy pixels from each quadrant. If the there are fewer than three noisy pixels in the level2.evt file, extra rows are filled as -1
| Pixel properties | Quadrant properties | ||||||
|---|---|---|---|---|---|---|---|
| Quadrant | DetID | PixID | Counts | Sigma | Mean | Median | Sigma |
| A | 13 | 254 | 9558 | 48.63 | 901 | 888 | 178.3 |
| A | 0 | 226 | 7676 | 38.08 | 901 | 888 | 178.3 |
| A | 3 | 137 | 7537 | 37.3 | 901 | 888 | 178.3 |
| B | 12 | 111 | 19756 | 114.04 | 893 | 875 | 165.6 |
| B | 3 | 112 | 19082 | 109.97 | 893 | 875 | 165.6 |
| B | 11 | 111 | 17906 | 102.87 | 893 | 875 | 165.6 |
| C | 14 | 238 | 137565 | 708.44 | 835 | 842 | 193.0 |
| C | 2 | 16 | 31397 | 158.32 | 835 | 842 | 193.0 |
| C | 5 | 112 | 16431 | 80.78 | 835 | 842 | 193.0 |
| D | 8 | 195 | 358286 | 1723.04 | 850 | 825 | 207.5 |
| D | 1 | 52 | 93949 | 448.88 | 850 | 825 | 207.5 |
| D | 2 | 234 | 20985 | 97.18 | 850 | 825 | 207.5 |
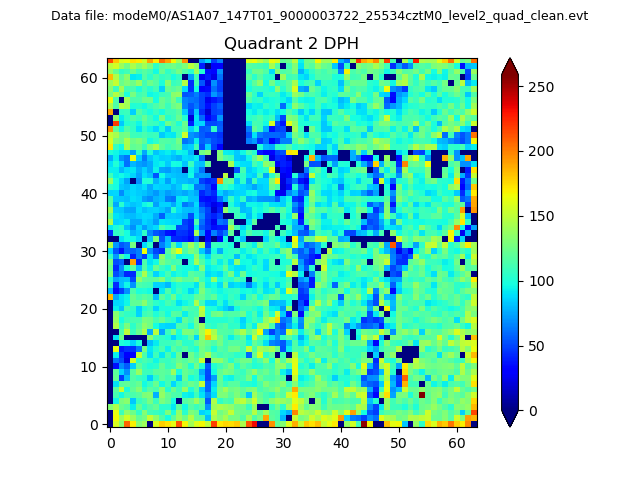
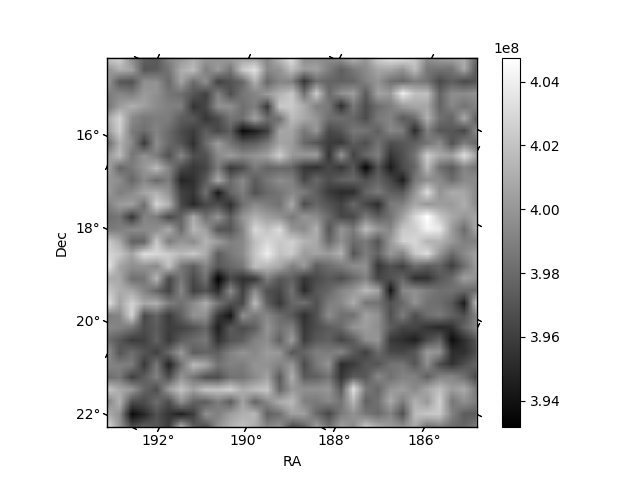
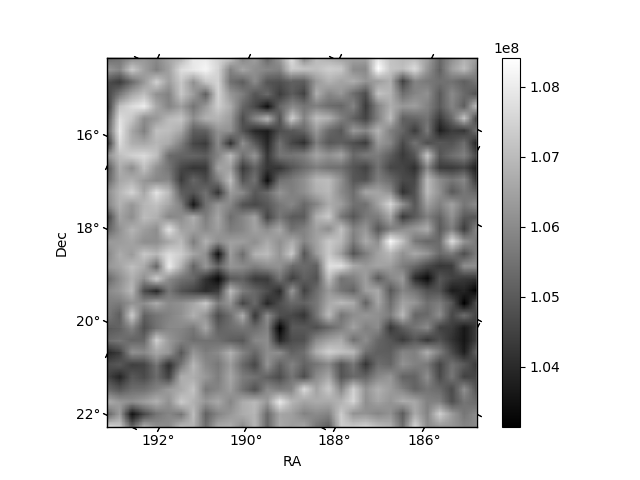
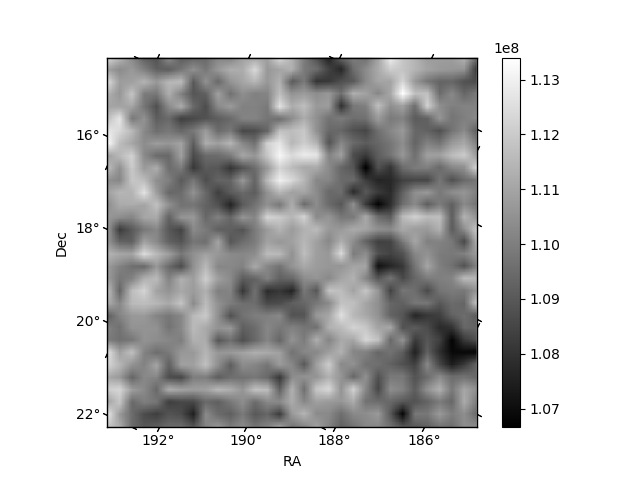
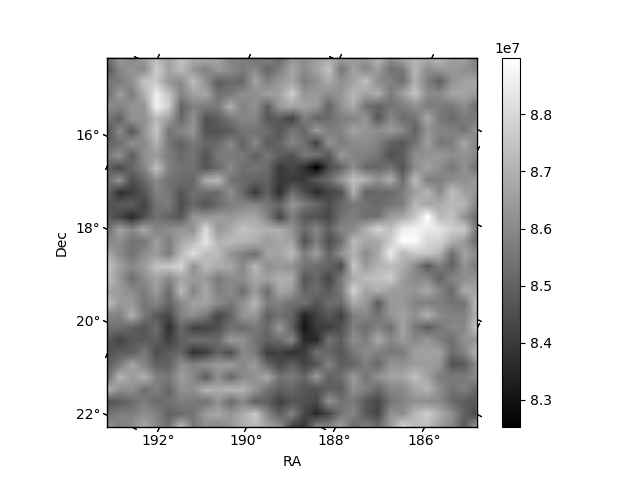
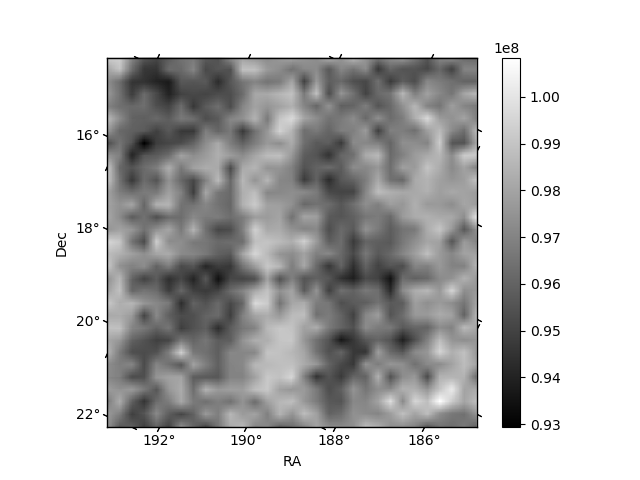
Histogram calculated using DETX and DETY for each event in the final _common_clean file
| Quadrant A | 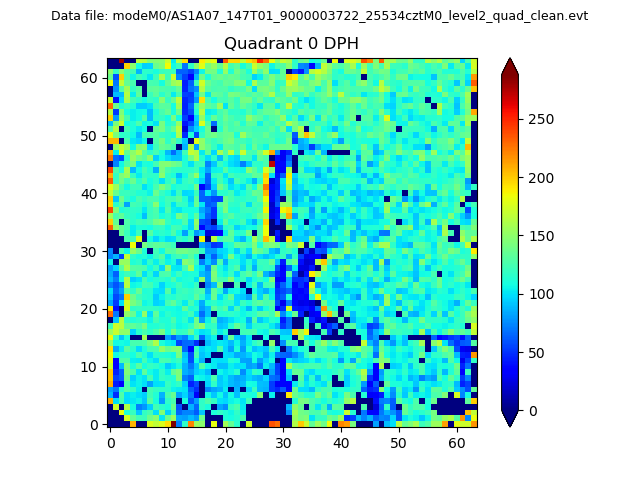 |
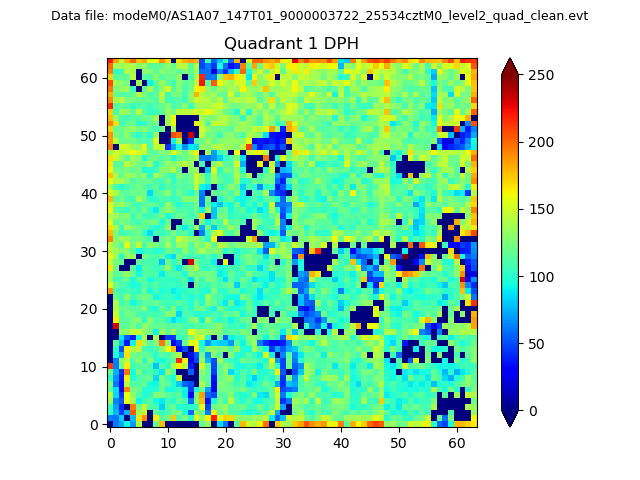 |
Quadrant B |
|---|---|---|---|
| Quadrant D | 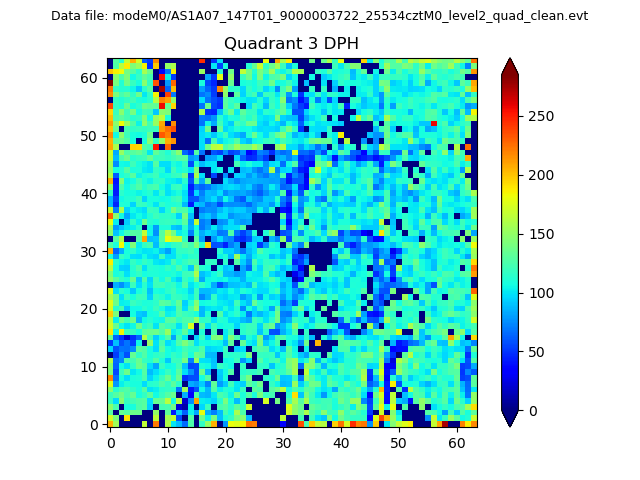 |
 |
Quadrant C |
| Plot type | Count rate plots | Images |
|---|---|---|
| Comparison with Poisson distribution Blue bars denote a histogram of data divided into 1 sec bins. Red curve is a Poisson curve with rate = median count rate of data. |
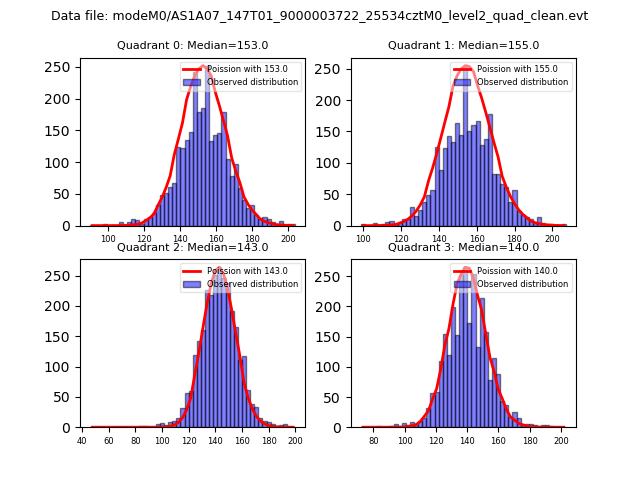 |
 |
| Quadrant-wise count rates Data is divided into 100 sec bins |
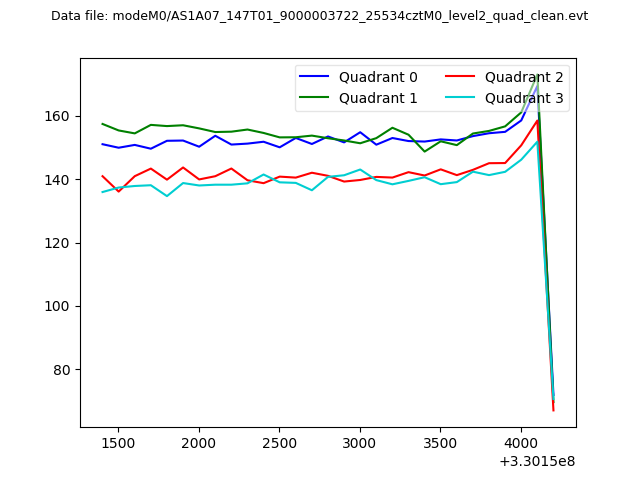 |
|
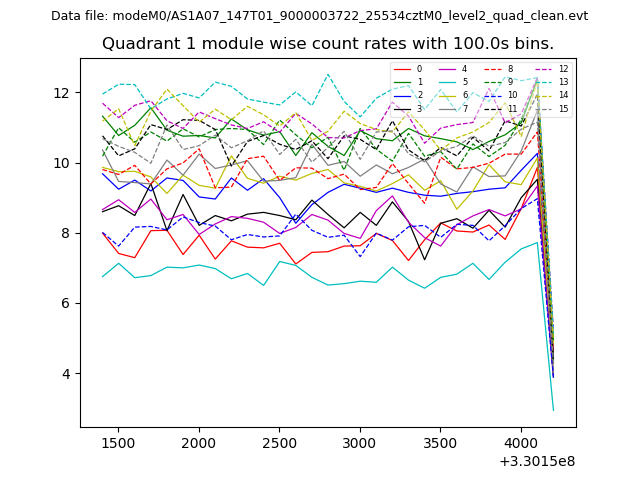
| Module-wise count rates for Quadrant A Data is divided into 100 sec bins |
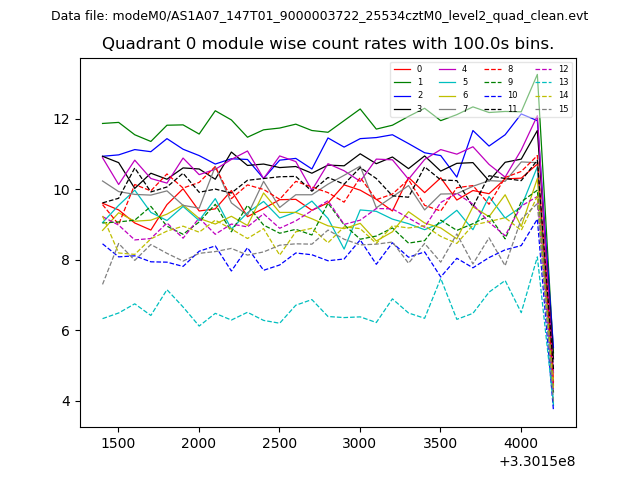 |
 |
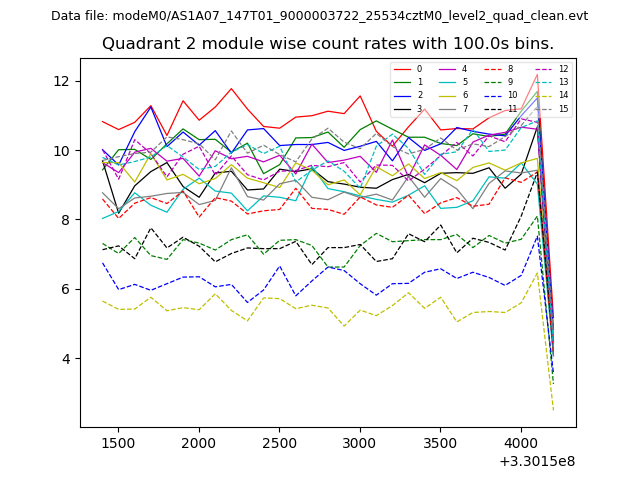
| Module-wise count rates for Quadrant B Data is divided into 100 sec bins |
 |
 |
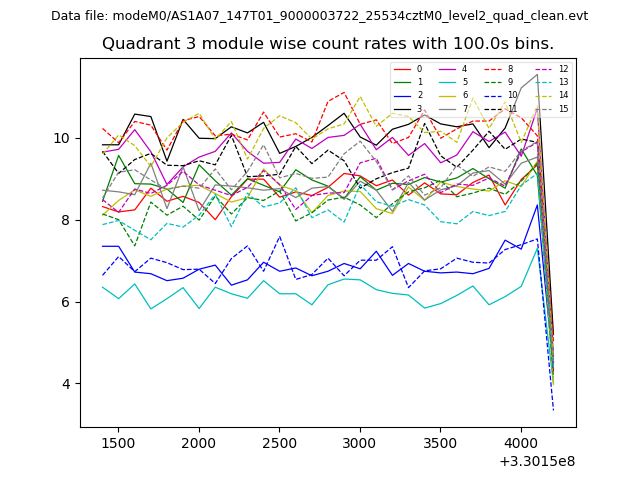
| Module-wise count rates for Quadrant C Data is divided into 100 sec bins |
 |
 |
| Module-wise count rates for Quadrant D Data is divided into 100 sec bins |
 |
 |
| Parameter | Plot |
|---|---|
| CZT HV Monitor | 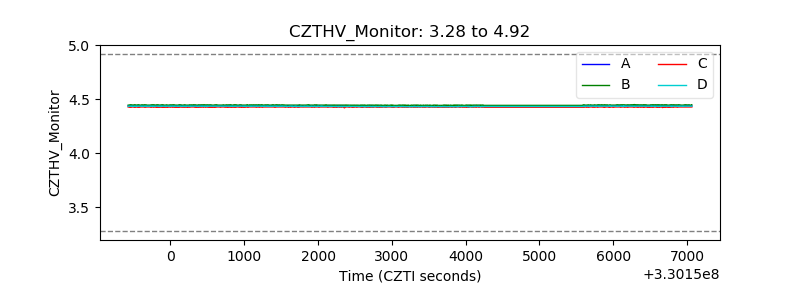 |
| D_VDD | 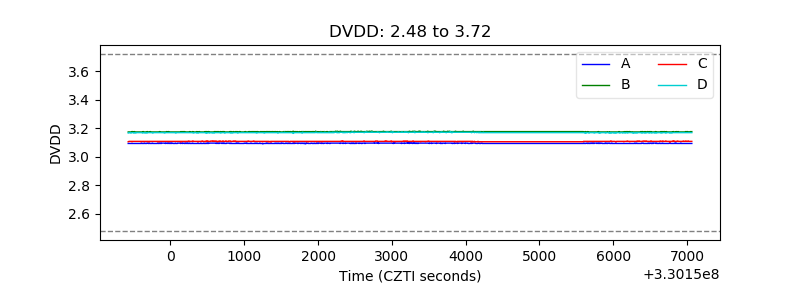 |
| Temperature 1 | 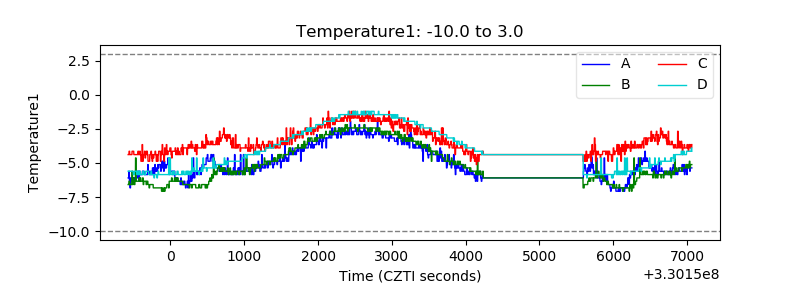 |
| Veto HV Monitor | 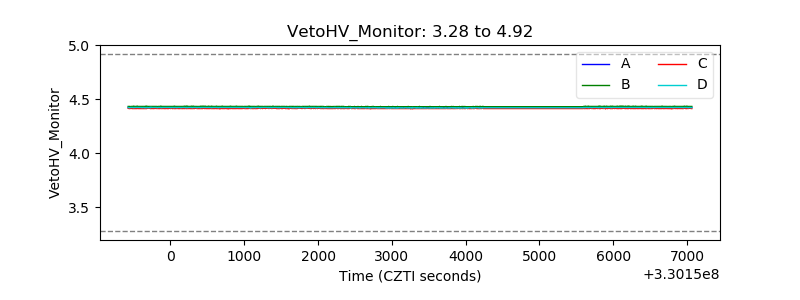 |
| Veto LLD | 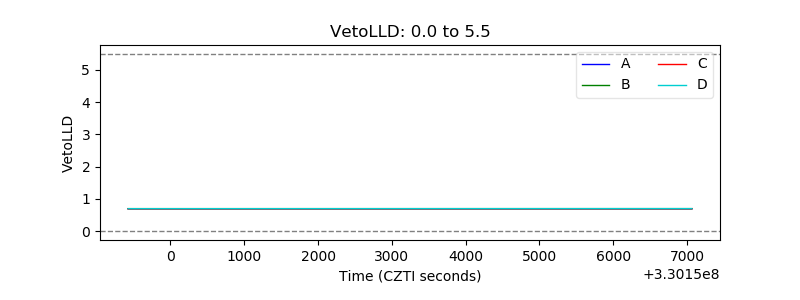 |
| Alpha Counter | 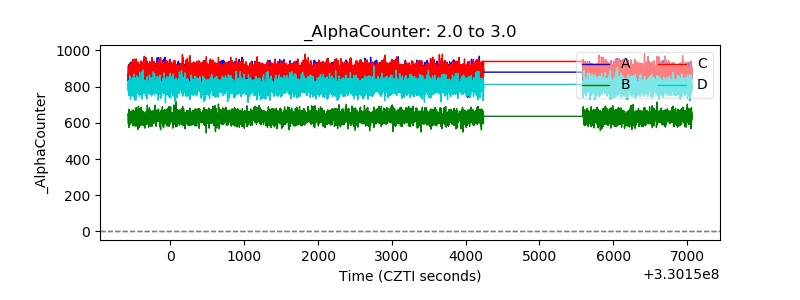 |
| _CPM_Rate | 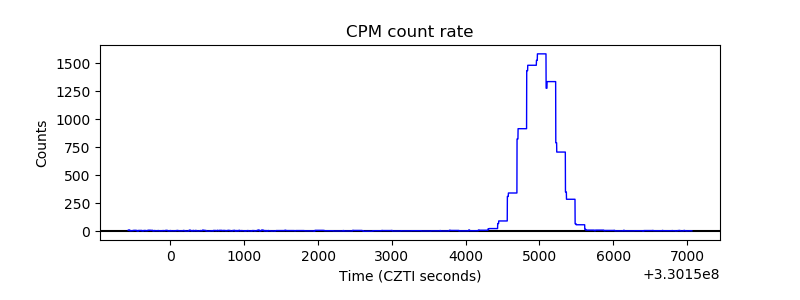 |
| CZT Counter | 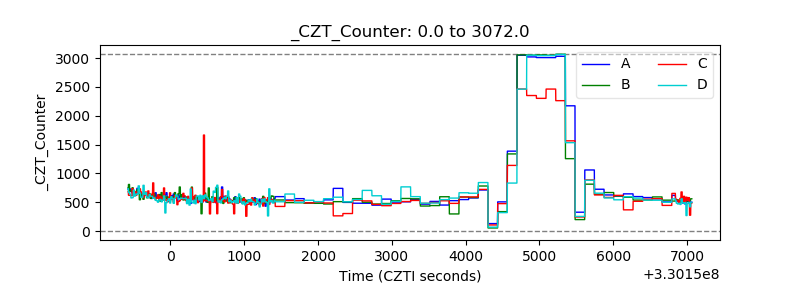 |
| +2.5 Volts monitor |  |
| +5 Volts monitor |  |
| _ROLL_ROT | 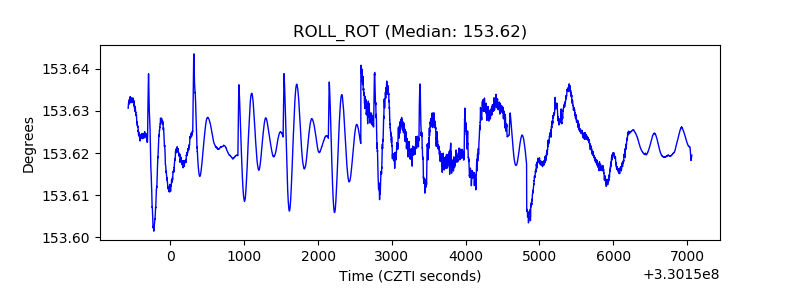 |
| _Roll_DEC | 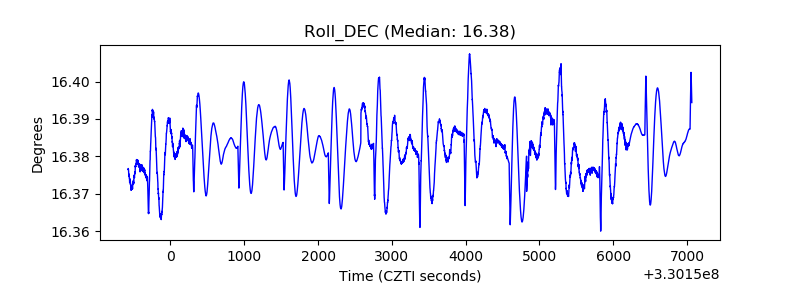 |
| _Roll_RA | 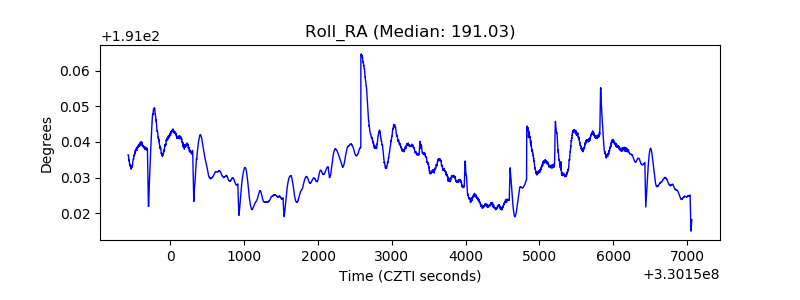 |
| Veto Counter | 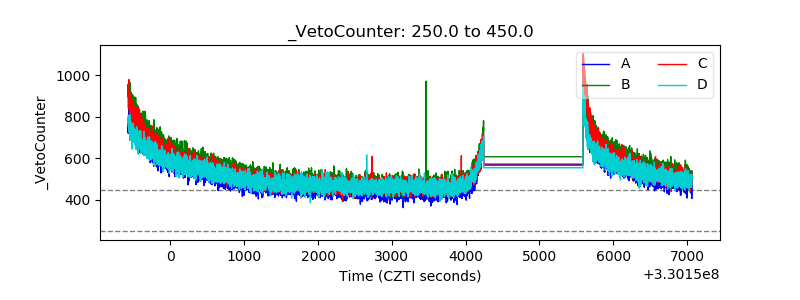 |