| Param | Original file | Final file |
|---|---|---|
| Filename | modeM0/AS1A07_147T01_9000003722_25535cztM0_level2.evt | modeM0/AS1A07_147T01_9000003722_25535cztM0_level2_quad_clean.evt |
| Size (bytes) | 491,607,360 | 81,823,680 |
| Size | 468.8 MB | 78.0 MB |
| Events in quadrant A | 3,487,097 | 524,923 |
| Events in quadrant B | 3,525,991 | 532,356 |
| Events in quadrant C | 3,814,862 | 484,798 |
| Events in quadrant D | 3,623,366 | 486,442 |
| Mode M0 | |||
|---|---|---|---|
| Quadrant | BADHDUFLAG | Total packets | Discarded packets |
| A | 0 | 13992 | 0 |
| B | 0 | 14121 | 0 |
| C | 0 | 15103 | 0 |
| D | 0 | 14429 | 0 |
| Mode M9 | |||
|---|---|---|---|
| Quadrant | BADHDUFLAG | Total packets | Discarded packets |
| A | 0 | 17 | 0 |
| B | 0 | 18 | 0 |
| C | 0 | 18 | 0 |
| D | 0 | 18 | 0 |
| Quadrant | Total seconds | Saturated seconds | Saturation percentage |
|---|---|---|---|
| A | 6443 | 113 | 1.753841% |
| B | 6443 | 149 | 2.312587% |
| C | 6443 | 215 | 3.336955% |
| D | 6443 | 83 | 1.288220% |
Noise dominated data is calculated using 1-second bins in cleaned event files. If a bin has >2000 counts, and if more than 50% of those come from <1% of pixels, then it is considered to be noise-dominated and hence unusable.
| Quadrant | # 1 sec bins | Bins with >0 counts | Bins with >2000 counts | High rate bins dominated by noise | Noise dominated (total time) | Noise dominated (detector-on time) | Marked lightcurve |
|---|---|---|---|---|---|---|---|
| A | 7633 | 6444 | 0 | 0 | 0.00% | 0.00% | 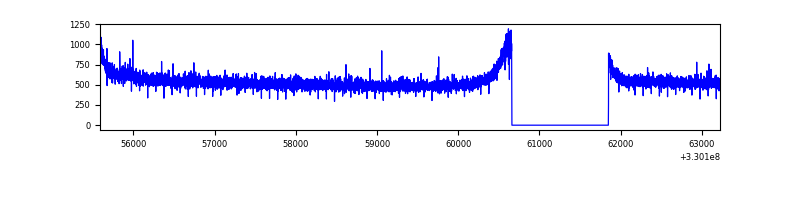 |
| B | 7633 | 6444 | 0 | 0 | 0.00% | 0.00% | 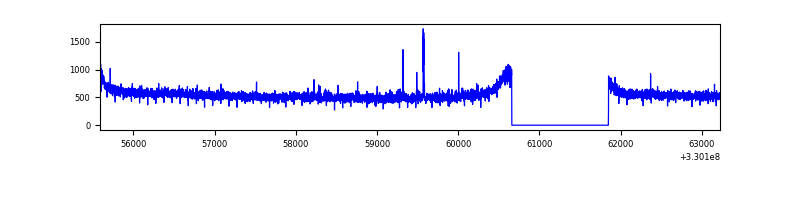 |
| C | 7633 | 6444 | 39 | 39 | 0.51% | 0.61% | 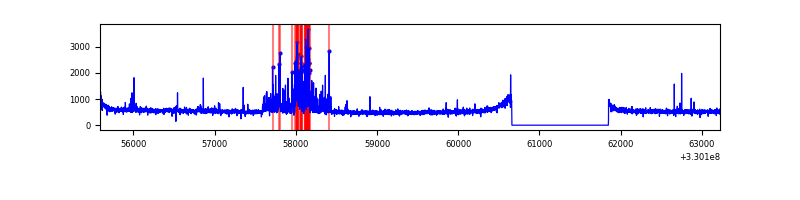 |
| D | 7633 | 6444 | 4 | 4 | 0.05% | 0.06% | 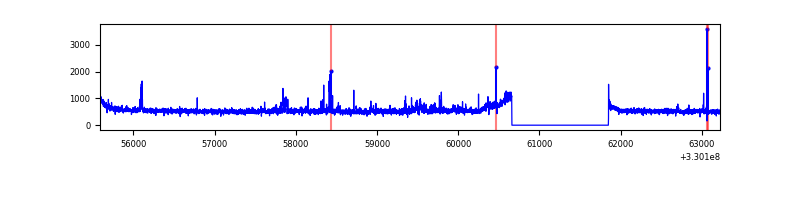 |
Top three noisy pixels from each quadrant. If the there are fewer than three noisy pixels in the level2.evt file, extra rows are filled as -1
| Pixel properties | Quadrant properties | ||||||
|---|---|---|---|---|---|---|---|
| Quadrant | DetID | PixID | Counts | Sigma | Mean | Median | Sigma |
| A | 13 | 254 | 10106 | 51.49 | 901 | 886 | 179.1 |
| A | 3 | 137 | 7938 | 39.38 | 901 | 886 | 179.1 |
| A | 0 | 226 | 7798 | 38.6 | 901 | 886 | 179.1 |
| B | 0 | 190 | 27441 | 156.09 | 890 | 868 | 170.2 |
| B | 12 | 111 | 20208 | 113.6 | 890 | 868 | 170.2 |
| B | 11 | 111 | 18507 | 103.61 | 890 | 868 | 170.2 |
| C | 2 | 16 | 381442 | 1950.58 | 838 | 843 | 195.1 |
| C | 14 | 238 | 137028 | 697.95 | 838 | 843 | 195.1 |
| C | 5 | 112 | 18341 | 89.68 | 838 | 843 | 195.1 |
| D | 8 | 195 | 254901 | 1216.31 | 858 | 834 | 208.9 |
| D | 1 | 52 | 88410 | 419.26 | 858 | 834 | 208.9 |
| D | 12 | 217 | 40030 | 187.64 | 858 | 834 | 208.9 |
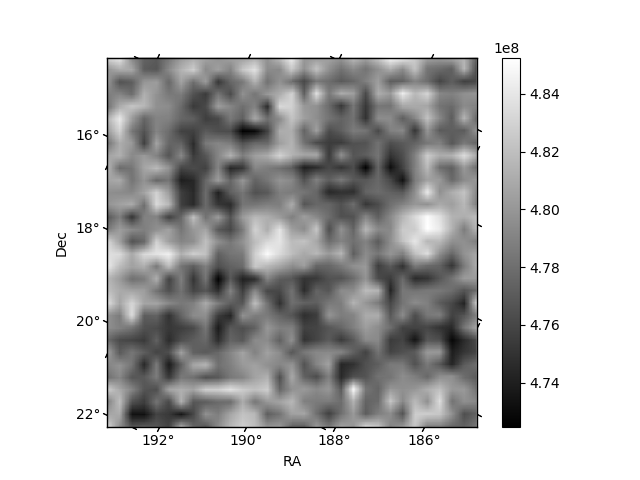
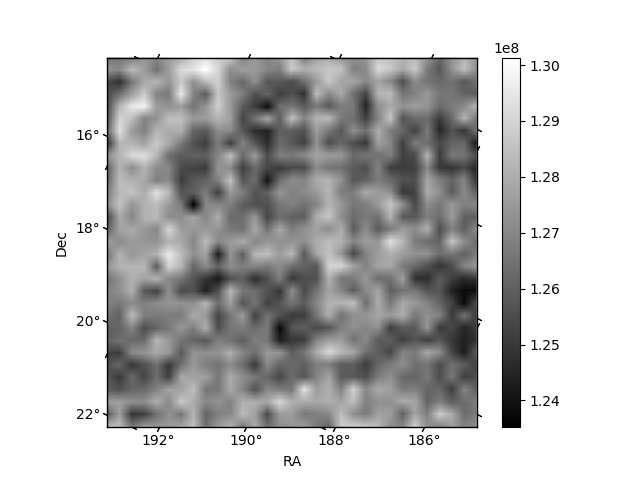
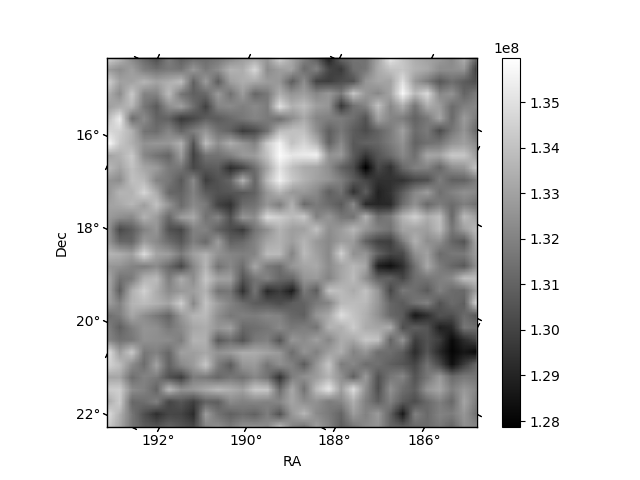
Histogram calculated using DETX and DETY for each event in the final _common_clean file
| Quadrant A | 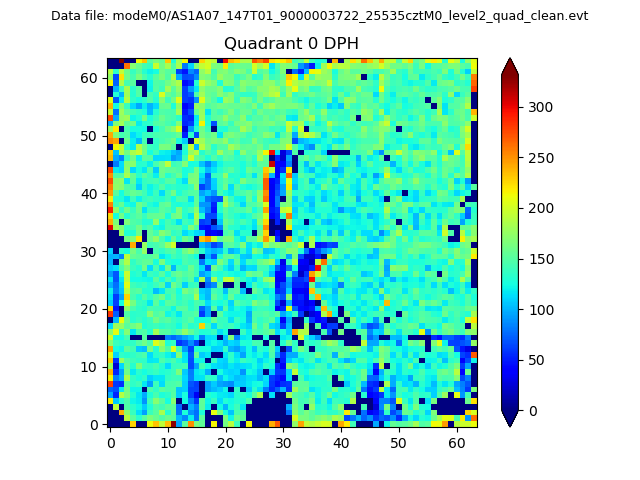 |
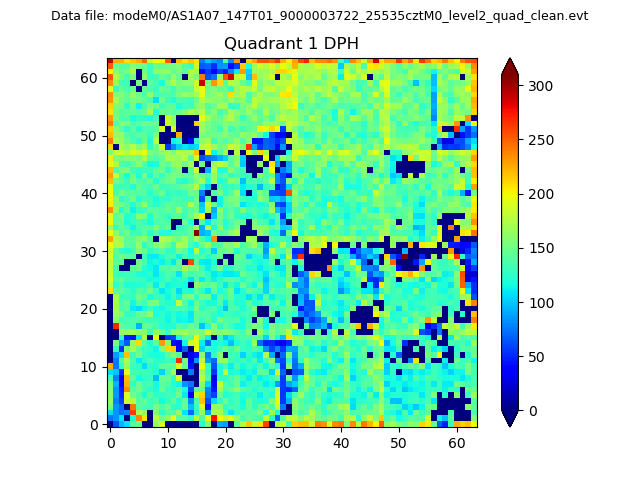 |
Quadrant B |
|---|---|---|---|
| Quadrant D |  |
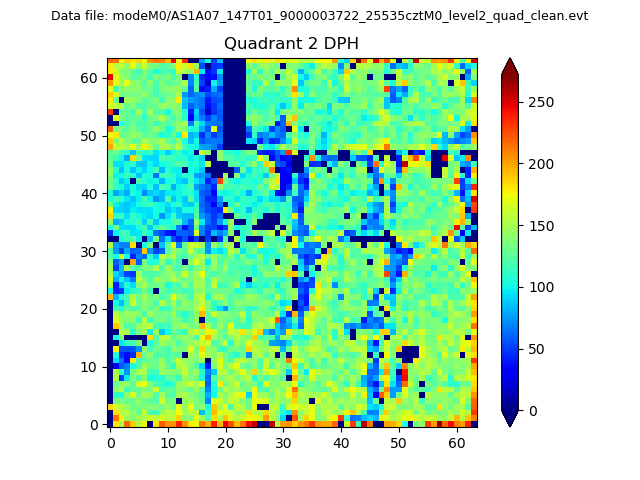 |
Quadrant C |
| Plot type | Count rate plots | Images |
|---|---|---|
| Comparison with Poisson distribution Blue bars denote a histogram of data divided into 1 sec bins. Red curve is a Poisson curve with rate = median count rate of data. |
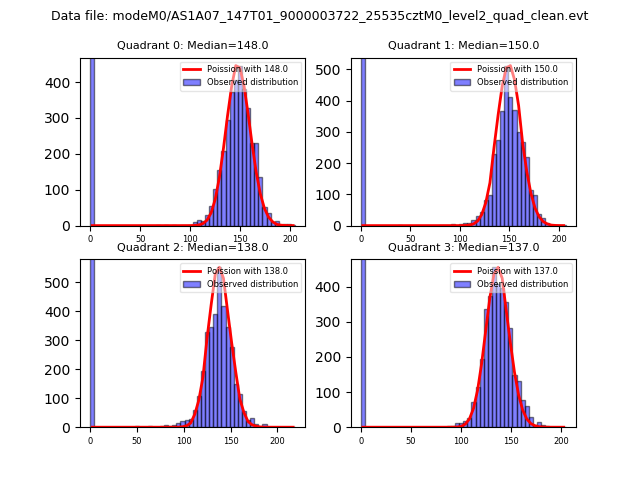 |
 |
| Quadrant-wise count rates Data is divided into 100 sec bins |
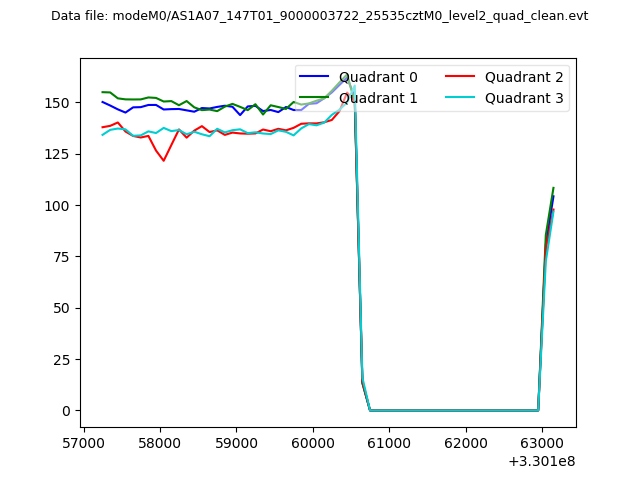 |
|
| Module-wise count rates for Quadrant A Data is divided into 100 sec bins |
 |
 |
| Module-wise count rates for Quadrant B Data is divided into 100 sec bins |
 |
 |
| Module-wise count rates for Quadrant C Data is divided into 100 sec bins |
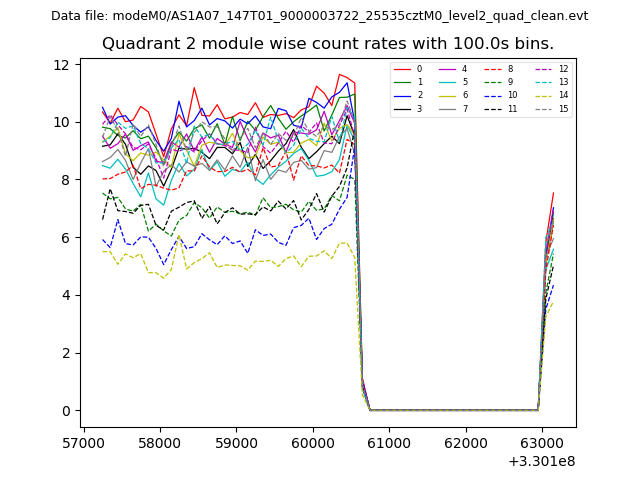 |
 |
| Module-wise count rates for Quadrant D Data is divided into 100 sec bins |
 |
 |
| Parameter | Plot |
|---|---|
| CZT HV Monitor |  |
| D_VDD | 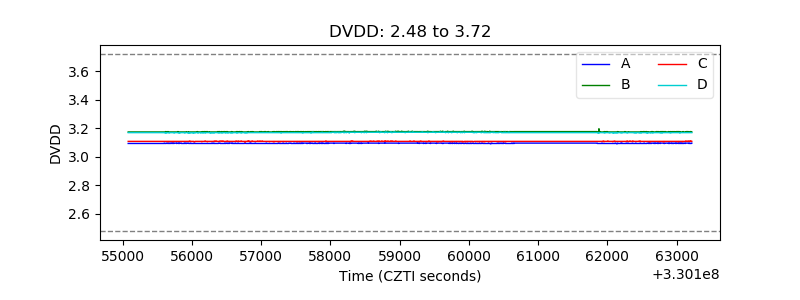 |
| Temperature 1 | 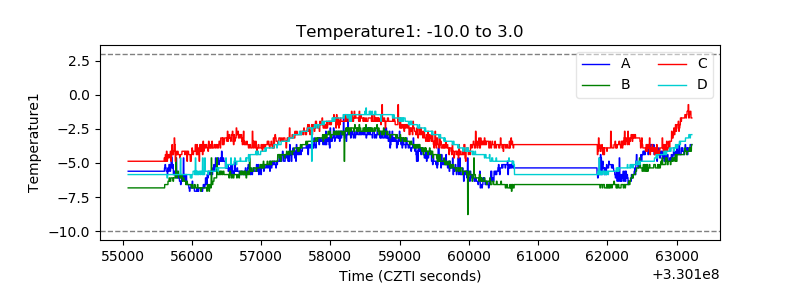 |
| Veto HV Monitor | 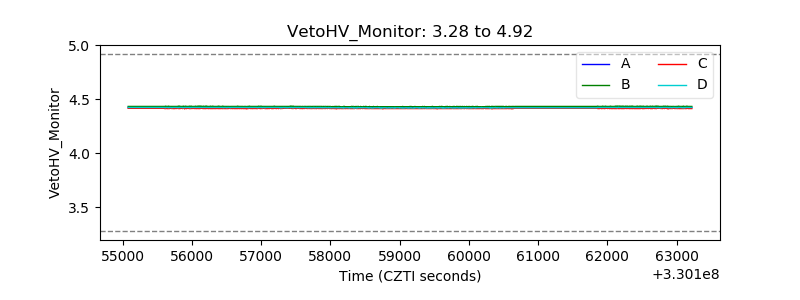 |
| Veto LLD | 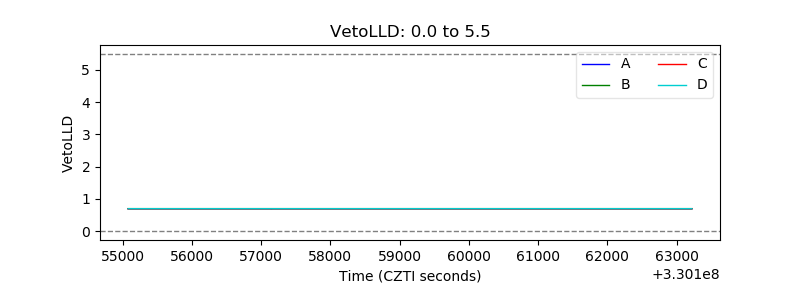 |
| Alpha Counter | 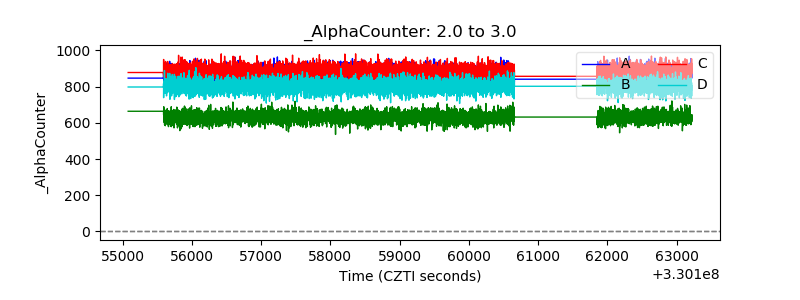 |
| _CPM_Rate | 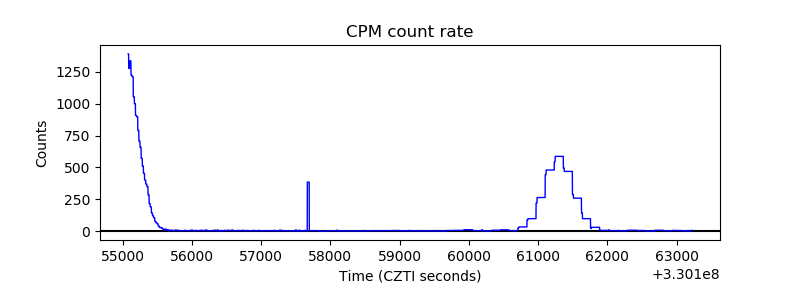 |
| CZT Counter | 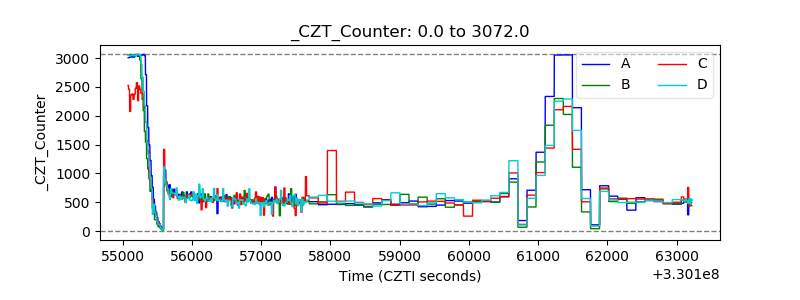 |
| +2.5 Volts monitor |  |
| +5 Volts monitor | 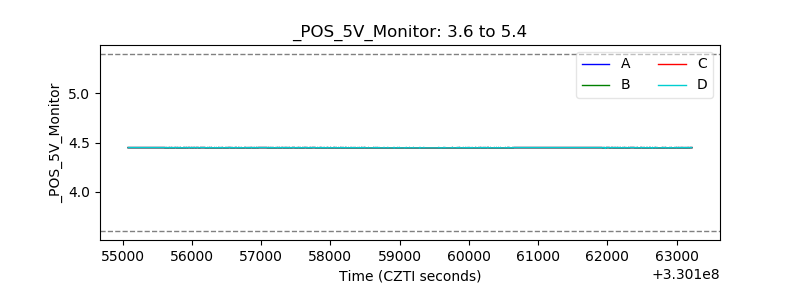 |
| _ROLL_ROT |  |
| _Roll_DEC | 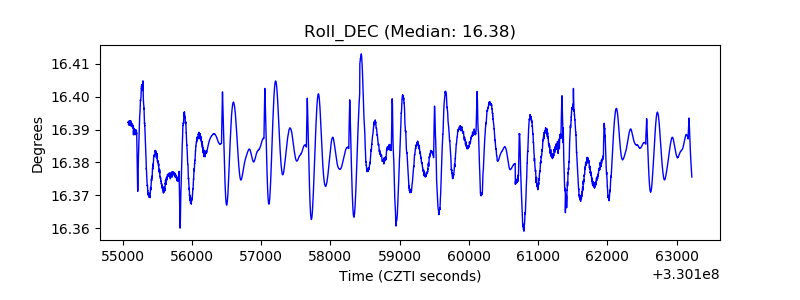 |
| _Roll_RA | 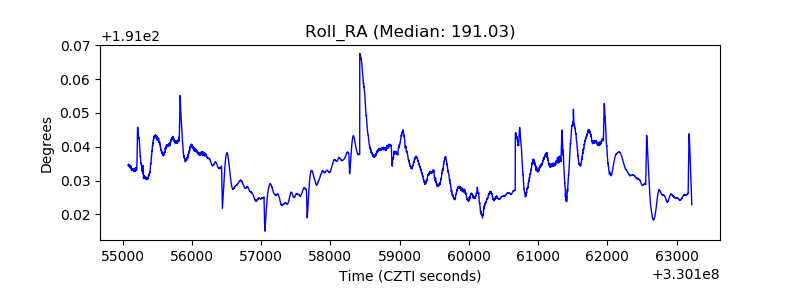 |
| Veto Counter | 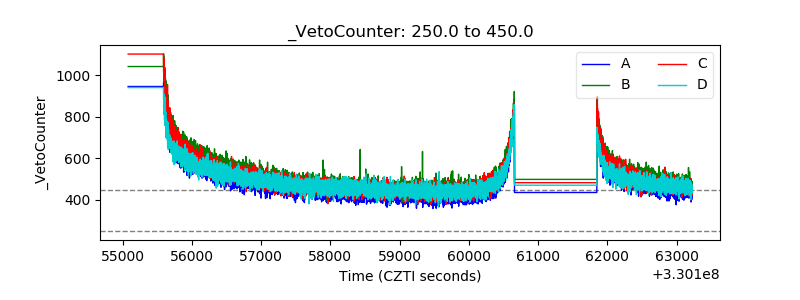 |