| Param | Original file | Final file |
|---|---|---|
| Filename | modeM0/AS1A07_147T01_9000003722_25536cztM0_level2.evt | modeM0/AS1A07_147T01_9000003722_25536cztM0_level2_quad_clean.evt |
| Size (bytes) | 501,912,000 | 89,418,240 |
| Size | 478.7 MB | 85.3 MB |
| Events in quadrant A | 3,410,232 | 578,023 |
| Events in quadrant B | 3,429,047 | 584,515 |
| Events in quadrant C | 3,400,266 | 541,942 |
| Events in quadrant D | 4,505,298 | 535,712 |
| Mode M0 | |||
|---|---|---|---|
| Quadrant | BADHDUFLAG | Total packets | Discarded packets |
| A | 0 | 13937 | 0 |
| B | 0 | 14033 | 0 |
| C | 0 | 13981 | 0 |
| D | 0 | 17521 | 0 |
| Mode M9 | |||
|---|---|---|---|
| Quadrant | BADHDUFLAG | Total packets | Discarded packets |
| A | 0 | 8 | 0 |
| B | 0 | 8 | 0 |
| C | 0 | 8 | 0 |
| D | 0 | 8 | 0 |
| Quadrant | Total seconds | Saturated seconds | Saturation percentage |
|---|---|---|---|
| A | 6708 | 149 | 2.221228% |
| B | 6709 | 163 | 2.429572% |
| C | 6709 | 181 | 2.697869% |
| D | 6709 | 282 | 4.203309% |
Noise dominated data is calculated using 1-second bins in cleaned event files. If a bin has >2000 counts, and if more than 50% of those come from <1% of pixels, then it is considered to be noise-dominated and hence unusable.
| Quadrant | # 1 sec bins | Bins with >0 counts | Bins with >2000 counts | High rate bins dominated by noise | Noise dominated (total time) | Noise dominated (detector-on time) | Marked lightcurve |
|---|---|---|---|---|---|---|---|
| A | 7538 | 6709 | 0 | 0 | 0.00% | 0.00% | 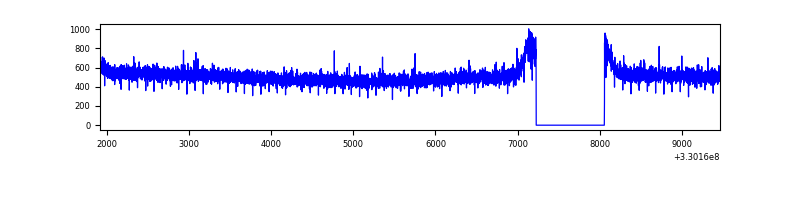 |
| B | 7539 | 6710 | 0 | 0 | 0.00% | 0.00% | 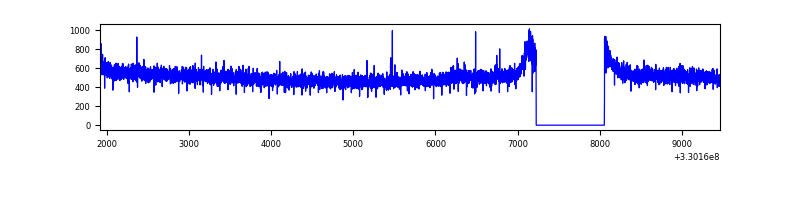 |
| C | 7539 | 6710 | 0 | 0 | 0.00% | 0.00% | 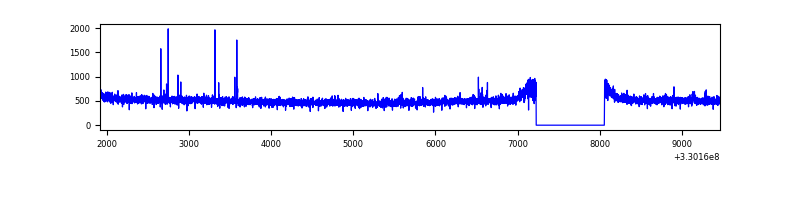 |
| D | 7539 | 6710 | 167 | 167 | 2.22% | 2.49% | 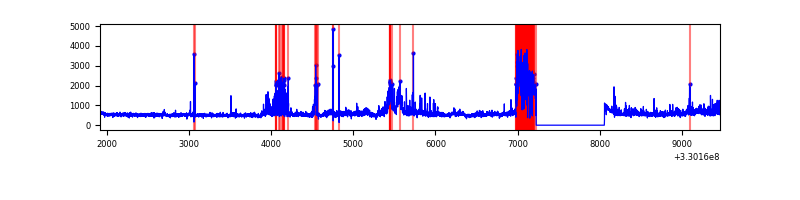 |
Top three noisy pixels from each quadrant. If the there are fewer than three noisy pixels in the level2.evt file, extra rows are filled as -1
| Pixel properties | Quadrant properties | ||||||
|---|---|---|---|---|---|---|---|
| Quadrant | DetID | PixID | Counts | Sigma | Mean | Median | Sigma |
| A | 13 | 254 | 10543 | 54.75 | 884 | 868 | 176.7 |
| A | 3 | 137 | 8006 | 40.4 | 884 | 868 | 176.7 |
| A | 0 | 226 | 7583 | 38.0 | 884 | 868 | 176.7 |
| B | 12 | 111 | 20272 | 115.78 | 871 | 848 | 167.8 |
| B | 11 | 111 | 18586 | 105.73 | 871 | 848 | 167.8 |
| B | 14 | 111 | 16837 | 95.3 | 871 | 848 | 167.8 |
| C | 14 | 238 | 132094 | 675.06 | 831 | 835 | 194.4 |
| C | 2 | 16 | 15927 | 77.62 | 831 | 835 | 194.4 |
| C | 14 | 225 | 7942 | 36.55 | 831 | 835 | 194.4 |
| D | 1 | 52 | 944474 | 4315.35 | 819 | 800 | 218.7 |
| D | 8 | 195 | 429264 | 1959.33 | 819 | 800 | 218.7 |
| D | 2 | 234 | 25168 | 111.43 | 819 | 800 | 218.7 |
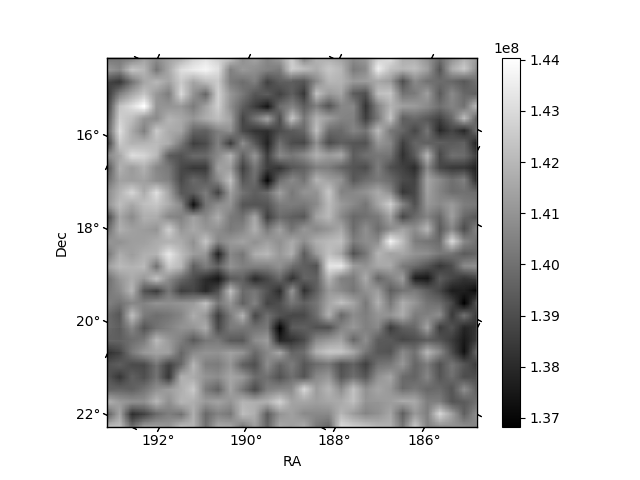
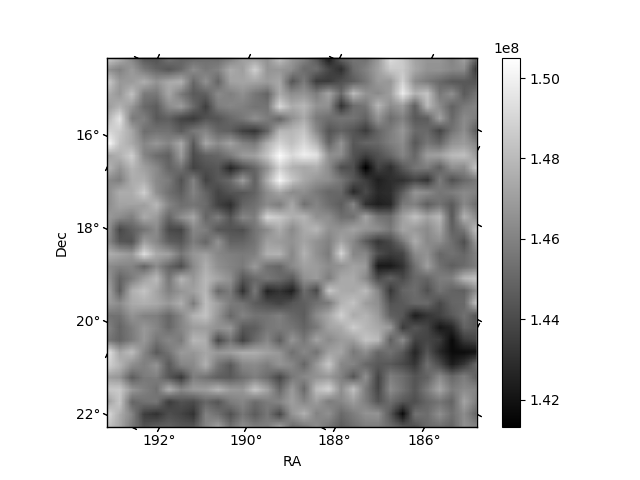
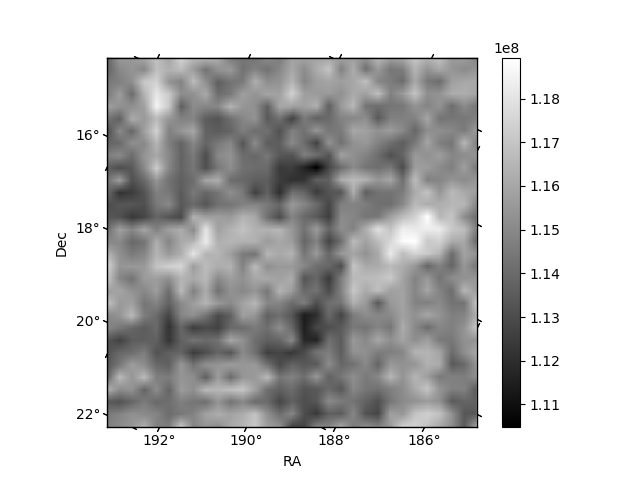
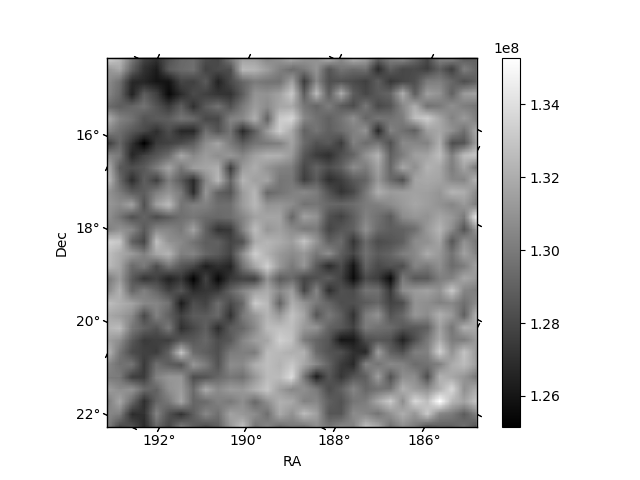
Histogram calculated using DETX and DETY for each event in the final _common_clean file
| Quadrant A | 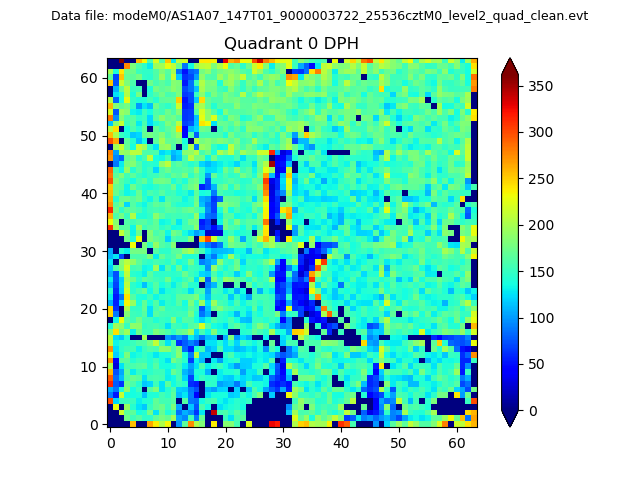 |
 |
Quadrant B |
|---|---|---|---|
| Quadrant D | 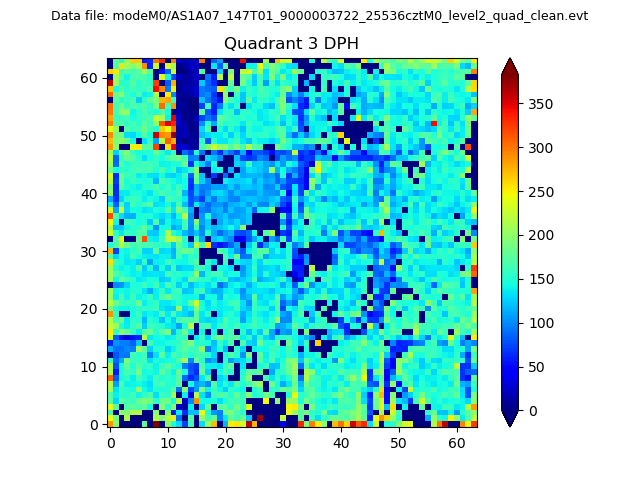 |
 |
Quadrant C |
| Plot type | Count rate plots | Images |
|---|---|---|
| Comparison with Poisson distribution Blue bars denote a histogram of data divided into 1 sec bins. Red curve is a Poisson curve with rate = median count rate of data. |
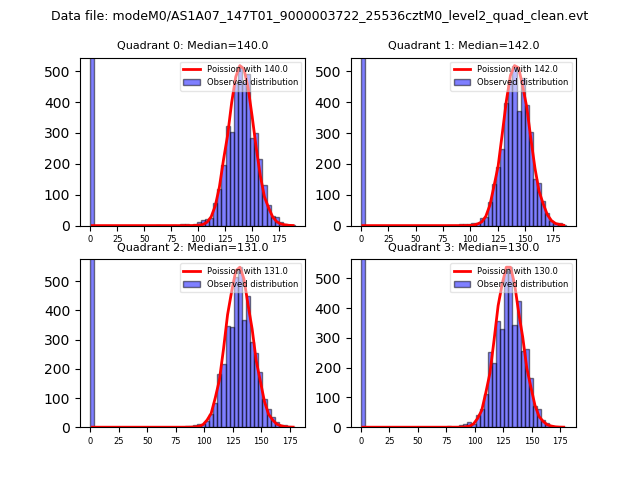 |
 |
| Quadrant-wise count rates Data is divided into 100 sec bins |
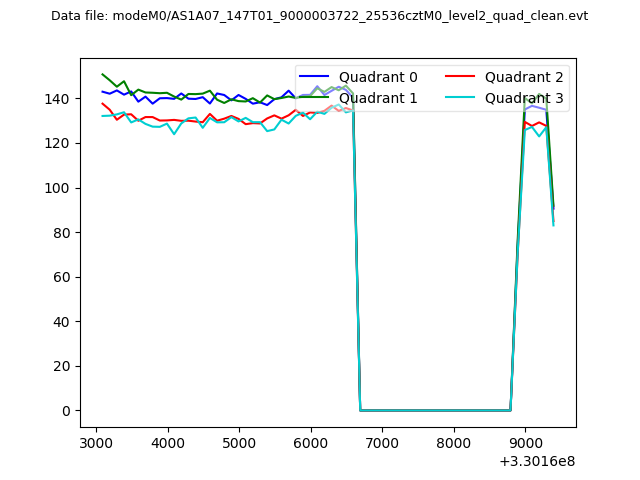 |
|
| Module-wise count rates for Quadrant A Data is divided into 100 sec bins |
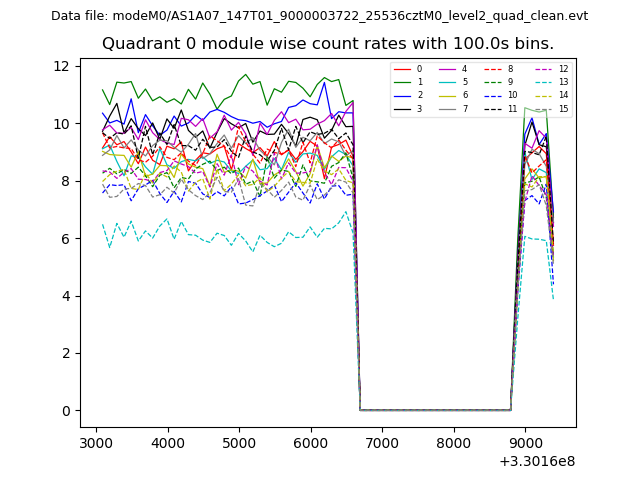 |
 |
| Module-wise count rates for Quadrant B Data is divided into 100 sec bins |
 |
 |
| Module-wise count rates for Quadrant C Data is divided into 100 sec bins |
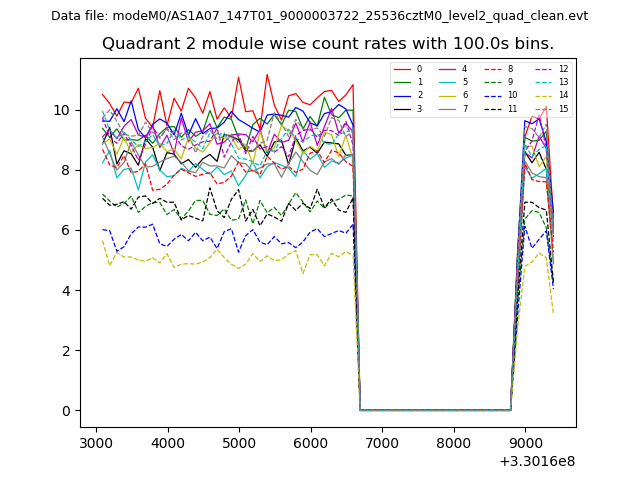 |
 |
| Module-wise count rates for Quadrant D Data is divided into 100 sec bins |
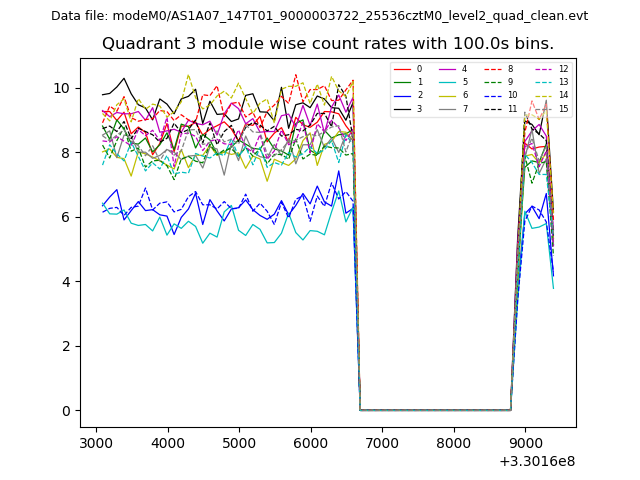 |
 |
| Parameter | Plot |
|---|---|
| CZT HV Monitor |  |
| D_VDD | 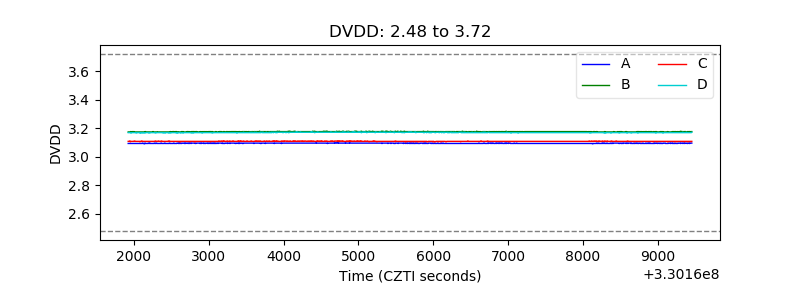 |
| Temperature 1 | 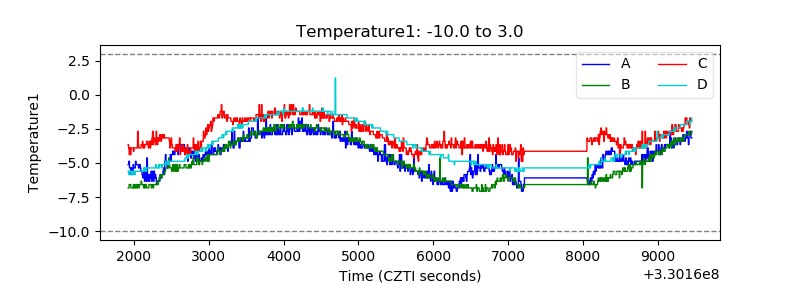 |
| Veto HV Monitor | 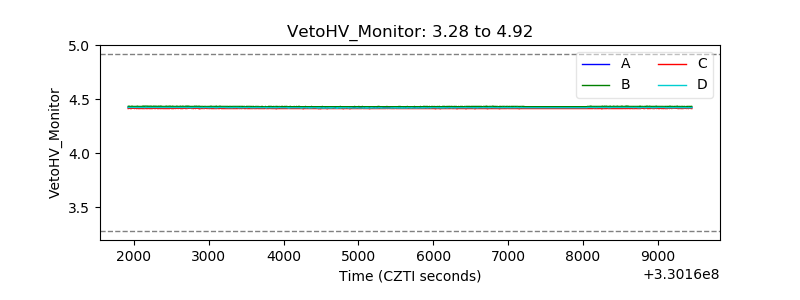 |
| Veto LLD | 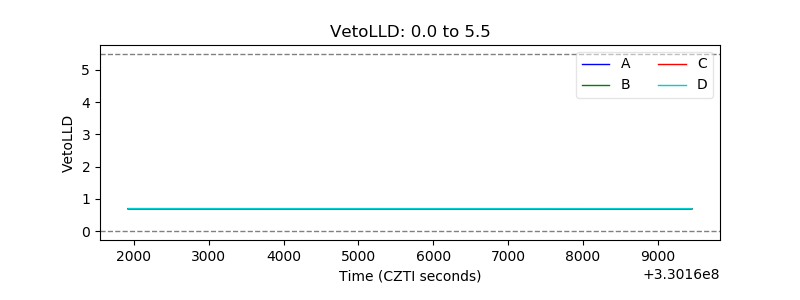 |
| Alpha Counter | 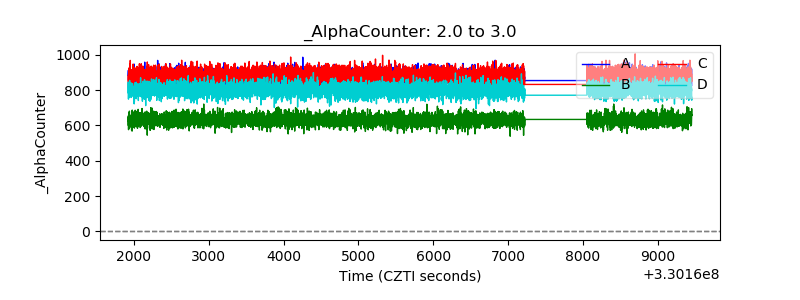 |
| _CPM_Rate | 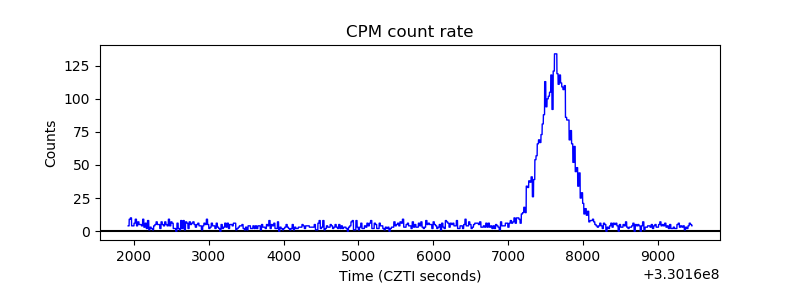 |
| CZT Counter | 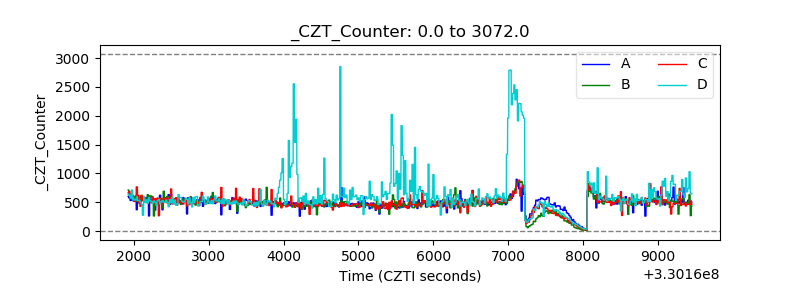 |
| +2.5 Volts monitor |  |
| +5 Volts monitor | 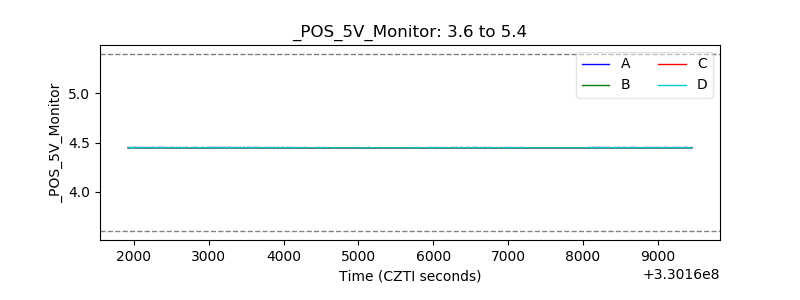 |
| _ROLL_ROT | 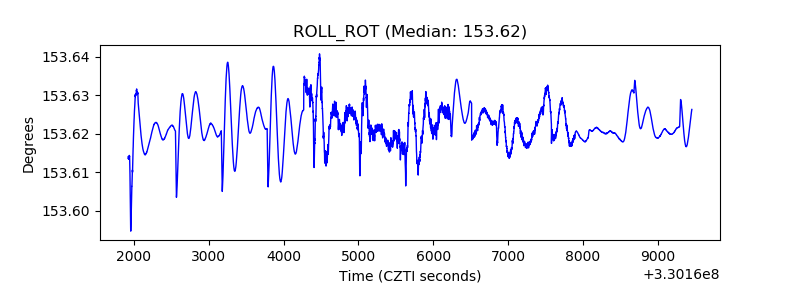 |
| _Roll_DEC | 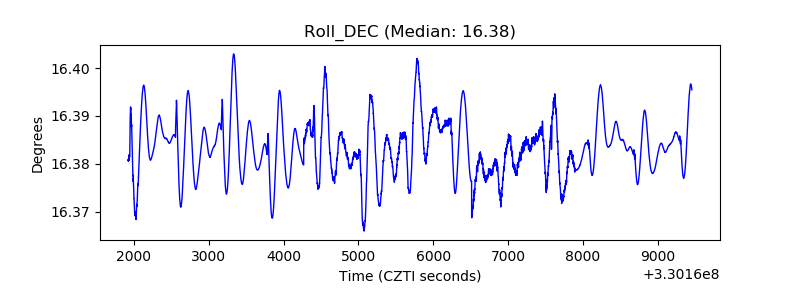 |
| _Roll_RA | 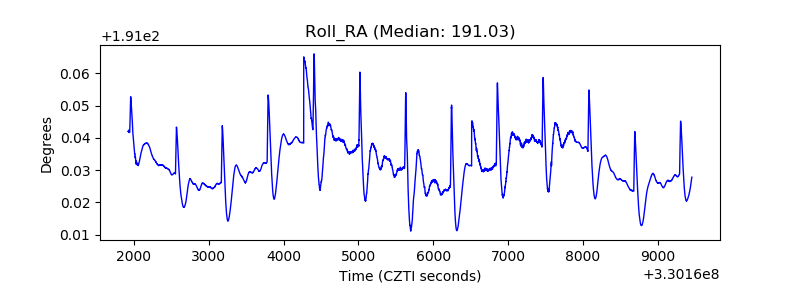 |
| Veto Counter | 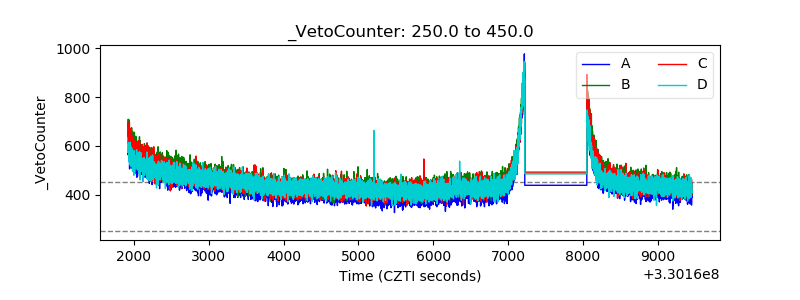 |