| Param | Original file | Final file |
|---|---|---|
| Filename | modeM0/AS1A07_147T01_9000003722_25537cztM0_level2.evt | modeM0/AS1A07_147T01_9000003722_25537cztM0_level2_quad_clean.evt |
| Size (bytes) | 596,266,560 | 98,850,240 |
| Size | 568.6 MB | 94.3 MB |
| Events in quadrant A | 3,702,667 | 639,024 |
| Events in quadrant B | 3,745,950 | 647,682 |
| Events in quadrant C | 4,138,310 | 603,515 |
| Events in quadrant D | 5,963,062 | 581,674 |
| Mode M0 | |||
|---|---|---|---|
| Quadrant | BADHDUFLAG | Total packets | Discarded packets |
| A | 0 | 15530 | 0 |
| B | 0 | 15623 | 0 |
| C | 0 | 16911 | 0 |
| D | 0 | 22892 | 0 |
| Mode M9 | |||
|---|---|---|---|
| Quadrant | BADHDUFLAG | Total packets | Discarded packets |
| A | 0 | 5 | 0 |
| B | 0 | 6 | 0 |
| C | 0 | 6 | 0 |
| D | 0 | 6 | 0 |
| Quadrant | Total seconds | Saturated seconds | Saturation percentage |
|---|---|---|---|
| A | 7488 | 180 | 2.403846% |
| B | 7488 | 201 | 2.684295% |
| C | 7488 | 270 | 3.605769% |
| D | 7487 | 417 | 5.569654% |
Noise dominated data is calculated using 1-second bins in cleaned event files. If a bin has >2000 counts, and if more than 50% of those come from <1% of pixels, then it is considered to be noise-dominated and hence unusable.
| Quadrant | # 1 sec bins | Bins with >0 counts | Bins with >2000 counts | High rate bins dominated by noise | Noise dominated (total time) | Noise dominated (detector-on time) | Marked lightcurve |
|---|---|---|---|---|---|---|---|
| A | 7933 | 7489 | 0 | 0 | 0.00% | 0.00% | 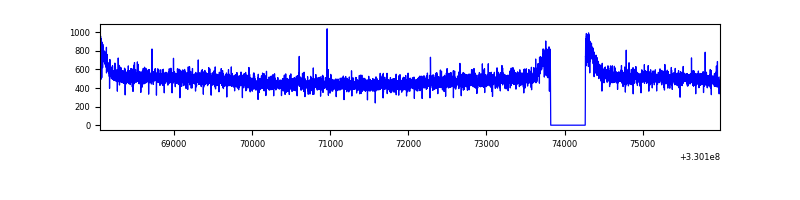 |
| B | 7933 | 7489 | 1 | 1 | 0.01% | 0.01% | 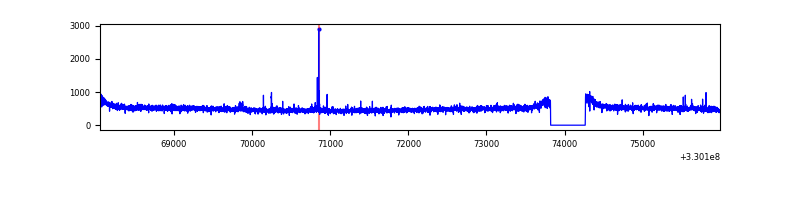 |
| C | 7933 | 7489 | 39 | 39 | 0.49% | 0.52% | 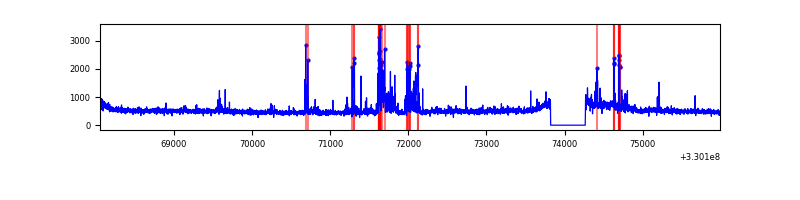 |
| D | 7932 | 7488 | 211 | 211 | 2.66% | 2.82% | 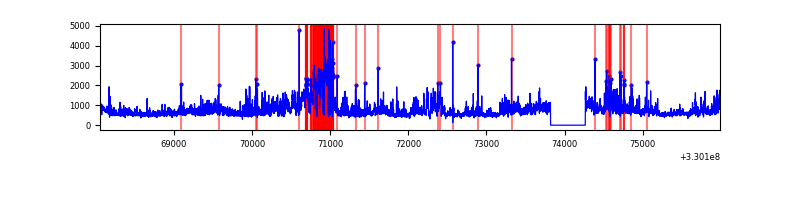 |
Top three noisy pixels from each quadrant. If the there are fewer than three noisy pixels in the level2.evt file, extra rows are filled as -1
| Pixel properties | Quadrant properties | ||||||
|---|---|---|---|---|---|---|---|
| Quadrant | DetID | PixID | Counts | Sigma | Mean | Median | Sigma |
| A | 13 | 254 | 11603 | 55.12 | 958 | 939 | 193.5 |
| A | 3 | 137 | 8971 | 41.52 | 958 | 939 | 193.5 |
| A | 0 | 226 | 8242 | 37.75 | 958 | 939 | 193.5 |
| B | 12 | 111 | 22492 | 118.24 | 948 | 923 | 182.4 |
| B | 0 | 190 | 21887 | 114.93 | 948 | 923 | 182.4 |
| B | 11 | 111 | 20745 | 108.67 | 948 | 923 | 182.4 |
| C | 2 | 16 | 432219 | 2018.03 | 908 | 910 | 213.7 |
| C | 14 | 238 | 143599 | 667.62 | 908 | 910 | 213.7 |
| C | 3 | 233 | 28053 | 127.0 | 908 | 910 | 213.7 |
| D | 1 | 52 | 2073827 | 8617.43 | 908 | 888 | 240.6 |
| D | 8 | 195 | 307172 | 1273.26 | 908 | 888 | 240.6 |
| D | 2 | 244 | 78375 | 322.12 | 908 | 888 | 240.6 |
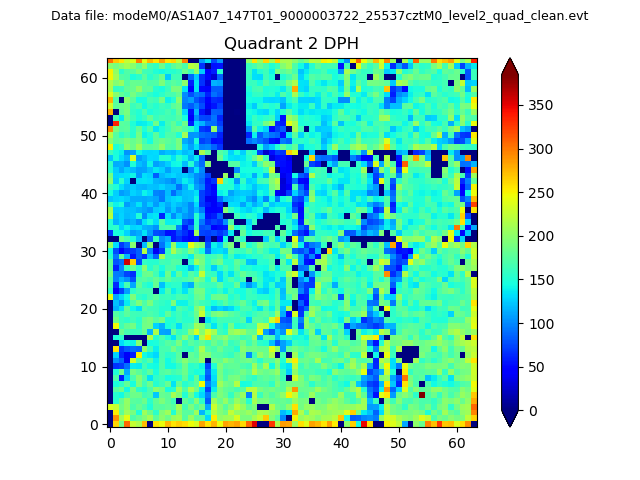
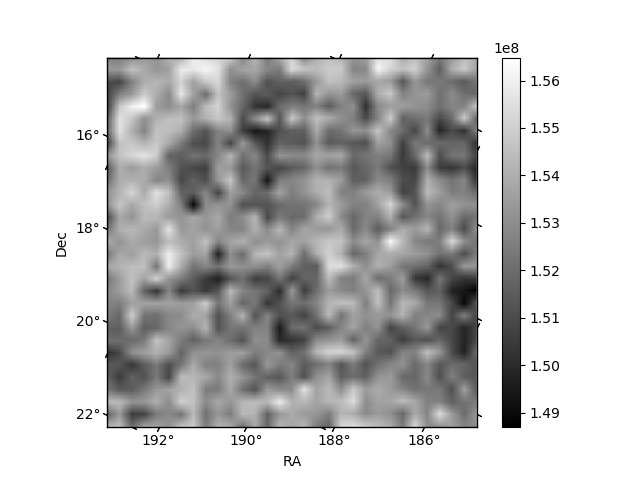
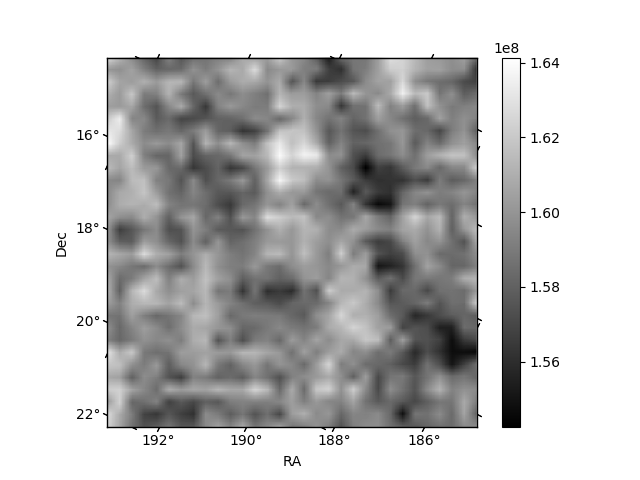
Histogram calculated using DETX and DETY for each event in the final _common_clean file
| Quadrant A | 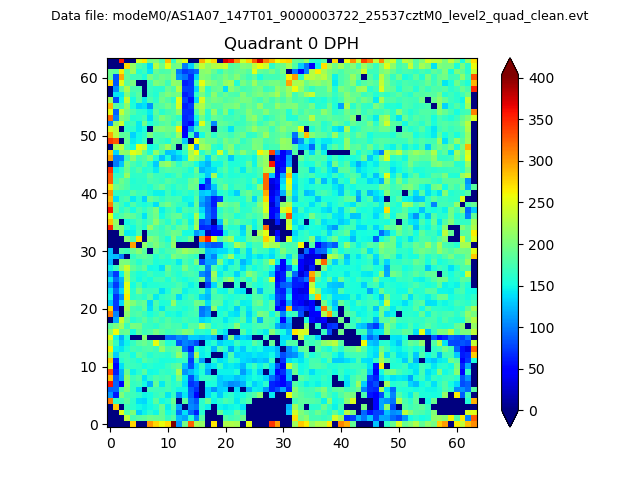 |
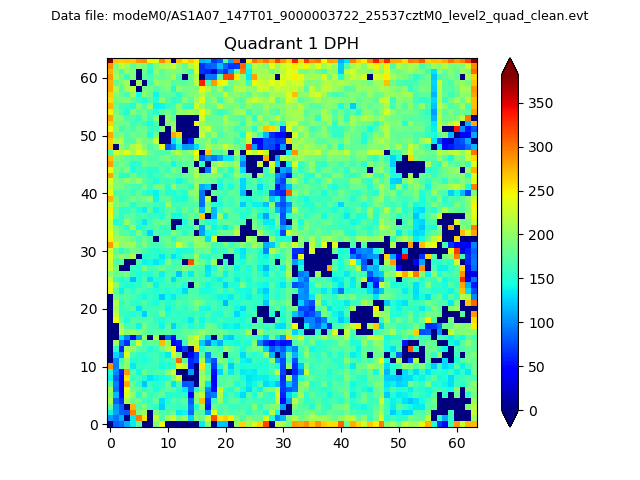 |
Quadrant B |
|---|---|---|---|
| Quadrant D | 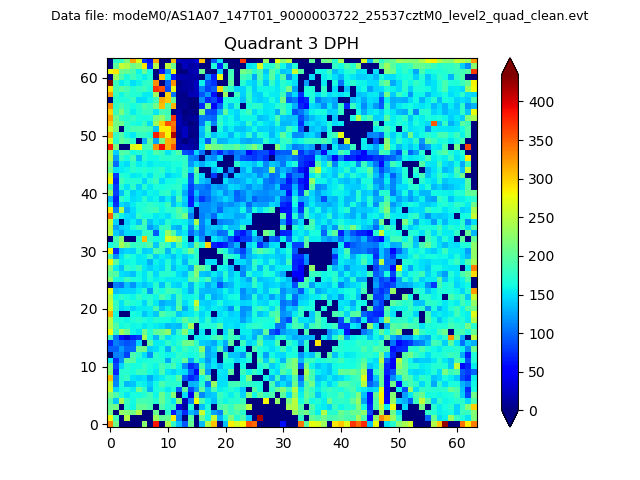 |
 |
Quadrant C |
| Plot type | Count rate plots | Images |
|---|---|---|
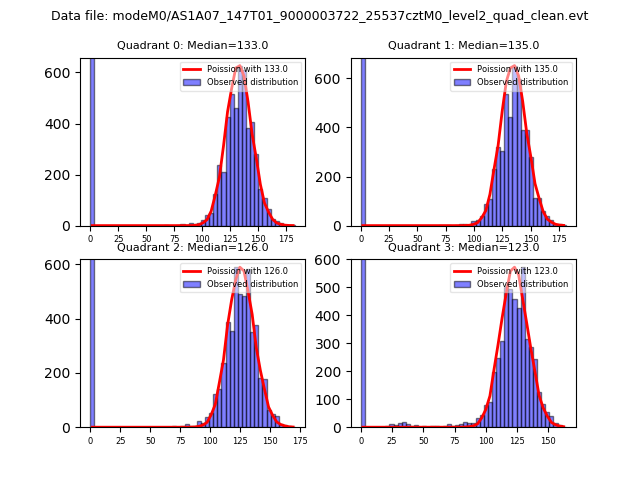
| Comparison with Poisson distribution Blue bars denote a histogram of data divided into 1 sec bins. Red curve is a Poisson curve with rate = median count rate of data. |
 |
 |
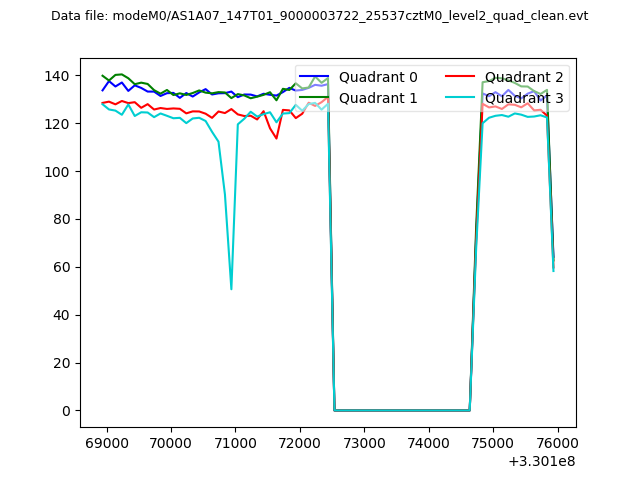
| Quadrant-wise count rates Data is divided into 100 sec bins |
 |
|
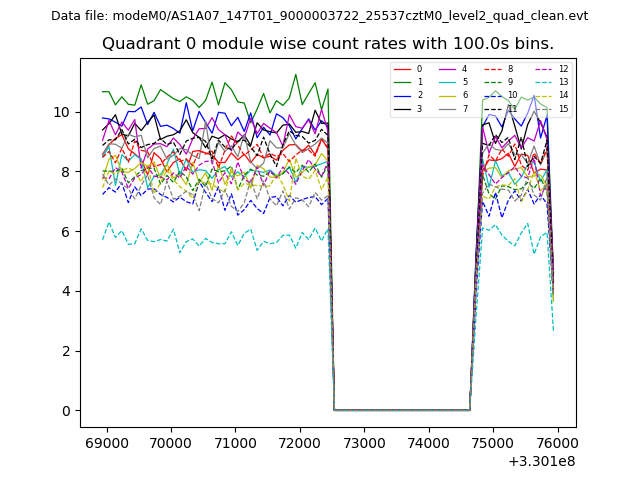
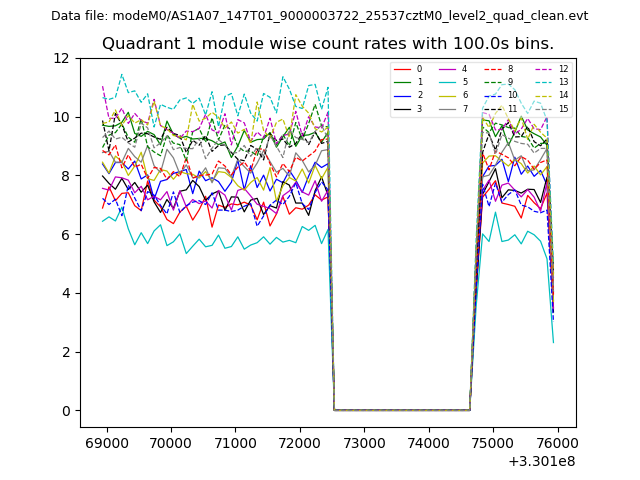
| Module-wise count rates for Quadrant A Data is divided into 100 sec bins |
 |
 |
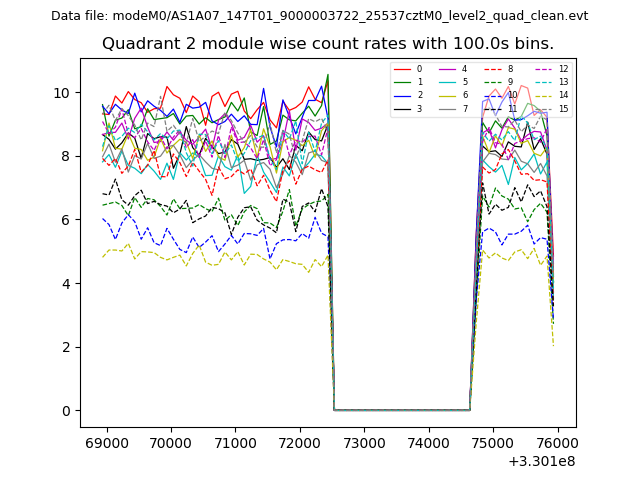
| Module-wise count rates for Quadrant B Data is divided into 100 sec bins |
 |
 |
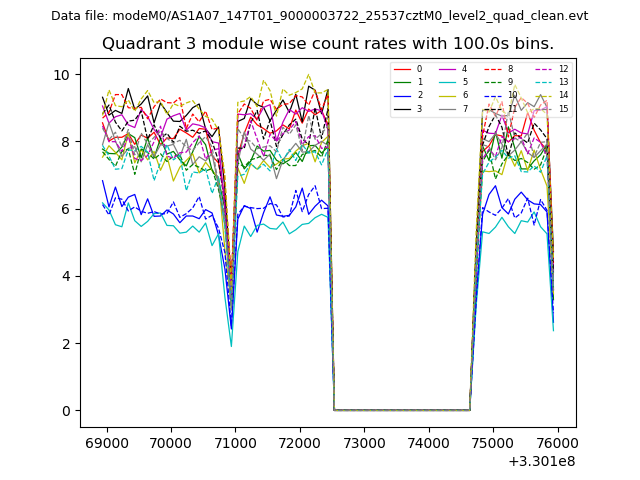
| Module-wise count rates for Quadrant C Data is divided into 100 sec bins |
 |
 |
| Module-wise count rates for Quadrant D Data is divided into 100 sec bins |
 |
 |
| Parameter | Plot |
|---|---|
| CZT HV Monitor | 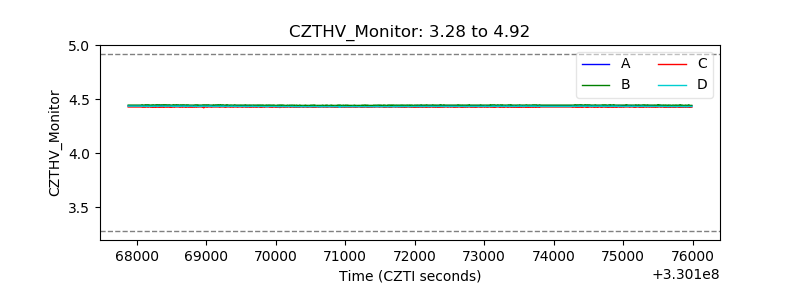 |
| D_VDD | 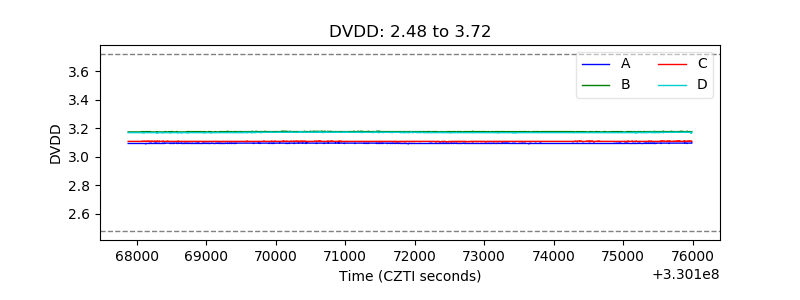 |
| Temperature 1 | 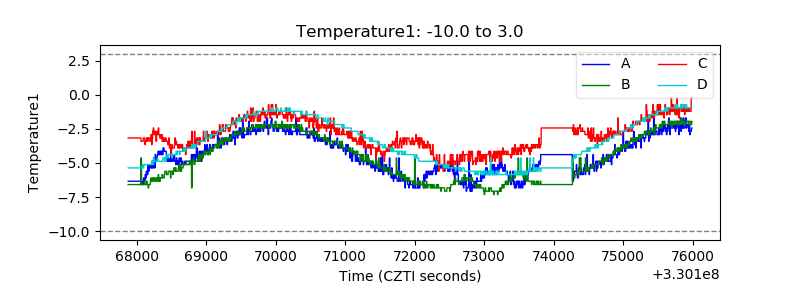 |
| Veto HV Monitor |  |
| Veto LLD | 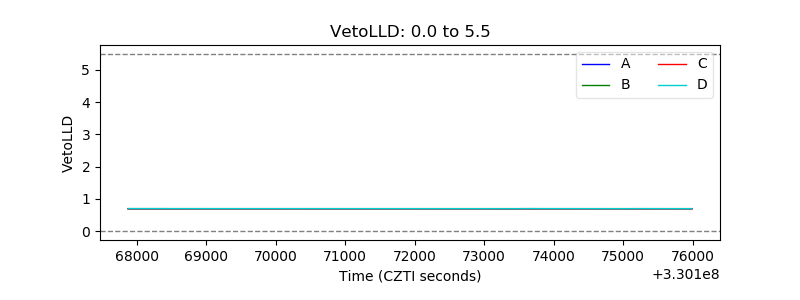 |
| Alpha Counter | 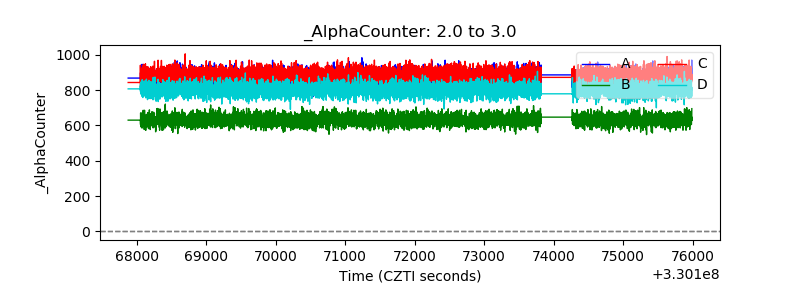 |
| _CPM_Rate | 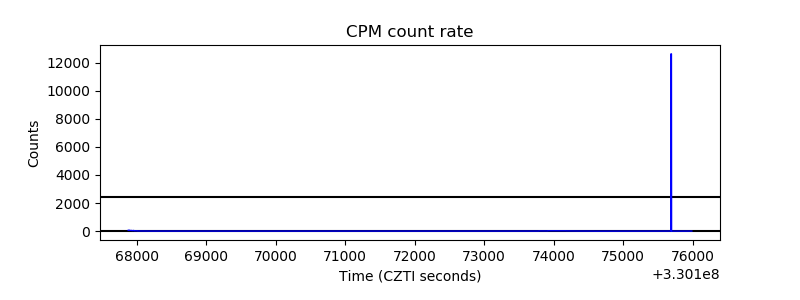 |
| CZT Counter | 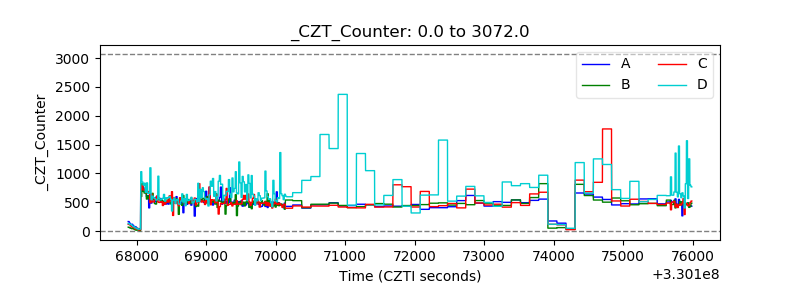 |
| +2.5 Volts monitor | 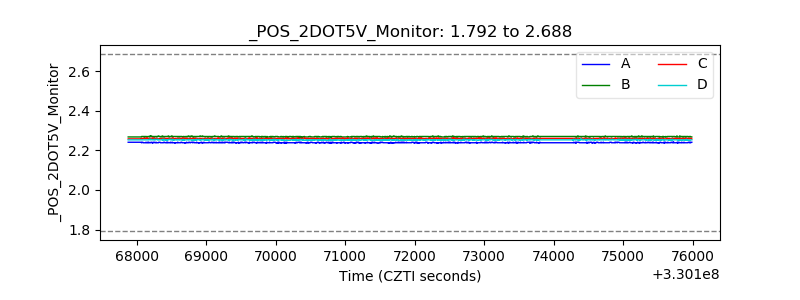 |
| +5 Volts monitor |  |
| _ROLL_ROT | 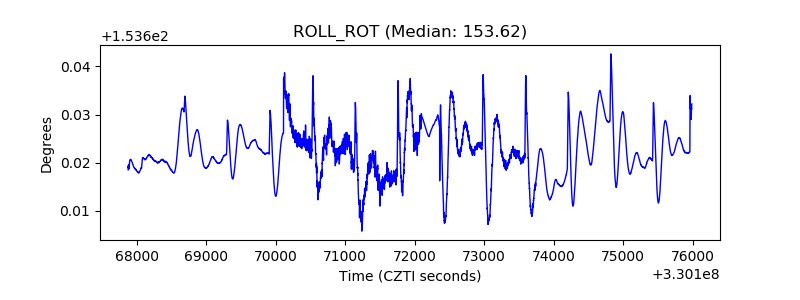 |
| _Roll_DEC | 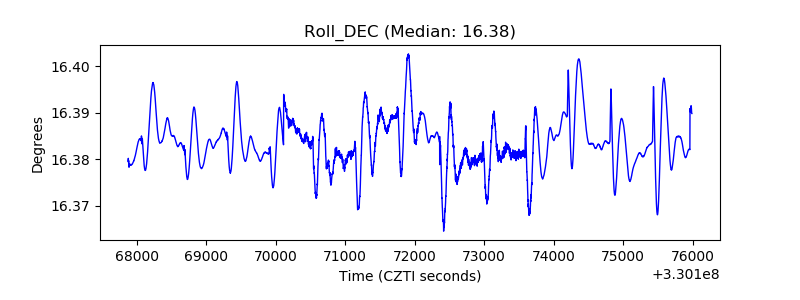 |
| _Roll_RA | 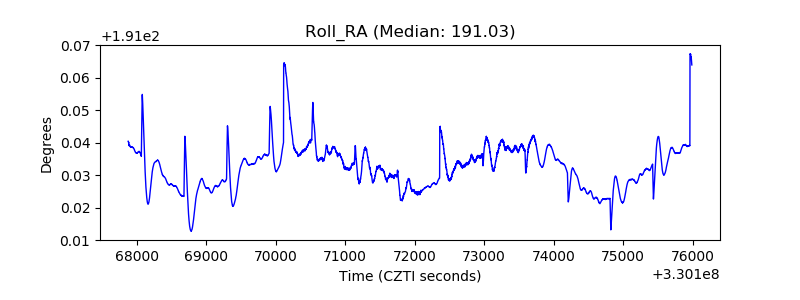 |
| Veto Counter | 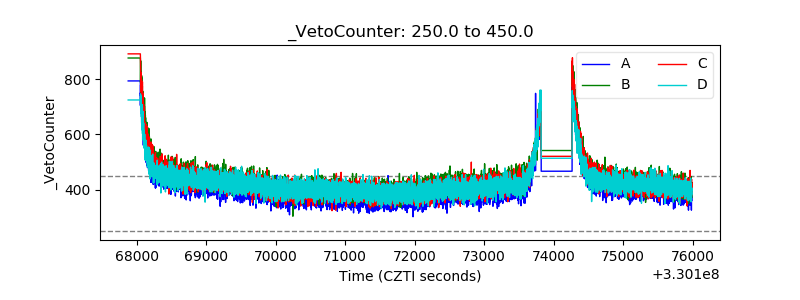 |